Journal of Pollution Effects & Control
Open Access
ISSN: 2375-4397
ISSN: 2375-4397
Review Article - (2018) Volume 6, Issue 3
Keywords: Pollution; Mineral pollutants; Pollutant flow; Automobile traffic; Air flow; Air quality
Dakar region, located on the 15th parallel to the boundary of the Atlantic ocean and the African continent, at latitude 14.73° and longitude 17.5°, has a Canarian climate with subtropical maritime and continental characters. The Senegalese capital represents 0.3% of the national territory and concentrates 24% of the Senegalese population, with a density of 5404 inhabitants per km2 [1]. The high concentration of industries and economic activity associated with high demography may explain the importance of transport in Dakar. The transport sector is very dynamic because of intense economic activity and a high concentration of schools (30.7%) in Dakar [2]. Mobility is important, with 1751900 trips per day in public transport [3].
Car transport is one of the most polluting sectors of human activity. An estimate of the contribution of gaseous pollutants by transport mainly can help to understand the pollution levels taking into account meteorological parameters. The increasing number of vehicles causes congestion problems that reduce speeds, producing higher amounts of flue gas. The car exhausts produce among other polluting gases, carbon monoxide (CO), nitrogen oxides NOx (NO and NO2) [4].
The atmosphere is comparable to a chemical system in which a complex of oxidative reactions including these gases produced by vehicles abound and whose main precursor is the hydroxyl radical [5]. The composition of the atmosphere depends not only on biogenic and anthropogenic emissions strongly marked by motor transport but also on meteorological parameters such as wind, relative humidity and precipitation. The chemical processes related to the interaction between solar radiation and polluting gas molecules are not taken into account in the modification of the concentration because these phenomena take place at altitudes higher than 1 km corresponding to pressures lower than 800 hPa [6].
Some photochemical processes representing the sources of the polluting gases measured by the Technical Control Center for Motor Vehicles (CCTVA) and the analyzers of the air quality measurement stations in Dakar will be presented. The main sources of polluting gases identified in urban centers are industries and motor transport. The importance of motor vehicles, their low speed of travel and the fuel burning conditions make transportation the main cause of urban pollution. In this chapter we will:
1. On the one hand, show the importance of automobile traffic in Dakar marked by a dilapidated fleet and the contribution of the engine type of the vehicles in association with their age on the emissions of chemical pollutants like hydrocarbons (HC), the monoxide of carbon (CO) and carbon dioxide (CO2).
2. On the other hand, study the evolution in the lower atmosphere of Dakar pollutant concentration by an analysis of their horizontal flows subjected to meteorological conditions such as wind speed, relative humidity and precipitation for the years 2014 and 2015.
Due to its location in latitude and continental position in the extreme west of the African continent, Senegal belongs to the tropical climate zone characterized by two highly contrasting seasons. The climatic mechanism of West Africa in general is governed by two permanent anticyclones (centers of high atmospheric pressure) namely the Saharan anticyclone formed of dry air and the oceanic anticyclone formed of humid air.
The low-altitude discontinuity surface between hot and cold air masses is called Intropical Front (ITF); it is also called Intertropical Convergence Zone at high altitude (ITCZ) by geographers. The annual oscillation of the Intertropical Front imposes on Dakar, like all around Senegal, two well-characterized seasons:
1. The rainy season: from July to October, during which Dakar is under the influence of ITF in the region of low equatorial pressures.
2. The dry season: from November to May, during which Dakar is at the north of the ITF in the region of subtropical anticyclones.
Pressure-temperature-humidity: Geographic position largely determines the aero logical characteristics of a given region of the Earth. Meteorological parameters are highly dependent on geographic coordinates, which further delineate the areas of influx of the main air currents that characterize a given climate.
Because of its geographical position, Dakar has low pressure variations on the ground and at different altitudes of the troposphere. This latitude associated with the proximity of the sea also explains small amplitude of the annual variation of the temperature. Indeed, the annual temperature differences are 7 to 8°C at 0 hour. Beyond an altitude of 3000 m, the temperature remains almost constant throughout the year. The average altitude of the tropopause is about 17 km and its average temperature is about -74°C [7]. At night, the relative humidity in the vicinity of the ground is always high (more than 70%) and its altitude distribution varies with the seasons.
Low altitude wind regime: Senegal is characterized by the existence of three major air currents: the maritime trade wind, the harmattan and the monsoon. The maritime trade wind blowing in Dakar is mainly linked to its position on the Atlantic Ocean facade. The general movement of the air is descending for the trade wind and the harmattan while the flow is rising for the monsoon.
The trade wind is a current led by the oceans anticyclones (the Azores); it is a northeasterly or northwesterly wind which brings fresh humid tropical air. It blows on the western coast from November to June and Dakar is practically at its southern limit. In the interior of the continent it does not practically fall below the 16th parallel.
The harmattan is a wind driven by the Saharan anticyclone, it comes from East or North-East and is hot dry and dusty. In Senegal, it is well installed during the year from November to March. On the Atlantic coast, where Dakar is located, it is in conflict with the maritime trade wind; thus, it can push back the trade winds or pass over them.
The monsoon is a wind blowing from the west or southwest, usually from the end of June to the beginning of October, a period corresponding to the rainy season. Because of the very northern position of Dakar in relation to the monsoon, the periods corresponding to this air current are rarely long. Permanent monsoons are rare because of the frequent incursion of northerly or sometimes by easterly winds occurring when equatorial ones that occupy most of the troposphere descend to the ground at the east, to repel the monsoon.
Inversion of temperature to soil vine: A fundamental feature of the atmosphere’s structure between 0 and 2000 m is the existence of a temperature inversion at the soil neighbor ship. An inversion layer is an air layer in which the temperature increases near the ground with altitude instead of following its normal decay law. The thickness of the inversion layer varies according to the months of the year and can disappear at low altitude (less 500 m) as for the month of August (Figure 1).

Figure 1: Annual evolution of temperature inversion in Dakar.
A temperature inversion occurs in calm weather under particular weather conditions resulting from the encounter between a cold front and air masses of higher temperature. The latter, because of their lower density, rises above the layer of cold air; this phenomenon is established up to a certain limit altitude called the inversion ceiling [8].
The curve of the annual evolution of temperature gives the curves of the thermal structure of the low troposphere of Dakar at midnight (00 h). These curves, represented over a period of three observation periods, do not represent the averages but the types of inversion frequently encountered at different times of the year.
Two major findings emerge from these inversion curves:
1. The inversion is almost permanent during the dry season which is established from November to June, its base is practically on the ground and its top located between 250 and 500 m.
2. During the rainy season the thermal inversion is infrequent and less obvious than during the dry season, its base is higher (1000 m) and its top is between 1500 and 2000 m. In the rainy season, it disappears completely.
Temperature inversion and pollution: In normal weather conditions, the temperature decreases with altitude so that the pollutants emitted on the ground rise and disperse, this physical phenomenon fades as soon as there is a temperature inversion. The existence of inversion of temperature favors an accumulation of pollutants in the air especially in urban environment because at the ceiling of inversion, the pollutants will not be able to disperse any more.
The temperature inversion generally present in Dakar during certain months of the dry season can partly explain some peaks of daily pollution observed by the Air Quality Management Center (CGQA) and also the urban smog, in some agglomerations, which consists of a thick layer of fog associated with a high concentration of several atmospheric pollutants [8].
The existence of a temperature inversion conch in the Dakar region then appears as an aggravating factor of atmospheric pollution.
Road network
The transport sector is very dynamic in the mobility of people and goods in the city of Dakar which concentrates 23% of the population of Senegal and 90% of the industrial fabric of the country. The support of all human activity implies a very important automobile traffic and concomitantly a very dense road network which is the principal way of displacement.
The road network in the Dakar region consists of 502 km of 485 km of “covered roads” (96%) and the rest by “dirt roads” [2]. In terms of distribution, urban roads predominate with 382 km or about 76%. This road network is growing with the construction of roads in the new city of Diamniadio.
The macrocephaly of the Dakar region gives it the largest share of road infrastructure in Senegal; the road network in Dakar is outstripping that of other cities in the country and is constantly growing as a result of policies to strengthen urban mobility and the opening up of its suburbs and the service of localities in the interior. For this purpose in the city of Dakar, important chantiers were made in particular an increase in the number of lanes on the roadway, the construction of bypass roads, a highway to the new city of Diamniadio and the new Blaise Diagne International Airport.
The map in Figure 2 illustrates the road projects initiated in 2012, almost all of which were completed; the traffic flow by road allows us to estimate the impact on the decongestion of the urban creeks.

Figure 2: Fleet breakdown by region in 2013.
The car fleet
The national car fleet grew from 7.3% in 2012 to 7.4% in 2013, and the number of registered vehicles increased from 374384 to 401970 between these two years. The Dakar region alone accounts for 72.8% of the country’s car fleet (Figure 3). The importance of human mobility and goods with 1751900 trips per day in public transport EMTASUD [3] explains the large number of motor vehicles in the city of Dakar.

Figure 3: Terrestrial transport directorate.
The car fleet consists mostly of used vehicles; newly purchased motor vehicles represent only 27.2% until 2013. However, the number of new vehicles purchased increased from 25.1% in 2011 to 27.2% in 2013 [2]. Despite road infrastructure policies, namely the widening of the roadway, the construction of bridges and interchanges in the city of Dakar, traffic jams persist and cause slow movement of vehicles in the city center. The engines of idling vehicles, especially the older ones, produce a lot of gaseous pollutants in their mufflers. These gases, emitted for the most part, alter the quality of the air and contribute to global warming by contributing significantly to the greenhouse effect.
In this chapter, we will limit ourselves to studying the physical evolution of COx (CO and CO2) carbon oxides and nitrogen oxides NOx (NO and NO2) to assess their impact on the quality of the air in Dakar for the years 2014 and 2015. Indeed, the motor transport sector is the biggest source of urban pollution, especially for the cities where the park is obsolete.
By way of comparison, in European countries where the car fleet is less old than in Africa, automobile transport is responsible for 55% of CO emissions and 36% of NOx emissions, the other chemical pollutants emitted are hydrocarbons at height. 21%, plus 12% PM [9].
Nitrogen oxides
Sources of nitrogen oxides NOx: NO and NO2 Nitrogen oxides are the main indicator of automobile pollution; high concentrations noted twenty years ago have become lower in urban centers thanks to the introduction of the catalytic converter of motor vehicles and the renewal of the parking. In the upper troposphere, lightning also draws NOx, which is more efficient in producing ozone than surface, because its lifespan is higher; but the concentrations generated at this altitude are difficult to estimate.
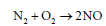
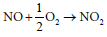
With a high proportion of NO2, the nitrogen oxides NOx (NO and NO2) produced in the atmosphere come largely from the combustion, in vehicle engines, hydrocarbon and air mixtures that contains about 70% of nitrous (N2). Anthropogenic nitrogen oxides in the low atmosphere of urban environments come from 60% of transport [10,11], they result from the combustion of nitrous air (N2) in motor vehicles in a twophase process [12]:
Certain fuel additives consisting of nitrogenous organic compounds (amines, amino acids and nitriles) can also produce NOx nitrogen oxides during combustion processes. Nitric oxide NO produced in this case is formed more rapidly than in the case of nitrous; this is explained by the low binding energies of the nitrogen atom with its neighbors in the molecules of these additives compared to that of the nitrous as shown in Table 1.
| Liaisons | Energie de liaison (kcal/mol) |
|---|---|
 |
225.9 |
| H-NH2 | 103 |
| O-NO | 73 |
| O2N-N | 10 |
Table 1: Binding energy of the nitrogen atom.
Vibrational modes of NO2: NO2 and CO2, is a non-linear molecule with a central atom (nitrogen) linked to two oxygen atoms. This molecule has three (3) modes of vibration of which two are elongations or “stretching” and one of type deformation or “bending” [13].
The spectral variable used is the wave number

The nitrogen dioxide molecules emitted in the lower atmosphere absorb solar radiation in the mid-infrared where the wavenumber is between 200 cm-1 and 4000 cm-1, this physical characteristic is enough to show that nitrogen oxides do not have a clear effect in the greenhouse effect but constitute a pollutant gas that can be the basis of tropospheric ozone production (Figure 4).

Figure 4: Modes of vibration of nitrogen dioxide.
Unlike diatomic molecules such as dioxygen and dinitrogen where the absorption bands are mainly in the ultraviolet because of the high binding forces between the atoms that require relatively high photons of energy, the NO2 dioxide of the same that nitrous oxide N2O have absorption bands located mostly in the infrared. Indeed molecules with three or more atoms are more easily disturbed by light radiation because the necessary wavelengths are larger and located in the infrared. Unlike carbon dioxide, nitrogen dioxide and more generally nitrogen oxides are not greenhouse gases because they do not exhibit an absorption spectrum in the infrared thermal range of the infrared where the wavelengths are greater than 3 μm [14].
Structures
Structures of NO and NO2: The structures of the nitric oxide and nitrogen dioxide molecules can be represented by the Lewis theory in the scheme below. The presence of the π bond and the single electron justifying their radical nature explains their instability or their reactivity with neighboring molecules.
Lewis structure of nitric oxide (Figure 5a);

Figure 5a: Lewis structure of nitric oxide.
The structure of the nitrogen dioxide molecule can be established by Lewis’s theory considering two possibilities:
1. The single electron on the oxygen atom (Figure 5b);

Figure 5b: The single electron on the oxygen atom.
2. The single election on the nitrogen atom (Figure 5c);

Figure 5c: The single election on the nitrogen atom.
The NO2 molecule is bent because of the single electron that occupies a particular direction around the nitrogen atom causing low intensity repulsion on the binder doublets compared to that exerted by a free doublet. The binding angle of the molecule is therefore of the order of 134° greater than 120°.
In addition, nitrogen dioxide can dimerize by pooling covalently to give N2O4
2NO2→N2O5
Nitrogen dioxide can also be the basis of a production of a powerful secondary pollutant; ozone following a photolysis reaction of NO2 molecules.
NO2 +hv→No+O
O+O2→O3
Scheme 1: Photolysis of NO2
In polluted cities, nitrogen dioxide NO2, thanks to radiation with a wavelength of less than 420 nm, can lead to the formation of tropospheric ozone (Scheme 1). This secondary pollutant can cause irritation of the eyes at the human level but could also be a cause of excess mortality [15,16], and in environmental terms, it can also attack vegetation because it destroys chlorophyll [17,18].
Carbon monoxide
Sources of carbon monoxide: CO is one of the most common pollutants and the most toxic for humans, it’s dangerous nature for humans is linked to its strong affinity with hemoglobin. Its sources (biomass combustion, hydrocarbons, heating, transportation, industrial activities) are found in cities like Dakar. Its low density of 0.97 explains its dispersion and its rapid transport in the air. It is produced during the combustion of organic materials carried out in the presence of an insufficient amount of oxygen.
In automobile combustion chambers, the low duration of the oxidation process, the lack of homogeneity of the carbide mixture, the heterogeneity and the rapid temperature variations do not allow the ideal thermodynamic equilibrium to be reached to the formation of carbon dioxide. These conditions lead to the escape of cars from incomplete combustion products [12].
Once emitted into the atmosphere, the CO can be eliminated by oxidation either by the oxygen or by the hydroxyl radical according to the following schemes:
Co+1/2O2→CO2 et
CO+∙oOH→CO2+o∙
However, the atmospheric pollution of CO with the OH radical is most likely because of the high temperatures required for the first oxidation; this reaction plays a significant role in tropical atmospheres because of the importance of solar radiation. This process produces carbon dioxide and atomic hydrogen [19,20]. These polluting gases emitted into the environment have a strong influence on air quality. An increase in their concentration associated with high amounts of solid particles in the air can lead to mists.
Hydrocarbons
They usually come from the incomplete combustion of motor fuels, these hydrocarbons emitted by the exhaust pipes of cars result from a heterogeneous mixture on the walls of the combustion chambers and therefore at low temperatures. On the other hand, carbon monoxide and nitrogen oxides result from the combustion processes in homogeneous phase. These hydrocarbons are emitted in large proportion in the form of unburned cars running on gasoline.
The hydrocarbons emitted by car exhausts can, in certain proportions, be very harmful to health, they are of several types [12]:
1. Aromatics (mainly BTEX): 32%
2. Paraffins (linear chain alkanes): 33%
3. Olefins: 27%
4. Acetylenics: 8%
Principle of measures
A first analysis is carried out with the data available at the CCTVA, to compare the emissions of gas emissions of these pollutants depending on whether the engine is gasoline or diesel type, this study also takes into account the age of vehicles.
In the CCTVA, the proportions of CO of CO2, HC (hydrocarbons), and NOx are measured directly in the exhaust pipes of cars, thanks to a car analyzer (Auto 4-2) for a period of two minutes.
The available data concern a sample of 187 vehicles tested, of which 10% of gasoline type first made it possible, on the one hand, to draw up a profile of the emissions of these gases according to age and according to the type of engine and on the other hand relative emissions of CO and CO2 depending on the nature of the engine to assess the contribution of vehicles in urban air pollution. The brand of the motor vehicle was not taken into account in this study.
Five stations in the city of Dakar measure the quantities of atmospheric pollutants quite regularly. The collected data were averaged over the year 2015. It is noted that the collected data have a reliability of about 70%. On the other hand radiosondages allowed having during the day the speed and the direction wind, relative humidity and atmospheric pressure. In this study, surface winds were taken into account, which leads to consider altitudes corresponding to higher pressures or equal to 1000 hPa.
The stations are located at strategic locations chosen based on their proximity to emission sources such as industries or roads and the proximity of populations (Figure 6). The following types of stations can be distinguished in Dakar:

Figure 6: Map of air quality measurement stations in Dakar.
1. Medina station: Suburban type measures CO, NOx and PM10
2. Cathedral station: Surban type measures CO, NOx, SO2 and PM10
3. HLM station: Suburban type measure CO, NOx, SO2, O3, PM10
4. HLM station: Suburban type measure CO, NOx, SO2, O3, PM10
5. Yoff station: Regional type: measures NOx, O3 and PM10
NOx emission profiles according to vehicle age
The profile of NOx shows the contribution of transport marked by the high proportion of diesel vehicles in pollution. NOx emissions by diesel-type vehicles are higher than those of the gasoline type (Figure 7); they reach their maximum between 15 and 19 years; they are low for the gasoline type but increase significantly from 21 years. On average, the contribution of NOx by transport increases when the age of the vehicles is advanced.

Figure 7: NOx emissions profile for diesel and gasoline cars according to the age of vehicles.
Car transport in Dakar is a major contributor to NOx pollution due to the predominance of older cars generally of the diesel type, maintenance defects, the absence of catalytic converters on the level of the exhausts and the density of the traffic.
CO and CO2 emission profiles
Relative proportion of CO and CO2: The combustion of fuels with oxygen from the air in the engines of vehicles largely leads to carbon oxides. The CO2 carbon dioxide is produced in the case where the conditions of the reaction mixture are stoichiometric which represents an ideal situation of the combustion of organic compound. On the other hand, the toxic gas carbon monoxide at the same time in the combustion chambers of motor cars is considered to be imbricated because it can be converted into carbon dioxide by oxidation with the oxygen of the air, but the nature of the mixture and the conditions catalysts in the engine cause an incomplete reaction to occur producing it.
Whatever the type of motor, in operation there is a production of the two oxides of carbon; the relative proportions of these two gases make it possible on the one hand to evaluate the performance of the combustion chamber of the engine and thus of the vehicle and on the other hand its contribution, rotating engine, in atmospheric pollution and in global warming by its contributions in greenhouse gases.
In this study, for the sample of cars tested, we evaluated the CO/CO2 ratio of the carbon oxide volumes measured in the exhaust gas stream for a period of two minutes and then draw their profile according to the age of the vehicle which is not necessarily the age of the engine. The study of these CO/CO2 ratio variations of the carbon oxide volumes as a function of the age of the vehicles gave the profiles represented by Figures 8 and 9. The variations observed do not give a regular variation but in teeth. The age of the vehicle, however the trends in this report show their increase according to the number of years of operation.

Figure 8: CO/CO2 ratio for petrol type car according to the age of the vehicle.

Figure 9: CO/CO2 ratio for a diesel car according to the age of the vehicle.
We note that the regression line of the CO/CO2 volume ratio of the gases emitted by the exhaust pipes has a greater slope for diesel type cars than those of the gasoline type. With older age diesel engines produce more carbon monoxide CO than those of the gasoline type. In fact, the production of unbreasts or the incomplete combustion of automotive fuels by diesel type cars is 2.5 times.
Hydrocarbon emissions according to the age of the vehicle
Petrol-based motor vehicles are the largest sources of hydrocarbon production in transportation. The volume quantities of hydrocarbons are measured at engine exhaust mufflers idling for two minutes. The graph in Figure 10 shows a peak in the volume of hydrocarbons for cars aged thirteen years. Smaller values for hydrocarbon emissions beyond 13 years can usually be explained by a recovery of the engines of vehicles.

Figure 10: Hydrocarbon emission according to the age of the vehicle.
This graph shows the strong contribution of older vehicles in urban air pollution, indeed the car park in Senegal is outdated and at an average age of just over ten years. These vehicles particularly engine type contribute to the deterioration of air quality in Dakar.
Speed and direction of the average wind
For the year 2015, the strong winds are observed during the months of January and February.
The wind rose of Figure 11 shows:

Figure 11: 2015 wind rose.
1. Strong north-easterly winds during the dry season (from December to April) with a wind speed above 7 m/s corresponding to a fairly strong wind. This speed will decrease until its minimum between August and September corresponding to the rainy season.
2. During the rainy season this year 2015, the prevailing wind is South-West as shown in Figure 11 with a strong month wind.
The peninsula of Dakar is swept by two prevailing winds: an NW wind in the dry season and a SW wind during the rainy season. These mean winds show a privileged NE-SW movement of low-lying air masses that appears to produce permanent drainage of pollutants emitted by anthropogenic sources in general.
For the year 2014, there are two dominant mean winds as indicated by the wind rose in Figure 12:

Figure 12: 2014 wind rose.
1. one from the North East blowing over the region of Dakar during the dry season with an average speed of about 6 m/s and
2. Southwesterly wind during rainy season with a slightly lower speed of the order of 5 m/s. These two types of wind thus establish a sweep of the lower atmosphere of Dakar along the South West-North East direction in both directions following the two seasons of the year.
For the year 2013, the wind rose in Figure 12 shows a near-absence of northeasterly winds with south-south-east to south-southwest winds blowing all year round; these southerly winds blowing at a relatively slow average speed of 4.0 m/s could be the basis of this year’s high rainfall compared to 2014 and 2015.
The data from the analyzers of the Dakar stations do not make it possible to evaluate their impact on the transport of atmospheric pollutants.
Influence of wind on pollutants
Data and methods: The concentrations of NOx and CO collected for the years 2012, 2013 and 2015 at the seven stations in Dakar, provided by the Environment Directorate, have made it possible to establish a statistical table on the monthly and annual averages. The Wyoming site radiosondes associated with the averaged concentrations allowed us to evaluate changes in monthly fluxes as a function of wind speed, relative humidity and then their time-dependence (depending on the month).
This study concerns an aerological zone of altitude corresponding to atmospheric pressures higher than 1000 hPa, field of study used to evaluate NOx and CO fluxes under the influence of surface winds. Pollution levels are evaluated against the reference values of NS-05-062 in force in Senegal; the averages for the year 2015 are 1,42 mg/m3 for CO and 0,021 mg/m3, values below the limits established by Senegal and WHO.
Flow of a pollutant: In the general circulation of the atmosphere, characterized by a velocity field that determines fluid flows, the associated shifts are due to molecular shifts and vortices phenomena. In the vicinity of the Earth’s surface, where the flow is laminar and where the exchanges are due to molecular diffusion phenomena, the displacement of molecules between natural emission sources and the atmosphere is greatly accelerated by the movements of the air. In the lower atmosphere corresponding to an atmospheric pressure higher than 1000 hPa, the vertical transfers are negligible in front of the horizontal transport due to surface winds.
In this part, we will evaluate the flow of a pollutant due to surface winds represented at each altitude by a horizontal speed determined by a radiosonde.
Expression of horizontal flow: The flow of a pollutant (PM10) emitted into the atmosphere is defined as the mass quantity of pollutant considered per unit area and per unit of time. Flow is a simpler term for flow density.
Consider at a very low altitude a portion of the volume space Vi, of length d1 and of section ds. Since the transport of pollutants is due to air, we equate the speed of the pollutant with that of the average surface wind of value v.
The flow of the pollutant (PM10) is written in the elementary volume considered:
φ = −
Where is φ the mass of pollutant displaced over a distance by the wind (Figure 13a)

Figure 13: Expressions of horizontal flow.
Multiply the flow expression by (Figure 13b) 
We obtain: (Figure 13c) 
By rearranging, it comes
−
Where=represents the horizontal wind speed, and=the elementary volume considered we obtain then:
φ = −
Now, − symbol represents the mass concentration of the constituent which will be represented by •
Finally, the horizontal flow of a pollutant is given by the product of its mass concentration by the speed of the wind and is written:
φ = ×
From pollutant data collected by Dakar Air Quality Management Center stations and radiosondages for 2013, 2014 and 2015, we are going to study the effect of pollutants on the quality of air pollution. Air in the lower atmosphere of the city of Dakar, determine the flow of gaseous pollutants such as carbon monoxide CO and nitrogen oxides NOx generally emitted by automotive sources of transport, and analyze their variations according to meteorological parameters. Differences in monthly flows from the annual average will then be studied for CO and NOx.
Evolution of the monthly flow according to the wind speed
Year 2015: The monthly fluxes evaluated for NOx and CO during the year 2015 according to the average monthly wind speed presents the profiles represented by Figures 14 and 15.

Figure 14: NOx flux as a function of wind speed (2015).

Figure 15: CO flux versus wind speed (2015).
The evolution of the monthly fluxes (F) of the compounds is not regular according to the speed (v) of the wind, even if on average they increase with the speed of the wind as the red regression curves show on both graphs. The slope of the regression curve is more important for CO than for NOx (approximately 45 times), this could be explained by the dispersion of CO in the air, which facilitates its transport by surface winds. These results probably show the contribution of other meteorological parameters.
Year 2014: The study of the horizontal fluxes of atmospheric pollutants NOx and CO for the year 2014 gave the results represented by the two curves of Figures 16 and 17. In both pollutant cases, the flows are trending upwards according to the wind speed. The variation in flux with respect to velocity is stronger for CO than for NOx, despite the missing data for carbon monoxide, which was considered by the method of representation to be nil.

Figure 16: NOx flux versus wind speed (2014).

Figure 17: CO flux versus wind speed (2014).
According to this evolution of the flux and the strong correlation between the flow and the speed of the surface wind, we deduce on the one hand that the wind plays an important role in the transport of the pollutants thus avoiding an accumulation in the low atmosphere and on the other hand the steepness of the CO flow (more than 70 times that relative to NOx) explains the easier dispersion of carbon monoxide.
Evolution of differences in monthly flows as a function of time
Year 2015: The discrepancies in the monthly fluxes of the pollutants considered compared to the annual average represented as a function of time (depending on the months) gave for the year 2015 the profiles represented in Figures 18 and 19. The monthly deviations from the annual average of the two compounds have similar profiles with the exception of the months of March and April, which seem to be inconsistent with the data collected. In both cases, the period of school holidays that includes the rainy season is affected by these negative values, which represent low monthly flows compared to the average. The more regular variations in NOx, which mainly originate in transport, can also be explained by the decrease in car traffic at the end of the school year.

Figure 18: Monthly NOx flow difference as a function of time (2015).

Figure 19: Monthly flow of CO as a function of time (2015).
Year 2014: During the year 2014, we note the same way in 2015, the differences in monthly flows compared to the annual average (Figures 20 and 21) are generally positive during the dry season and negative from June to October period covering the rainy season.

Figure 20: Monthly NOx flow differences as a function of time (2014).

Figure 21: Monthly CO2 flow differences as a function of time (2014).
For carbon monoxide CO, the period from August to October was not taken into account in this study because of the absence of data related to non-operation of the analyzers of the measuring stations. These results show a certain influence of precipitation on the flow of pollutants, an influence that will be studied later.
Evolution of flux monthly as a function of relative humidity
Year 2015: In Dakar, the radiosondages show that the annual amplitude of the variations of the relative humidity is not strong and on the other hand the highest values of the humidity correspond to the months of the rainy season. The maximum values can be explained by the presence of the monsoon with low speed winds, high summer temperatures and in October a moist air intake with an incursion of the maritime trade wind.
Relative to relative humidity, flows are on average trending downwards with a greater decrease for carbon monoxide (around 51%); the monthly flow minima are obtained for relative humidities between 78.4% and 82.8% values corresponding to the months of the rainy season, from July to October. Precipitation has a certain influence on the concentrations of these chemical compounds thanks to the leaching phenomenon which in part causes their dissolution (Figures 22 and 23).

Figure 22: NOx flux versus relative humidity (2015).

Figure 23: CO flux versus relative humidity (2015).
Year 2014: The pollutant fluxes considered do not have a regular variation with humidity but a downward trend is observed, a more important decrease for carbon monoxide. Moreover, the relatively narrow range of relative humidity can also explain the reliable flow variations. We find that in this variation, the minimum flux values coincide with the rainy season (Figures 24 and 25).

Figure 24: NOx flux versus relative humidity (2014).

Figure 25: NOx flux versus relative humidity (2014).
The low correlation coefficients between the NOx and CO fluxes of 0.40 and 0.12, respectively, explain the low influence of relative humidity on the concentration of atmospheric pollutants; however, this moisture appears to have more effect on nitrogen oxides than on carbon monoxide.
The horizontal wind has more effect in attenuating pollutant concentrations than relative air humidity, moreover in the case of Dakar, the relative humidity of the air is high during the rainy season; where the average wind speed is usually low.
Evolution of flows according to precipitation
Year 2015: Precipitation plays a major role in reducing atmospheric concentrations of pollutants in ambient air; Indeed, the flow of pollutants decreases significantly when rainfall is high, the two curves of variations shown in Figures 26 and 27 show minima for the flows corresponding to the months of July, August and September when the highest cumulative rainfall is recorded.

Figure 26: NOx fluxes by precipitation (2015).

Figure 27: CO fluxes by precipitation (2015).
The decrease in atmospheric concentrations of carbon monoxide is even more marked than that of nitrogen oxides, certainly because of its low density but also its possible dissolution in rainwater. This study shows the role of atmospheric leaching played by rain; the rainy season corresponds to the time of year when pollutant concentrations mainly due to transport are lower in the ambient air.
Study without missing data
For this year, the carbon monoxide concentrations for the months of January, August, September, October and November were not recorded zero flows shown in Figure 28 due to technical problems at the stations and breakdowns electricity. By not taking into account the missing data for CO concentrations, the precipitation-related CO flux for the months for which measurements were made, has the profile shown in Figure 28. This flow is maximum in February when there is an almost total absence of precipitation; but despite the absence of months of heavy rainfall on the graph, there is a form of exponential decay of the flow as rainfall increases (Figure 29).

Figure 28: CO fluxes by precipitation (2014).

Figure 29: CO fluxes by precipitation (2014).
When the study is carried out taking into account the missing data and the reliability of those existing, there is also an appreciable decrease of the flows when the precipitation increases as shown by the trend curve of the figure. The minimum values are obtained in July, August and September. We also find a more obvious effect of rain on carbon monoxide concentration than on nitrogen oxides (Figure 29). Indeed, a decay of flux is noted for NOx but of a lower level than CO, this can also be explained by a greater affinity of CO with respect to water from the point of view of physicochemical affinities.
For the chemical pollutants considered, the study shows a strong reduction of the atmospheric fluxes when the precipitation increases, the role of leaching of the outside air by the rain is a natural solution of fight against the chemical pollution. The dissolution of nitrogen oxides in water produces nitric acid HNO3, one of the main contributors of acid rain. At the same time, rainfall generates 15% nitric oxide when soils are humidified during the rainy season; the rain would activate the microbes that release the soil nitrogen accumulated during the dry season [21,22].
Ultimately, precipitation significantly reduces the flow of concentrations of pollutants. Rainwater can cause pollutants to dissolve leading to an increase in the acidity of the rains but also drainage towards the ground that can lead to a contribution of substances in particular nitrogen compounds (Figure 30).

Figure 30: NOx fluxes by precipitation (2014).
Air pollution is a major topic of public health and environmental policy. For this purpose, air quality is constantly monitored to guide political decision-making policies on public health and environmental management issues that may be affected by air pollution. The monitoring of the air quality in a given environment passes through the definition of a normative reference based among other things on the quantitative data of pollutants identified in the air.
Historical context
Formal air quality monitoring began in the United States of America, where in 1970 air quality standards were first laid down for the promulgation of the law on air quality (Clean Air Act). This law sets the standards for the following pollutants: Ozone O3, carbon monoxide CO, SO2 sulfur dioxide, HC hydrocarbons and suspended particulates.
During the 1990s, the World Health Organization developed, from epidemiological, toxicological and clinical experimentation studies, guide values that relate the concentrations of pollutants in the ambient air to identified pathologies mainly of the type However, these recommendations are difficult to apply in developing countries because of environmental and socio-economic conditions that are very different from those of the industrialized countries at the origin of these studies. Thus, for good public health and environmental management, each country has reference standards according to their own legislation.
Air quality standard
This standard represents the definition of a level of air quality set by state authorities as to be respected. For a given pollutant, the standard is defined according to two parameters:
1. Quantitative data generally represented by its concentration
2. A temporal support corresponding to duration of integration of the quantitative data. Other quantitative considerations have been defined for air quality, these are
2.1. Target value or objective of quality: Value to be achieved, in the long term, to avoid harmful effects on health.
2.2. Guide values: For WHO, these are minimum values from which health effects are observed.
2.3. Limit values: Notion used by European directives; it is a level established on the basis of scientific knowledge, with the aim of avoiding, preventing or reducing the effects on health or the environment, a level to be achieved within a given period.
2.4. Recommendation and information threshold: Level from which short-term exposure may pose a risk to sensitive individuals.
2.5. Recommendation and information threshold: Level from which short-term exposure may pose a risk to sensitive individuals.
2.6. Percentile: Percentage of measurement below a reference value. For example, a standard expressed as percentile 98 means that 2% of measurements can be accepted above this value.
WHO and senegal standards
The WHO air quality standards, also known as guideline values, represent a benchmark of atmospheric pollutant threshold concentrations developed from scientific studies of the impact of pollution on public health and public health environment. Standards vary in countries, which are generally different from those of WHO due to socio-economic conditions, industrial potential, space occupation, nature of transport and accessibility of health facilities to populations . But in all cases, air quality standards incorporate three parameters [23-25] (Table 2).
| Polluants | Moyenne temporelle | Directives OMS | NS-05-062 (SEN) |
|---|---|---|---|
| Dioxyde de soufre | -1hr | -500 | - |
| SO2 (µg/m3) | -24h | -125 | -125 |
| -1an | -50 | -50 | |
| Dioxyde d’azote | -1h | -200 | -200 |
| NO2 (µg/m3) | -an | -40 à 50 | -40 |
| Ozone | -1h | -150 à 200 | - |
| O3 (µg/m3) | -8h | -120 | -120 |
| Monoxyde de carbone | -1h | -30000 | -30000 |
| CO (µg/m3) | -8h | -10000 | - |
| Particules ≤ 10 µm | -24h | -50 | -260 |
| PM10 (µg/m3) | -1an | -20 | -80 |
| Particules ≤ 2.5 µm | -24h | -25 | - |
| PM2.5 (µg/m3) | -1an | -10 | - |
| Plomb | -1an | -0.5 à 10 | - |
| Pb (µg/m3) | - | - | - |
Table 2: WHO and Senegal limit values for air quality.
The monitoring of air pollution in Dakar is done by the Quality Management Center (CGQA) which is under the supervision of the Department of Environment and Classified Establishments (DEEC). The concentrations of the various pollutants measured in my different stations make it possible to quantitatively characterize the quality of the air by a real index.
IQA air quality index: This dimensionless index, which represents a quantitative form of measurement of air quality, is established on a scale of 0 to 500. More the value of the index is high, the level of air pollution is higher; on the other hand, when its value is low, the better the quality of the air.
For a given pollutant X, the air quality index is defined by the ratio of its concentration to its limit value expressed as a percentage.
= –×100
In a given area with a measuring station, the AQI represents the largest value of the measured air quality indices. The individual indices have the advantage of both identifying the risks to people’s health, particularly children and older adults working outside, and also action of the public authorities in terms of intervention and information.
A color code system is adopted by the CGQA to inform on the quality of the outside air in Dakar:
1. Green: Good air quality
2. Yellow (Medium): Air quality is acceptable; however, there are slight health risks for some people especially those with sensitivity to ozone.
3. Brown N (Bad): It is when the AQI is between 150 and 200, in this case there is real problem of threat on the health of the children and the asthmatic people.
4. Red (very bad): This corresponds to AQI greater than 200, the air of very poor quality requires rigorous health precautions such as the wearing of a mask for breathing or even alternating traffic to reduce pollution by transport.
Assessment of air quality in Dakar: The CGQA establishes regular newsletters to establish and inform on the level of air quality. For our study, we will consider air quality in Dakar for the years 2014 and 2015. Their study deals with a measurement of pollutants of solid nature (PM2.5 and PM10) and those of chemical nature (CO, CO2, NOx, SO2) so as to establish the level of air pollution with reference to Senegalese standards NS 05-062.
Year 2014: Following the evolution of the year-round air quality index shown in Figure 31, there was an overall 70-day exceedance of the former WHO standard of 150 150 μg/m3. Periods of heavy pollution are noted during the dry season especially during the days of December, January and March leading to an air quality level bad or very bad. The data collected has a fairly satisfactory level of air quality because the data has a validity percentage between 70 and 75% according to the 2014 CGQA report.

Figure 31: Daily evolution air quality index (2014).
Overall air quality is good at 65% in Dakar (Figure 32), which largely corresponds to the period of the rainy season when there are the combined effects of rainfall, relative humidity and high rainfall and reduction of car traffic due to school holidays.

Figure 32: State of air quality in Dakar at (CGQA;2014).
Exceedances of the limit values observed are of a particulate nature and concern mainly PM10. None of the chemical pollutants has reached the national or WHO limit values for the year. The daily variations of NO2 concentrations have never reached the standard of 200 μg/m3; however it is found that the maximum values of their concentrations in outdoor air are obtained during the day especially during high traffic hours. In the morning from 8 h to 9 h and in the evening from 19 h to 20 h. These peaks of concentration are an illustration of the contribution of transport in urban chemical pollution.
Year 2015: As in previous years, air pollution at 2015 is mainly due to dust particles in the air. Chemical pollution is non-existent throughout the year. Figure 33 below shows the seasonality of air quality in Dakar, indeed the level of pollution is very low during the rainy season.

Figure 33: Daily evolution air quality index (CGQA; 2015).
Episodes of heavy pollution were observed during the months of January, and March of April and December corresponding to the dry season and where there is alternation of the maritime trade winds and the harmattan which is responsible for the bulk of the solid particles in the air. It is in this period that the days of very bad air quality are noted. On average for the year 2015 the air quality was not as good as at 2014, in fact it was good for 45% of the time compared to 65% at 2014 while the bad weather is 10% (Figure 34).

Figure 34: Air quality status in Dakar in (CGQA; 2015).
The macrocephaly of the city of Dakar represents a major challenge for the study of pollution levels for monitoring air quality. The concentrations of NOx and CO and other pollutants, measured by the different stations that do not always work properly, come largely from automobile traffic, especially older vehicles of the diesel type. This study has shown the influence of meteorological factors such as wind speed, relative humidity, these parameters tend to reduce the flow of pollutants into the ambient air outside with more or less marked effects. Developments noted during the season from July to October, which is consistent with the rainy season, show a clear contribution of precipitation to the reduction of atmospheric concentrations of pollutants. Indeed, rainwater can dissolve chemical pollutants and cause an increase in their acidity but also can produce their drainage to the ground and change the chemical composition of the soil including nitrogen compounds. The observed minimum diurnal concentrations for CO and for the NOx during this period also of school holidays thus of fall of the traffic explain the role of the transport in the pollution of the city of Dakar.
Despite the dilapidated fleet and the importance of motorized movements that are at the base of significant emissions of air pollutants such as carbon monoxide, sulfur oxides, the study air quality in Dakar for years 2014 and 2015 showed maximum concentrations of chemical pollutants below both Senegalese and WHO standards. The pollution peaks noted for these years are all particulate and come from human activities related to the construction of infrastructures but especially from the dust of the Sahara which is transported by the north winds is blowing on Dakar during the dry season. In addition, the privileged direction North-East South-West of the average wind in Dakar can justify a lack of known chemical pollution by the drainage of the pollutants especially towards the ocean because of the geography of the Senegalese capital.