Journal of Pollution Effects & Control
Open Access
ISSN: 2375-4397
ISSN: 2375-4397
Research Article - (2023)Volume 11, Issue 3
The present study was conducted at the department of agrometeorology, IGKV Raipur (C.G.) from 2019 to 2021, to assess the zone level vulnerability in three agro-climatic zones of Chhattisgarh with respect to climate change. The data on various components were collected from the Census directorate of Chhattisgarh, department of agrometeorology, Raipur and the report of directorate of economics and statistics Raipur, Chhattisgarh for the period of 2000 to 2018 and divided into three different study periods i.e. 2000-2005, 2006-2010 and 2011-2018. We used Hiremath and Shiyani and Iyenger and Sudershan's methodology to contract the vulnerability and composite vulnerability index. The outcome of this study indicated that the agricultural sector played a major role and contributed significantly to quantifying the vulnerability followed by climatic and demographic indicators during all three study periods. Results of the composite vulnerability index indicated that Bastar Plateau Agro-Climatic Zone (BP ACZ) was categorized as a more vulnerable zone followed by the Northern Hills agro-climatic zone (NH ACZ) and Chhattisgarh Plain Agro-Climatic Zone (CGP ACZ) in decreasing order of vulnerability in all the three study periods. Zone wise classification of degree of vulnerability, Chhattisgarh Plain Agro-Climatic Zone (CGP ACZ) and the Northern Hills Agro-Climatic Zone (NH ACZ) was categorized as highly vulnerable category, while Bastar Plateau Agro-Climatic Zone (BP ACZ) falls under the Very highly vulnerable category, during all the three-study period. We have not found the less vulnerable, moderately vulnerable and vulnerable zone during all the three study periods.
Vulnerability; Agricultural; Climatic; Demographic; Agro-climatic zone and vulnerable
Climate is one of the most important determinants of agricultural production. Throughout the world, there is significant concern about the impacts of climate change and its variability on agricultural production [1,2]. Climate change may affect agriculture and consequently the livelihoods of people due to changes in temperature, rainfall, soil moisture, soil fertility, the length of the growing season, an increase in the probability of extreme events such as droughts, extreme heatwaves, heavy rainfall, cyclones, flooding of the coastal areas, erosion etc.
According to the intergovernmental panel on climate change definition, vulnerability in the context of climate change is “the degree to which a system is susceptible to and unable to cope with the adverse effects of climate change, including climate variability and extremes. Vulnerability is a function of the character, magnitude, and rate of climate change and variation to which a system is exposed, its sensitivity, and its adaptive capacity”. According to the sixth assessment report of the Intergovernmental Panel on Climate Change (IPCC), “Heat waves and humid heat stress will be more intense and frequent during the 21st century. In terms of monsoon, both annual and summer monsoon precipitation will increase during the 21st century, with enhanced interannual variability”.
Chhattisgarh is divided into three distinct Agro-climatic zones viz., Chhattisgarh plains, Bastar plateau and Northern hills and it covers 50.52%, 28.62% and 20.86% geographic area, respectively. Similarly, topographically also the state varies a lot from high elevated areas of the state making it differ in their climatic elements also. There is a wide variability of annual rainfall also on average a total of 1200 mm-1600 mm. Annual rainfall is recorded in different parts of Chhattisgarh on about 64 rainy days-91 rainy days (About 85% of rainfall in C.G. is concentrated in four monsoon months i.e. June-September). It has been recorded that 1000 mm-1200 mm, 1200 mm-1400 mm and 1400 mm-1600 mm annual rainfall are received in Chhattisgarh plains, Bastar plateau and northern hills, respectively [3,4].
Chhattisgarh, too, realizes the effect of climate change. Available evidence suggests that there is a high probability of an increase in the frequency and intensity of climate related natural hazards due to climate change and hence an increase in potential threats due to climate change related natural disasters. In the absence of state level climate models and vulnerability studies, it will be difficult to manage it as low community awareness and information, Chhattisgarh is potentially extremely sensitive and vulnerable to climate change and its impacts. Earlier climate change study was carried out to assess the regional climate changes in Chhattisgarh state in central India and their impacts on agriculture [5].
The data on various components were collected from the directorate of census Chhattisgarh, department of agrometeorology, Raipur and the report of directorate of economics and statistics Raipur, (C.G.) for the period of 2000 to 2018 and divided into three study periods viz., 2000 to 2005, 2006 to 2010 and 2011 to 2018. The decadal demographic data i.e., population density and literacy rate for the period 2001 and 2011 were collected for Chhattisgarh state from the census directorate of Chhattisgarh. The long term gridded annual and seasonal rainfall data (mm), annual maximum and minimum temperature (℃) data for the period 2000-2018 were collected from the department of agrometeorology, I.G.K.V. Raipur, C.G. and agricultural data for the period from 2000 to 2018, crop data (rice, maize, pigeon pea, wheat and chickpea), cropping intensity, the area under cultivation and Irrigation intensity were collected from the report of directorate of economics and statistics, Raipur C.G.
All agricultural, climatic and demographic data were available district wise and for zone wise vulnerability analysis, we have converted these all data in agro-climatic zone wise. All these data were used to construct a vulnerability index (Table 1).
| S. NO. | Indicators | Sub-indicators | Functional relationship |
|---|---|---|---|
| 1 | Demographic indicators | i. Density of population (persons per square kilometer) | ↑ |
| ii. Literacy rate (percentage) | ↓ | ||
| 2 | Climatic indicators | i. Annual rainfall (mm) | ↑ |
| ii. Seasonal rainfall (mm) | ↑ | ||
| iii. Annual maximum temperature (℃) | ↑ | ||
| iv. Annual minimum temperature (℃) | ↑ | ||
| 3 | Agricultural indicators | i. Production of rice crop (q/hectare) | ↓ |
| ii. Productivity of rice crop (q/hectare) | ↓ | ||
| iii. Production of maize crop (q/hectare) | ↓ | ||
| iv. Productivity of maize crop (q/hectare) | ↓ | ||
| v. Production of pigeon pea crop (q/hectare) | ↓ | ||
| vi. Productivity of pigeon pea crop (q/hectare) | ↓ | ||
| vii. Production of wheat crop (q/hectare) | ↓ | ||
| viii. Productivity of wheat crop (q/hectare) | ↓ | ||
| ix. Production of chick pea crop (q/hectare) | ↓ | ||
| x. Productivity of chick pea crop (q/hectare) | ↓ | ||
| xi. Cropping intensity (percentage) | ↓ | ||
| xii. Irrigation intensity (percentage) | ↓ | ||
| xiii. Area under cultivation (hectare) | ↓ |
Table 1: Functional relationship of indicators and sub-indicators with vulnerability to climate change.
Methodology for calculation of the vulnerability index
Normalization of indicators using functional relationship: We calculated the geometric mean of demographic, climatic and agricultural indicators through the dimension index was calculated with the help of the formula given by Hiremath and Shiyani. The dimension index was categorized into two types of functional relationships was possible i.e. ↑ (positive) functional relationship and ↓ (negative) functional relationship in Table 1. Dimension index scores will lie between 0 and 1. The value 1 will correspond to that zone with maximum value and 0 will correspond to the zone with minimum value [6-8].
In this case we say that the variables have ↑ (positive) functional relationship with vulnerability and the normalization is done using the formula:
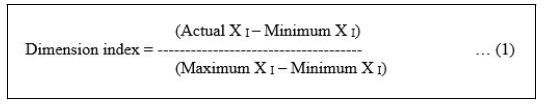
Where,
Actual XI=Actual value of respective indicator
Minimum XI=Minimum value of respective indicator
Maximum XI=Maximum value of respective indicator
In this case we say that the variables have ↓ (negative) functional relationship with vulnerability and the normalization is done using the formula:
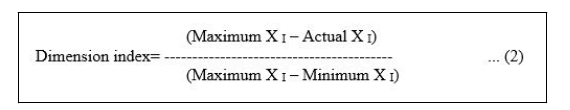
This method of normalization that takes into account the functional relationship between the variable and vulnerability was important in the construction of the indices. If the functional relation is ignored and the variables are normalized simply by applying formula (1), the resulting index will be misleading.
Iyenger and Sudershan's method for construction of vulnerability index
The method of simple averages gives equal importance to all the indicators which are not necessarily correct. Hence many authors prefer to give weights to the indicators. Iyengar and sudarshan developed a method to work out a composite index from multivariate data and it was used to rank the zones in terms of their economic performance. This methodology is statistically sound and well suited for the development of the composite index of vulnerability to climate change also.
A brief discussion about the methodology is given below.
It is assumed that there are M zones, K sub-indicator of indicators vulnerability and xij, i=1, 2,.…M; j=1, 2,.…k are the normalized scores. The level or stage of development of it zone, t is assumed to be a linear sum xij as
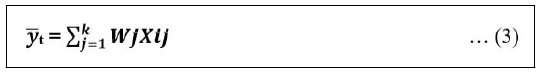
Where, w’s (0<w<1 and Σkj=1 Wj=1) are the weights. In Iyenger and Sudarshan’s method, the weights are assumed to vary inversely as the variance over the zone in the respective subindicators of indicators vulnerability. That is, the weight wj is determined by:
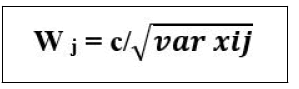
Where, c is a normalizing constant such that
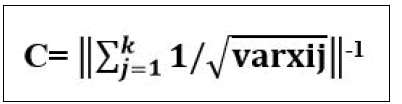
The determination of the weights in this manner would ensure that large variation in any one of the indicators would not unduly dominate the contribution of the rest of the indicators and distort inter zone comparisons. The vulnerability index so computed lies between 0 and 1, with 1 indicating maximum vulnerability and 0 indicating no vulnerability at all.
For classificatory purposes, a simple ranking of the zones based on the indices viz., y̅t would be enough. However, meaningful characterizations of the different stages of vulnerability, and suitable fractile classification from an assumed probability distribution are needed.
A probability distribution that was suitable for this purpose was the Beta distribution, which is generally skewed and takes values in the interval (0,1). This distribution has the probability density given by:
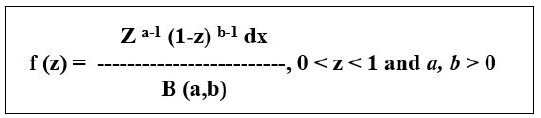
Where, B (a, b) is the beta function defined by:
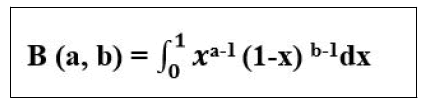
The two parameters a and b of the distribution can be estimated by using the method by Iyenger and sudarshan. The beta distribution is skewed. Let (0, z1), (z1, z2), (z2, z2), (z3, z4) and (z4,1) be the linear intervals such that each interval has the same probability weight of 20 percent.
These fractile intervals were used to characterize the various stages of vulnerability as shown below:
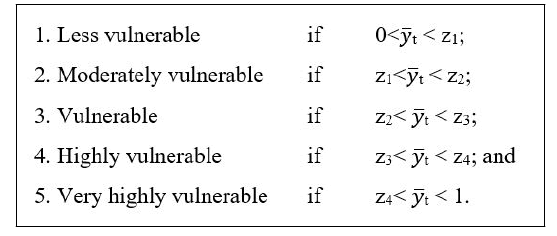
During 2000-2005, 2006-2010 and 2011-2018, zone-wise vulnerability indices of Chhattisgarh state has been worked out for demographic, climatic and agricultural indicators. The zones have been ranked on the basis of vulnerability indices.
Zone wise share to the vulnerability to climate change for the year 2000-2005
| S.No | Agro-climatic zone name | Demographic vulnerability index | Rank | Climatic vulnerability index | Rank | Agricultural vulnerability index | Rank | Composite vulnerability index | Rank |
|---|---|---|---|---|---|---|---|---|---|
| 1 | NHZ | 0.028 | 3 | 0.033 | 3 | 0.4 | 2 | 0.461 | 2 |
| 2 | CGPZ | 0.047 | 1 | 0.16 | 2 | 0.225 | 3 | 0.432 | 3 |
| 3 | BPZ | 0.046 | 2 | 0.206 | 1 | 0.433 | 1 | 0.685 | 1 |
Table 2: Vulnerability index of 3 agro-climatic zones for period of 2000-2005.
A perusal of Table 2, revealed that the Chhattisgarh plain agro climatic zone was ranked first (0.047) for vulnerability to climate change followed by Bastar plateau agro climatic zone (0.046), while Northern Hills Agro-climatic Zone was ranked last (0.028) in the terms of the demographic vulnerability index. On the basis of the climatic vulnerability index, Bastar Plateau agro-climatic zone was in first position (0.203) followed by the Chhattisgarh Plain agro-climatic zone (0.160), while the Northern hills agro-climatic zone was in the last position (0.033) for the climatic vulnerability index during the period of 2000-2005. In terms of the agricultural vulnerability index, the bastar plateau agro climatic zone was ranked first (0.433) followed by the Northern hills agroclimatic zone (0.400), while Chhattisgarh Plain agro climatic zone ranked the last (0.225) during the period of 2000-2005 (Figure 1).

Figure 1: Indicator wise contributions to the vulnerability to climate change for the period of 2000-2005.
It can be seen from the Table 2 and Figure 1 that on the basis of the composite vulnerability index Bastar plateau agro climatic zone was ranked first (0.685) followed by the Northern hills agro climatic zone (0.461), where agricultural sector contributes maximum 63.20 percent followed by climatic sector (30.04) percent and demographic sector (6.76 percent), while the Chhattisgarh plain agro climatic zone was ranked the last (0.432), where in the contribution of the climatic sector was maximum 51.95 percent followed by agricultural sector (37.07 percent) and demographic sector (10.98 percent) during the period of 2000-2005.
Zone wise share to the vulnerability to climate change for the year 2006-2010
| S.No | Agro-climatic zone name | Demographic vulnerability index | Rank | Climatic vulnerability index | Rank | Agricultural vulnerability index | Rank | Composite vulnerability index | Rank |
|---|---|---|---|---|---|---|---|---|---|
| 1 | NHZ | 0.051 | 3 | 0.044 | 3 | 0.418 | 1 | 0.513 | 2 |
| 2 | CGPZ | 0.047 | 1 | 0.159 | 2 | 0.205 | 3 | 0.411 | 3 |
| 3 | BPZ | 0.046 | 2 | 0.193 | 1 | 0.402 | 2 | 0.641 | 1 |
Table 3: Vulnerability index of 3 agro-climatic zones for period of 2006-2010.
A perusal of Table 3 indicated that the Northern hills agro climatic zone was ranked first (0.051) for vulnerability to climate change followed by the Chhattisgarh plateau agro climatic zone (0.047) in terms of the demographic vulnerability index. The Bastar plateau agro climatic zone was ranked last (0.046) in the terms of the demographic vulnerability index. On the basis of the climatic vulnerability index, the Bastar plateau agro climatic zone was ranked first (0.193) followed by the Chhattisgarh plain agro-climatic zone (0.159), while the Northern Hills agro climatic zone was ranked last (0.044) during the period of 2006-2010. The Northern hills agro climatic zone was in first position (0.418) followed by the Bastar plateau agro-climatic zone (0.402), while the Chhattisgarh Plain agroclimatic zone was in last position (0.205) according to agricultural vulnerability index (Figure 2).

Figure 2: Indicator wise contributions to the vulnerability with respect to climate change for the period of 2006-2010.
It can be observed from Table 3 and Figure 2 that the Bastar plateau agro-climatic zone was in first position (0.641), where the agricultural sector contributes a maximum of 62.74 percent followed by the climatic sector (30.07 percent) and demographic sector (7.19 percent). The Chhattisgarh plain agro-climatic zone was in the last position (0.411), where the maximum contribution of the agricultural sector was found (49.78 percent) followed by the climatic sector (38.77 percent) and demographic sector (11.45 percent), respectively.
Zone wise share to the vulnerability to climate change for the year 2011-2018
| S.No | Agro-climatic zone name | Demographic vulnerability index | Rank | Climatic vulnerability index | Rank | Agricultural vulnerability index | Rank | Composite vulnerability index | Rank |
|---|---|---|---|---|---|---|---|---|---|
| 1 | NHZ | 0.0318 | 3 | 0.0259 | 3 | 0.4524 | 1 | 0.5101 | 2 |
| 2 | CGPZ | 0.0497 | 2 | 0.129 | 2 | 0.2075 | 3 | 0.3863 | 3 |
| 3 | BPZ | 0.0504 | 1 | 0.1647 | 1 | 0.4361 | 2 | 0.6512 | 1 |
Table 4: Vulnerability index of 3 agro-climatic zones for period of 2011-2018.
A perusal of Table 4 indicated that Bastar plateau agro-climatic zone was ranked first (0.0504) for vulnerability to climate change followed by the Chhattisgarh plain agro-climatic zone (0.0497), while the Northern hills agro-climatic zone was ranked last (0.0318) in terms of the demographic vulnerability index. On the basis of the climatic vulnerability index, the Bastar plateau agro-climatic zone was ranked first (0.1647) followed by Chhattisgarh plain agro-climatic zone (0.1290), while the Northern hills agro-climatic zone was ranked last (0.0259) during the period of 2011-2018. The Northern hills agro-climatic zone was ranked first (0.4524) based on the agricultural vulnerability index followed by Bastar plateau agro-climatic zone (0.4361), while the Chhattisgarh plain agro-climatic zone ranked last (0.2075) (Figure 3).

Figure 3: Indicator-wise contributions to the vulnerability to climate change for the period of 2011-2018.
A close observation of Table 4 and Figure 3 revealed that the Bastar plateau agro-climatic zone was in the first position (0.6512) for vulnerability to climate change where the maximum contribution of the agricultural sector is 66.97 percent followed by climatic sector (25.29 percent) and demographic sector (7.74 percent), while the Chhattisgarh plain agro-climatic zone was in last position (0.3863) where agricultural sector contributes 55.73 percent followed by climatic sector (33.41 percent) and demographic sector (12.86 percent).
In a similar study on quantitative assessment of vulnerability Islam, et al. reported that the tidal surge zone is the most vulnerable zone within the country in terms of agricultural, occupational and geographic vulnerability, while demographically least vulnerable, whereas the mixed ecological zone is very highly vulnerable in terms of climatic vulnerability.
Classification of the three agro-climatic zones under different degrees of vulnerability for the period of 2000-2005, 2006-2010 and 2011-2018
Using vulnerability indices by following beta distribution the zones of the state were categorized into less vulnerable, moderately vulnerable, vulnerable, highly vulnerable and very highly vulnerable categories. During the period of 2000-2005, Zi values are as follows 0.137, 0.274, 0.411, 0.548 and 0.685. Similarly, Zi values for the study period of 2006-2010 are 0.128, 0.256, 0.385, 0.513 and 0.641. During the period of 2011-2018, Zi values are 0.130, 0.260, 0.391, 0.521 and 0.651 as shown in Table 5. The results pertaining to the classification of the three agro-climatic zones under different degrees of composite vulnerability for the periods of 2000-2005, 2006-2010 and 2011-2018 are given in Table 5.
| S.No | Year category | Less vulnerable category (1) | Moderate vulnerable category (2) | Vulnerable category (3) | High vulnerable category (4) | Very higly vulnerable category (4) |
|---|---|---|---|---|---|---|
| 1 | 2000-05 | 0-0.137 | 0.137-0.274 | 0.274-0.411 | 0.411-0.548 | 0.548-0.685 |
| 2 | 2006-10 | 0-0.128 | 0.128-0.256 | 0.256-0.385 | 0.385-0.513 | 0.513-0.641 |
| 3 | 2011-18 | 0-0.130 | 0.130-0.260 | 0.260-0.391 | 0.391-0.521 | 0.521-0.651 |
Table 5: Zi values of beta distribution for three agro-climatic zones of Chhattisgarh during the study periods of 2000-2005, 2006-2010 and 2011-2018.
It is quite clear from the Figures 4-6, zone-wise classification of the degree of vulnerability results indicated that Chhattisgarh Plain Agro-Climatic Zone (CGP ACZ) and the Northern Hills Agro-Climatic Zone (NH ACZ) were categorized as highly vulnerable category, while Bastar Plateau Agro-Climatic Zone (BP ACZ) fell under the very highly vulnerable category, during all the three study periods. We have not found less vulnerable, moderately vulnerable and vulnerable categories of districts during all the three study periods.

Figure 4: Classification the degree of composite vulnerability in three agro-climatic zones of Chhattisgarh for period of 2000-2005.

Figure 5: Classification the degree of composite vulnerability in three agro-climatic zones of Chhattisgarh for period of 2006-2010.

Figure 6: Classification the degree of composite vulnerability in three agro-climatic zones of Chhattisgarh for period of 2011-2018.
The results of vulnerability analysis for the three zones of Chattisgarh state revealed that the variables pertaining to agricultural vulnerability were major contributors to the composite vulnerability to climate change during the periods of 2000-2005, 2006-2010 and 2011-2018. Since, the agricultural sector was found to have the greatest bearing there is a need to shift focus towards investments in adaptation research capacity: Particularly, in the development of climate resistant crops (drought, flood resistant and heat tolerant varieties) that can cope with a wide range of climatic conditions. An improvement in the agronomic practices of different crops such as timely planting, maintain plant densities and recommended cropping patterns/sequences can help to cope with the delayed rainfall, longer dry spells and earlier plant maturity. In order to enhance the resilience of the agriculture sector, new strategies must be built around 'green' agricultural technologies, such as adaptive plant breeding, forecasting of pests, ground water recharge, rainwater harvesting and fertilizer micro dosing.
Thus, the state of Chhattisgarh requires a development strategy that integrates climate change policies with sustainable development strategies to effectively combat climate change issues.
[Crossref] [Google Scholar] [PubMed]
Citation: Yadu A, Das GK, Lakhera ML, Raj J, Das K (2023) Assessment of Vulnerability in Three Agro-Climatic Zones of Chhattisgarh with Reference to Climate Change. J Pollut Eff Cont. 11:377.
Received: 03-Nov-2022, Manuscript No. JPE-22-19953; Editor assigned: 07-Nov-2022, Pre QC No. JPE-22-19953 (PQ); Reviewed: 21-Nov-2022, QC No. JPE-22-19953 ; Revised: 23-Jan-2023, Manuscript No. JPE-22-19953 (R); Published: 29-Sep-2023 , DOI: 10.35248/2375-4397.23.11.377
Copyright: © 2023 Yadu A, et al. This is an open-access article distributed under the terms of the Creative Commons Attribution License, which permits unrestricted use, distribution, and reproduction in any medium, provided the original author and source are credited.