Journal of Geography & Natural Disasters
Open Access
ISSN: 2167-0587
ISSN: 2167-0587
Research Article - (2018) Volume 8, Issue 2
Keywords: RUSLE model; Soil erosion; Gharesou basin; Land use; Land cover changes
Land use and land cover changes affect many natural processes such as soil erosion, sediment production, flood, and physical and chemical properties of the soil [1-4]. One of the main effects of land cover type on these processes in the basins is that it can affect the soil erosion of the basins. Soil erosion is a natural process that contributes to the evolution of the Earth’s surface and is governed by the underlying geology and soil characteristics, rainfall, topography, vegetation, land use and management practices. The ability to measure soil erosion and resultant land degradation is important because soil erosion has a range of environmental impacts, including loss of organic matter and nutrients, and reduction of landscape productivity and downstream water quality [5,6]. Soil loss by runoff is a severe ecological problem occupying 56% of the world wide area. Soil loss is accelerated by human-induced soil degradation [7,8]. The effects of soil erosion and deposit are both in and out of the region. In agricultural lands it causes soil degradation, decomposition of soil structure, reduction of organic and nutrient matter that reduces the depth of farmable soil and soil fertility and it may lead to the land abandonment [9]. The out of region effects are made by sediments which reduce the capacity of river and storage capacity and it increases the risk of flood and mud flow and reduces useful life of the storages [10,11]. This fact is disregarded that soil erosion is as a result of poverty and misuse of land and this problem will be solved by land use modification and management [12].
The soil erosion is strongly related to the land cover and land use [13-16] and land use changes or the percent of vegetation has many effects on soil loss [3,17-19]. Therefore, identification of trends of soil erosion changes, together with studying the effect of land cover changes in the basins play an important role in management of the basins and erosion control and water and soil resources. For this purpose, mathematic models of soil erosion (including quantitative and qualitative types) are used for studying the erosion and sediment of the basins in different parts of Iran and world. Models such as (USLE) [20], the modified universal soil loss (MUSLE) [21], or the revised universal soil loss (RUSLE) [22], have been used frequently to estimate soil erosion of the basin in the world. USLE model has estimated soil erosion as a mix of 6 factors indicating rain erosivity, soil erodibility, length and gradient, cultivation system and management they are used to predict soil loss in farming lands [20]. RUSLE model has 6 factors similar to USLE, but it has more accurate estimates from rain erosivity, soil erodibility, vegetation and conservation [23]. It also has been developed to predict soil loss in wider areas and different cover conditions such as farming lands, forest, pasture, and damaged forests [24].
Gharesou basin is one of the sub-basins of Gorganrood, it suffered from severe erosion in some areas over the past years. This erosion has occurred for different reasons and one of them is land use change and weak management of water and soil resources. The purpose of this study is to estimate changes in erosion potential of Gharesou basin in a 30-year interval and to study the role of land use and land cover change in amount of sediment using RUSLE model. To measure land use and land cover changes, the changes of landsat images were compared and used for the years 1985 and 2015. In this research, heterogeneous features of the basin was defined and analyzed as a discrete network of information using geographic information system and remote sensing.
Gharesou basin with an area of 1556 km2 is located in the longitude of (55˚: 23') to (55˚: 38'), and the latitude of (36˚: 15') to (37˚: 13'). Gharesou basin is a part of Gorganrood basin located in Golestan and Semnan province in the Caspian Sea basin, between Caspian Sea and northern slopes of the eastern Alborz highlands in the north Iran. In terms of ruggedness, Gharesou basin is divided into two parts of coastal plain in the north and mountains in the south. The Chehel Chai and Narmab rivers located in the southwest and southeast parts of Minoodasht city are connected to each other in a distance of 200 meters to the bridge at Minoodasht road and after the annexation of Khormalou River in Sambe Makhtoom. Gharesou River passes through the west of Arazkooseh village and enters into Gorganrood. This basin with an area of 1552 km2 has an average altitude of 1140 m, maximum height of 2892 m, minimum height of 0, and average slope of 16 degree. This area has moderate Mediterranean climate, so rainfall is higher than average in the country and in some parts of the basin, the average rainfall is more than 800 mm in a year. The purpose of this applied research is to analyze the potential of soil erosion as a result of land use and land cover changes in Gharesou basin, a sub-basin of Gorganrood, in Golestan province (Figure 1).

Figure 1: The location of study area in Iran and digital elevation model (DEM) and sub-basin map.
This research is based on remote sensing techniques to achieve land use changes in a 30-year interval. RUSEL model in GIS environment has been used to model the effect of these changes on hydro geomorphologic features of Gharesou basin. For this purpose, we have used rainfall data from 10 meteorological stations in the region, digital elevation model with 30 meters resolution, and test of 30 soil samples in laboratory. Also, for the assessment of land use changes, the images of TM and OLI sensors of landsat satellite of the study area for the years 1985 and 2015, have been used after geometric corrections. These images relate to the path 162 and the row 34. Also, topographic map of the region has been used to control the accuracy of geometric modification. The studies indicate appropriate accuracy of the images.
Since there's not a native model compatible with atmospheric conditions ATCOR-2 software has been used for the atmospheric corrections of the images, To apply this software, we have used some required parameters including sea level, pixel size, image, date and time of imaging to GMT of calibration file, the atmospheric and moisture condition, solar zenith angle, solar azimuth angle, latitude and longitude of the region were entered to the software and the modified image of this model was used. Then the desired images were classified by the supervised classification method of maximum likelihood and the results were used in the soil erosion model.
In the real world, the effective factors on soil erosion are different in various areas. So, the basin needs to be divided into homogeneous units before soil erosion calculations. The best method for the soil erosion modeling in GIS is network discretization. In this research, Gharesou basin was analyzed based on raster network data with 30 meters cell size, because, from one hand it's small enough to show heterogeneity of the basin and on the other hand, it matches pixel dimensions of landsat satellite images.
In the RUSLE, the mean annual soil loss is expressed as a function of six erosion factors:
A=R × K × L × S × C × P (1)
In this relation, A is the average of soil erosion (t ha-1 year-1), R: rainfall erosivity, K: soil erodibility, L: gradient length, S: slope steepness, C: the crop management factor, and P the erosion control practice factor, P: Conservation practice factor (Figure 2) [25].

Figure 2: Chart of research process.
To run the RUSEL model in GIS, first, rainfall raster layer, soil, slope, Digital Elevation Model (DEM), and also layers of land-cover were created. Each of the involved factors was calculated in separate units in the basin level.
Land use land cover change
Classification of TM, OLI sensor images of landsat satellite of the study area for the years 1985 and 2015 was obtained using supervised classification method by maximum likelihood. Table 1 shows land cover changes in a 30-year interval in Gharesou basin. Meanwhile, as the most important changes, we can mention the increase of agricultural lands, cultivation changes in irrigated farming, reduction of dense forests, an increase in human settlements, bare lands and pastures and reduction of forest cover. The maximum change is related to the irrigated farming, it has grown 7 times during 30 years. This growth indicates cultivation pattern changes and type of plants. Also, dense forest cover has been reduced more than 50 km2 during this period of time. Another important point is that urban land use and residential settlements have experienced the growth more than 3 times and the growth of impenetrable terrain affects the processes on the basin. Most of the settlements in the basin are located in coastal plain of the basin. They include some parts of Minoodasht, Gonbadekavous city and villages which have been extended during 30 years (Figure 3).
| Land use- land cover | Area (1985) | Area (2015) | Changes 1985 - 2015 | ||
|---|---|---|---|---|---|
| km2 | % | km2 | % | ||
| City and Residential Settlement | 7.16 | 0.46% | 29.04 | 1.87% | 1.41% |
| Dense Forest | 538.04 | 34.65% | 489.84 | 31.55% | -3.10% |
| Low Dense Forest-Garden | 177.42 | 11.43% | 154.12 | 9.93% | -1.50% |
| Dry Farming | 347.19 | 22.36% | 313.94 | 20.22% | -2.14% |
| Irrigated Farming | 11.67 | 0.75% | 72.61 | 4.68% | 3.93% |
| Pasture | 427.19 | 27.51% | 441.18 | 28.41% | 0.90% |
| Rocky And Uncovered Land | 44.02 | 2.84% | 51.94 | 3.34% | 0.50% |
| Total | 1552.68 | 100.00% | 1552.68 | 100.00% | |
Table 1: Land use- land cover area in 1985 and 2015 (km2).

Figure 3: Land cover classification map in 1985 and 2015.
Rainfall erosivity factor (R)
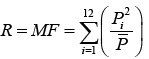
Rainfall erosivity factor is an important agent in RUSEL model. It's mainly responsible for soil erosion as a function of precipitation and physical features. We can assume that in the absence of precipitation, degradation and soil erosion will be much less than the present amount and another important factor is wind erosion. Also landform and precipitation elongation are effective factors in degradability of soil. Since the study area is small, to have the rainfall pattern we used the stations of the basin. In this research, monthly rainfall data of 10 stations has been used to calculate annual factor R. Due to the lack of statistics on the kinetic information of the rain (E), and maximum precipitation of 30 minutes in the study stations, Renard and Freemond (1994) method has been used. This method is based on the average of monthly and annual rainfall and it was used to estimate the annual amount of rain erosivility in each station. In this method, factor R in each station is estimated through the following equations, and it's estimated by calculation of the modified Fornier (F) index.
 (2)
(2)
A=0.7397F1.847, F<55mm (3)
A=95.77-6.081F+0.477F2, F<55mm (4)
In this equation, pi: average of rainfall (mm) in month, i and p the average of annual rainfall (mm). In this study, eqn. (3) was used to calculate Fornier index for all stations, then, by inserting Fornier index in the equations suggested by Renard and Freemond for the regions without detailed thunderstorm, factor R was estimated for index stations [26]. The results of factor R was calculated in the basin level. According to Figure 4, the amount of this factor, in the northern half is more than the southern half of the basin. In this range, the amount of 4 stations is more than 800 mm a year. The values of factor R in the level of the basin are changing from 85 to 396, and its average for Gharesou basin is 207.6.

Figure 4: Climatology station map and rain erosivity factor (R).
Gradient length (L) and slope (S) factors
L and S factors in RUSLE model indicate the impact of topography on soil erosion. It has been proved that the increase of gradient length and slope can increase the water flow rate on the ground and exacerbates soil erosion [27]. According to the studies, pure soil erosion is more sensitive to the changes of slope than the length [28]. Gradient length is a distance between the top point and the minimum point of gradient and in this point deposits precipitate [20].
To calculate LS factor elevation digital model (DEM) layer with pixel size of 30 meter has been used. Then, raster layer of slope with a cell size of 30 meters was provided. LS factor was calculated based on Moor's proposed equation and based on gradient raster layers and flow accumulation. Flow accumulation layer was obtained for Gharesou basin using hydrologic tools in GIS [29].
LS=(Flow accumulation × cell size /22.13)0.6 × (sin slope× 0.0896)1.3 (5)
The average gradient of the basin is 16.4 degree and it indicates a steep slope of the basin and mountainous situation of Gharesou basin. Also the average amount of LS factor calculated by eqn. (5) is 5.19. The maximum amount of LS factor for mountainous areas with steep slope is 55.3 and in coastal plain areas of the basin this amount is close to zero (Figure 5).

Figure 5: The map of LS factor and gradient (slope).
Soil erodibility factor (K)
Soil erodibility indicates natural sensitivity of soil to the erosion and it implies the ease of separation of soil particles due to the kinetic energy of raindrops and pushing them by water flow [30]. These processes are effected by features of soil such as size of particles, structural stability, the amount of organic matter and nature of mineral matter. Therefore, soil texture is an important factor and it affects on erosion. In this study, soil texture information was produced using soil samples of agricultural Jihad organization for 30 soil sample. Soil erodibility was estimated using the value of K triangle (Figure 6) and based on the soil texture [31]. After entering the information from Kringing method, it was used for interpolation of information and finding K factor layer. The obtained values change from 0.03 to 0.385. The minimum amount is for sandy soils and the maximum amount is for the areas with silt loam soils. The average of K factor is 0.23 in level of the basin.

Figure 6: The map of soil erodibility factor (K), and triangle of factor estimation.
Cover factor (C)
This factor indicates the proportion of the amount of soil loss from cultivated lands, to the eroded soil from the same land parcel during continuous fallow with no cover or plant remains [20]. The most widely used vegetation criterion is Normalized differential vegetation index (NDVI), and it's achieved using remote sensing technology. This index indicates reflection of solar energy from the ground that shows types of vegetation cover. NDVI values are fluctuating between -1 and +1. When the spectral response measured from the ground is very similar for both bands, the values close to zero. The vegetation in the infrared (IR) spectral part has more reflection than red visible spectral part. Therefore, NDVI values for green vegetation will be positive. Low vegetation areas or areas without any vegetation, such as city areas and bare lands usually show values between -0.1 and +0.1.
Relation between C and NDVI is as following:
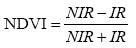 (6)
(6)
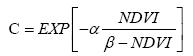 (7)
(7)
In these Equations α and β are parameters, without unit, and their values are 2 and 1, respectively [32]. Therefore, C value can be calculated in each pixel. In this research, the map of factor C was provided based on NDVI.
In fact, this factor has a complete inverse relation with NDVI. Since land cover changes can be resulted from vegetation change of the area, this factor was extracted by two images of Landsat satellite in a 30 year interval. These used images relate to the beginning of the summer, so, vegetation is in the maximum of its own growth season. Accordingly, an appropriate estimate can be obtained from the quality of vegetation. Average values of vegetation factor for the years of 1985 and 2015 are 0.3913 and 0.4074 (Figure 7).

Figure 7: Cover factor (C) in 1985 and 2015.
Conservation practice factor (P)
In the steep areas, cultivation needs conservation to protect water and soil. This operation decreases waste water to the bottom of erosion threshold, so, it reduces the power of water erosion and its carrying capacity. Conservation operation includes contour cultivation, terracing system, covered streams and so on. P factor is proportion of eroded soil in conditions of protective operations to the erosion created in standard condition, that's mean plowing in the slope direction [25]. Because only a very small area has conservation practices, P factor values are assumed as 1 for the basin.
After providing required information layers of the model and preparing them as raster maps with pixel size of 30 meters, the map of annual soil erosion potential was extracted (Figure 8).

Figure 8: Spatial distribution map of annual soil erosion potential for 1985 and 2015 (t ha-1 year-1).
Soil erosion is the greatest damage for soil resources in Iran. Awareness of dangers of soil erosion in basins makes it possible to identify critical and vulnerable areas. This helps to prioritize management and protective plans. This phenomenon is affected by human and environmental factors everywhere. Erosion destroys farming soil and causes poor production capacity of soils, and erosion weakens vegetation and pollutes natural water through sedimentation. In this research, the effects of land cover changes on potential of soil erosion in Gharesou basin (one of the sub-basins of Gorganrood basins) was examined by RUSEL model, RS, and GIS technologies. Also, spatial distribution, and potential changes of soil erosion was obtained for a 30 year interval in 1985 and 2015 years. Annual soil erosion potential was obtained from the product of rainfall erosivity factor(R), Topography factor (LS), soil erodibility factor (K), Cover factor (C), conservation or protection factor (P).
The results revealed the effect of land cover on the soil loss in Gharesou basin. Also, the growth of impenetrable areas by human activities, the growth of urban and rural areas, cultivation pattern changes, vegetation and pasture degradation affect these changes. According to the results of RUSLE model, the basin was divided into 5 classes in terms of soil erosion in two study years and it indicates soil sensitivity to erosion.
According to the Table 2, changes of the classes indicate a general trend to the soil loss in the basin. Therefore, Gharesou basin is a basin with increasing soil erosion potential. In the plain and coastal plain areas of the basin, that is the mainly cultivated area, the amount of erosion is different from the other areas, and soil loss process is decreasing. It's due to the changes of cultivation method from traditional to modern, increase of irrigated farming area, choosing more environmentally friendly plants, and also, increase in the area of cities and villages from 7.14 percent to 29.04 percent during 30 years. In the study classes, for output of RUSLE model, in every three years of study, the maximum area relates to the classes of 100 to 200 (t ha-1 year-1) that is more seen in the mountainous regions. In these regions, all factors except vegetation are toward soil loss. Also, during 30 years, the amount of dense vegetation decreased from 34.56 to 31.55. In fact the only factor in protecting soil in (prone to erosion) areas has given its place to less effective vegetation, so, the area of this region has increased and Gharesou basin is in danger of soil loss in mountainous and forest parts. Also, areas with more than 200 Ton in hectare, with the lowest amount, have had a tangible increase during 30 year of study and its amount has increased from 11.74 to 12.50. These areas are usually located in mountainous parts with no vegetation. Also, according to Table 3, the average of soil erosion potential estimated in Gharesou basin for 1985 and 2015 is 102.02 and 103.76 (t ha-1 year-1). This amount was found in the sub-basins too and except the sub-basin 4 located in coastal plain areas of the basin, with farming use, the amount of other sub-basins is increasing (Table 3). According to the results of study, mountainous parts of Gharesou basin, has the most damage due to the accumulation of involved factors in the potential increase of soil loss. So, the necessity of watershed management is observed. Also modification of cultivation pattern and soil conservation training in farming lands of foothills and hillsides are required.
| Soil erosion potential (t ha-1 year-1) | 1985 | 2015 | Changes rate Percent | ||
|---|---|---|---|---|---|
| Area (km2) | Area (%) | Area (km2) | Area (%) | ||
| Low (0-25) | 237.83 | 15.32 | 244.71 | 15.76 | 0.44% |
| Moderate (25-50) | 215.42 | 13.87 | 203.61 | 13.11 | -0.76% |
| Severe (50-100) | 418.68 | 26.96 | 396.94 | 25.56 | -1.40% |
| Very severe (100-200) | 498.41 | 32.10 | 513.33 | 33.06 | 0.96% |
| Extremely severe (>200) | 182.34 | 11.74 | 194.08 | 12.50 | 0.76% |
Table 2: The area of soil erosion potential classes (t ha-1 year-1) for two study years.
| Sub-Basin | Average 1985 | Average 2015 |
|---|---|---|
| Sub-Basin1 | 115.55 | 124.49 |
| Sub-Basin2 | 131.08 | 141.3 |
| Sub-Basin3 | 104.09 | 103.43 |
| Sub-Basin4 | 52.54 | 45.84 |
| Basin | 102,2 | 103,76 |
Table 3: The average of soil erosion potential for sub-basins (t ha-1 year-1).
It is possible to detect and predict the most vulnerable areas, due to the awareness on the level of soil erosion on those zones. Also, this awareness provides an opportunity for the authorities to have a revision on their managerial and protective priorities. Soil erosion is caused by either natural or human associated factors. According to the results of RUSLE model for the Gharesou basin, the level of soil erosion is highly affected by the land cover. Conducting the survey with the use of Remote Sensing tools, in the Gharesou basin over thirty-year period demonstrate a significant decline in the density of dense-forest, lowdensity forest and grasslands as well. It seems that these natural land uses were replaced by the human activities and constructions, such as farming lands, human habitat, or wasteland in some cases. There are several factors contributing to this scale of change. For instance, an increase on the inaccessible places caused by human activity, a growth on the urban and rural areas, changes on the farming trends, destruction of the natural resources. Based on the result of RUSLE model, the above-mentioned basin is likely to be in the expose of a higher level of soil erosion; and it is the result of changes in land cover and land use. According to the results of RUSLE Model, in the watershed there is an increase in potential of soil erosion and consequently in land-cover and land use changes. The increase is obtained by a growth of 1.74 (ton per hectare per year) in the average of potential soil erosion and in high risk areas. The result also shows that the most damaged zones in the scope of soil erosion are located in the mountain area. It is due to the fact that the determinants of soil erosion are mostly located in this area. In terms of the land use, for example, the forest was exponentially converted to the farming or grasslands. Accordingly, there is an urgent demand for managerial activities, particularly Watershed management program. Moreover, it is essential to increase the awareness of local inhabitants in hillsides. Providing a systematic training system could lead to a positive revision on the farming trend. In one of the studied zone, sub-basin No. 4, it seems that farming a more compatible plant caused a significant reduction in the potential of soil erosion. Therefore, although it is highly unlikely to remove the effect of human activities in a large scale, it is not insurmountable since the soil can be protected in long term planning through tending to select a more compatible plant.