Journal of Geography & Natural Disasters
Open Access
ISSN: 2167-0587
ISSN: 2167-0587
Review Article - (2017) Volume 7, Issue 2
Based on domestic and international research on geopolitical influence, this study constructed an evaluation model that analyzed the factors of hard power, soft power, and climate change on geopolitical influence. After selecting indexes for each of these elements, a Factor Analysis was used to calculate the geopolitical influence of 30 countries, accounting for the impact of climate change influence. The results showed: 1. Climate change has an impact on the shifting landscape of geopolitical influence, but shifts in global power can still be largely related to preexisting factors of influence. 2. There are obvious differences in the degrees of influence among the 30 surveyed countries, and these differences can be divided into four levels. 3. Members in the three climate negotiating groups also have their own hierarchies of influence; for instance, EU countries have three distinct levels, and members in the Umbrella Group vary greatly, as does their stance on climate change. This is even more true for states that are members of the G77 and China group.
Keywords: Climate change; Geopolitics; Influence; Evaluation index
Traditional geopolitical contests have been primarily focused on possessing or controlling key geographical elements, such as resources, markets, transportation lines, territories, and access to seas [1]. In recent years, the politicization of climate change has intensified. This is even truer after the disappointing results of the 2009 Copenhagen Climate Change Conference, which allowed climate change issues to become even more of a tool for diplomatic contests. Developed countries used climate change as a new geopolitical instrument, which they combined with a variety of trade practices and technical methods to advance their own political and economic interests. These states attempted to use climate change funding assistance and technology transfers to divide blocks of developing countries from within. The decline of the EU, the negative attitude of the Umbrella Group, and rise of the BASIC indicates that division and reorganization within the traditional climate negotiation groups is inevitable. Geopolitical contests have been elevated from traditional arenas to incorporate issues regarding climate change, making future geopolitical negotiations even more complicated.
Currently, research on climate change and climate governance is divided into two general categories: science and politics. The Intergovernmental Panel primarily leads the scientific side of this initiative on Climate Change (IPCC). This panel conducts analysis and evaluation of scientific problems related to global climate change [2]. The focus of the IPCC’s research is to locate the scientific basis of climate change, to understand the relationship between human activities and climate change, and to lead efforts to influence and adapt to climate change [3]. The political side of climate change research is mainly the domain of nations’ climate-related political negotiations in the United Nations Framework Convention on Climate Change (hereinafter referred to as “the Convention”). The task of the Convention is to establish frameworks and treaties for future global negotiations on climate change [4]. Their research focuses on allocating responsibility for emission mitigation, distributing international carbon emission allowances [5], stipulating the demands of each body’s climate negotiating position, interests, and policy changes [6-9], and examining the role climate change plays in the evolution of geopolitics [10].
Evaluating geopolitical influence has long been a concern of the academic world. Traditional approaches to doing so have focused on measuring a nation’s overall strength. These rubrics gave great weight to hard power factors such as political stability, military authority, and economic strength, and ignored soft power factors like technological skills, cultural influence, and informational assets. In recent years, new research has catalyzed a shift from these simple evaluations of overall national strength to a more nuanced consideration of geopolitical influence, as well as a more in-depth analysis of specific types of geopolitical influence (Table 1).
| Scholars and institutions | Research findings | Research characteristics | |
|---|---|---|---|
| Traditional Geopolitical Influence Research | Ray S Cline (1977) | Provided a new equation for determining overall national strength. Suggested that overall national strength should be divided into two parts: material and spiritual powers. | Focused more on studying overall national strength. One-sided and with an over-emphasis on power and political work. Neglected the soft power influence of technological ability on geopolitical influence. |
| Japan Comprehensive Research Institute (1987) | Argued that economic strength and technology are the most important factors in evaluating overall national strength. Land and population are not main factors. | ||
| Lausanne, Switzerland IMD (Since 1989) | Issued annual International Competitiveness Research Report. Based on the levels of national competitive strength and governmental function, divided the components of national strength into economic strength, internationalization, governmental effects, financial environment, infrastructure, management, technology, and population structure. | ||
| Huang Shuofeng (1992) | Presented an overall national strength function and categorized overall national strength into three variables of influence: Hard, Soft, and Synergy. Used nonlinear differential equation to calculate the dynamic evolution of overall national strength. | ||
| Wang Songfen (1997) | Used a linear summary method of hierarchical power structure to measure overall national strength. The elements indicative of overall national strength are: resources, domestic economic activity, foreign economic activity, technological ability, social development conditions, military power, government regulation ability, and diplomatic ability. | ||
| Hans J Morgenthau (2005) | Proposed that overall national strength consisted of nine factors: geographical conditions, natural resources, industrial capacity, military preparation, population, national character, national morale, diplomatic ability, and quality of government. | ||
| JiaHaitao (2012) | Advocated for factors of culture and education in the evaluation of overall national strength. | ||
| New Research | Wang Shufang (2014) | Founded on location theory, measured China’s geopolitical influence on other countries using the distance between two countries. For instance, models and calculates the geopolitical influence of South Asia on China’s periphery. | No longer reliant on simple evaluations of national strength. |
| GuMengchen (2015) | Evaluated specific types of geopolitical influence from the perspective of oil and gas resources. |
Table 1: Research progress of geopolitical influence assessment.
Undoubtedly, climate change is driving shifts in the global geopolitical environment. Countries and country groups still need scientific explanations and answers on several facets of this phenomenon, including questions about the nature and degree of the impact that climate change will have on the geopolitical landscape. Climate change is a new variable in this dynamic that will have a substantial impact on the world’s geopolitical situation. Emission mitigation, for example, may be used to limit the economic progress of developing countries. Specifically, it can be used to justify restrictions on oil consumption and exportation, which will have significant economic repercussions on petroleum exporting countries. Energy technology leaders will gain expanded international speaking rights. Carbon taxes and carbon trading will also bring change to international trade and financial markets.
This paper takes traditional geopolitical influence as a baseline, and chooses several key indexes from ecological, diplomatic and economic areas that affected by climate change. These key indexes were added to traditional metrics for determining geopolitical influence, and the nature and degree of their impacts on traditional geopolitical factors were assessed. The selection of these new factors should not override traditional geopolitical influence indexes, but rather are meant to contribute a greater level of specificity to climate change research.
Research sample
The management of international climate change is primarily executed through climate negotiations. Over the course of years of negotiations, major countries slowly coalesced into groups, a result of considering their own needs, benefits, and power contests in negotiation. These include political alliances as well as intergovernmental organizations with clear political agendas, such as the European Union (EU) and the Group of 77 (G77). They also include organizations such as the Umbrella Group, the Rainforest Alliance, and the Environmental Integrity Group (EIG), which are loosely organized around common interests to deal with climate change [11]. The actors in climate negotiations have therefore changed from individual countries to climate groups, such as the EU, the Umbrella Group, and the G77 plus China. In selecting study samples for this survey, these were the three major negotiation groups were taken into account, along with a crosssection of the remaining countries outside of these three major groups. Totally 30 countries were selected (Table 2).
| Category | Country (30) |
|---|---|
| EU Countries (10) | Germany, Britain, Italy, France, Poland, Spain, Holland, Czech, Belgium, Greece |
| The Umbrella Group (8) | U.S.A., Russia, Japan, Canada, Australia, Ukraine, Norway, New Zealand |
| Basic Countries (4) | China, India, Brazil, South Africa |
| Representative of other typical countries (8) | Iran, Saudi Arabia (OPEC),Egypt, Kenya (African countries)Cuba (the union of small islands), Indonesia (ASEAN), South Korea,Mexico (EIG) |
Table 2: List of the study samples.
Index selection and data source
Based on a consideration integrating hard power, soft power, and climate change influence, 24 indexes were selected. Hard power refers to military power, economic power, technological power, and the strength of resources such as land area, population, and natural reserves [12-15]. Soft power includes political power, cultural power, and diplomatic power. In selecting indexes, the study also merged indexes that have been presented in previous studies that included other factors, such as weapon exports and international organization, into categorizations of hard and soft power. The indexes for climate change impact were selected based on the criteria of ecological effects, diplomatic influence, and economic impact. See Table 3 for specific descriptions and data sources for the evaluation indexes.
| First order index | Second order index | Third order index | Number | Index description | Index data source |
|---|---|---|---|---|---|
| Hard Power | Resource Bases | Human Resources | M1 | Total Population | World Bank Data |
| Energy Resources | M2 | Proven Reserves of Fossil Fuels (million tons of standard coal) | BP Statistical Review of World Energy 2014 | ||
| Economic Strength | Domestic Economic Activity | M3 | GDP (constant dollars 2005) | World Bank Data | |
| M4 | Per Capita GDP (constant dollars 2005) | World Bank Data | |||
| Foreign Economic Activity | M5 | Exports of Goods and Services (constant dollars 2005) | World Bank Data | ||
| M6 | Total Reserves (including gold, US$) | World Bank Data | |||
| Military Force | Military Base | M7 | Military Expenditure ($Million 2011) | Global firepower United States global military network | |
| Military Industry | M8 | Arms exports ($M) | Stockholm International Peace Research Institute (SIPRI) Database | ||
| Technological Strength | Technological Investment | M9 | R&D Expenditure (% of GDP) | World Bank Data | |
| Technology Export | M10 | High-technology exports (% of manufactured exports) | World Bank Data | ||
| Soft Power | Government Capacity | Government Regulation and Control Ability | M11 | General Government Final Consumption Expenditure (constant dollars 2005) | World Bank Data |
| Public Relation Department Corruption Rating | M12 | Global Corruption Perceptions Index | Corruption Perceptions Index | ||
| Cultural Strength | Cultural Attraction | M13 | World Cultural Heritage | UNESCO Database | |
| Strength of Cultural Productive | M14 | International Tourist Entry Number | World Bank Data | ||
| Diplomatic Strength | Participation in International Activities | M15 | Intergovernmental International organization (IGO) Participation Rate | «YearBook of International Organization» | |
| Influence Among International Organizations | M16 | International Monetary Fund Voting Number | Scoring and Evaluation | ||
| Climate Change Impact | Climate Change Ecological Impacts | Climate Change Adaptation Abilities | M17 | Climate Change Vulnerability Index (EVI) | Secretariat of the Pacific Community (SPC) |
| Climate Change Diplomacy | Government Climate Diplomacy | M18 | Evaluation of Government in Climate Change Negotiations | Scoring and Evaluation | |
| Non-governmental Organization Influence | M19 | Number of Nongovernmental Organizations Involved in Climate Negotiations | IPCC Official Website data | ||
| Indirect Impact on Negotiation Skills | M20 | Number IPCC Authors | IPCC Report Related Documents | ||
| Climate Change Economic Impact | Emission Reduction Pressure and Cost | M21 | Per capita Carbon Emissions | World Resources Institute CAIT Database | |
| Traditional Industry Impacts | M22 | Export Value of High Carbon Industry | United Nations Commodity Trade Statistics Database | ||
| Emerging Industry Development | M23 | The Cleantech Innovation Index | Joint efforts of the world natural foundation (WWF) and Cleantech Technology Group |
Table 3: Index summary.
Note: 1. At the time of submission, a number of 2014 data indicators for a small number of countries had not yet been calculated; to account for this, the countries mentioned in this paper were subject to regression analysis over the last five years of available data [16-18].
2. The International Organization Influence (M16) index used International Monetary Fund Voting Number, Member of the United Nations Security Council Y/N, and Officials work in the WTO or WHO Y/N as three variables for scoring and evaluation.
3. The Government Climate Diplomacy (M18) index used Core Countries of Negotiating Group Y/N, Proposals or Initiatives for Constructive Negotiations Y/N, and Hinder behavior in Negotiation Process Y/N as three variables for scoring and evaluation.
Evaluation method
Indexes selected in this paper may have complex relationships with one another, so, for clarity, it is best to choose a select number of comprehensive indexes that include most of the information in the original index system. In addition, the relationship among the overall indexes should be minimized. A Factor Analysis can solve this problem very well [19-21]. The basic idea of a Factor Analysis is that variables that are closely related are classified into the same categories, and correlations among different kinds of variables are weighted less heavily. Variables within the same category are understood to be influenced by a common factor that is highly correlated with all the variables, and this is known as a common factor.
When the intrinsic system of a problem is not clear, Factor Analysis can be used to merge observed variables into common factors. Let each common factor represent a dimension. After an orthogonal or oblique rotation is performed, the dimensions can be considered uncorrelated with each other. Then these dimensions can clearly depict the system structure of the research objects.
Process analysis
The statistical software PASW Statistics 18 was adopted to extract 4 common factors from 23 indexes; these were named and explained through the analyses of common factors of various indexes with larger loadings.
The first factor reflects the indexes of fossil energy reserves, total GDP, military spending, weapons exports, government spending, IMF voting rate, the number of non-governmental organizations participating in climate negotiations, and the number of IPCC report writers. All these are related to a country's hard power.
The second factor reflects the indexes of per capita GDP, R&D expenditures and percentage, high-tech exports, corruption perceptions index, and a clean technology innovation index. These indexes are related to levels of social development and technology [22,23].
The third factor reflects the indexes of total population and total reserves. These are related to human resources.
The fourth factor reflects the indexes of world cultural heritage, global IGO participation rate, and governmental climate negotiation behavior. These are related to a country’s diplomatic activity.
This article identifies the four common factors as economic gross factor, development level factor, human resource factor, and cultural diplomacy factor, respectively. These four factors can be used to explain the impact of climate change influence in the geopolitical landscapes of the thirty surveyed countries.
The scores of the four common factors were weighted and added. The variance proportion was utilized as weights in this paper. The variance contribution rates of the four common factors after rotations were 33.707%, 19.384%, 14.574% and 13.415%, respectively. Allowing X1~X4 to be the four common factors, the formula for calculating national geopolitical influence is:
W1=33.707%*X1+19.384%*X2+14.574%*X3+13.415%*X4
The software’s function of ‘conversion → variables’ calculation and input variables according to the above formula was used to obtain factor scores for national climate geopolitical influence, overall score, and ranking I, of which X1~X4 are: economic gross factor, development level factor, human resource factor, and cultural diplomacy factor.
Result analyses
Based on the results in Table 4, a number of conclusions can be drawn.
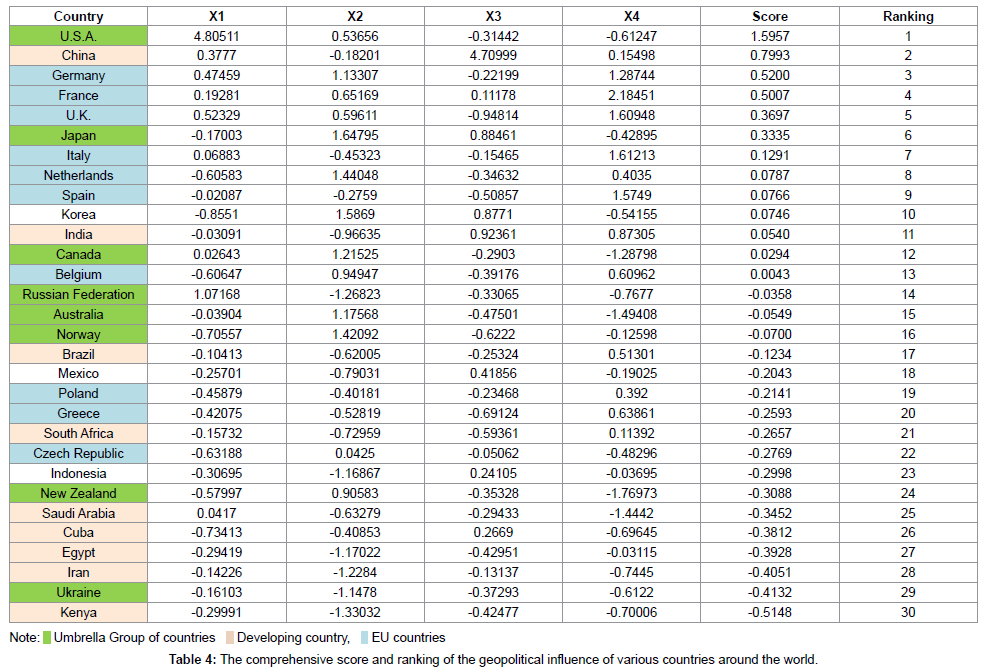
Comprehensive influence level analysis: After making a comprehensive analysis of all scores of the countries in Table 4, countries are divided into four levels based on their degree of influence:
The first level consists of the United States, China, Germany, France, the United Kingdom, and Japan (countries with scores over 0.3 points). The scores of most factors in these four countries are much higher than those of other countries, indicating that they have strong geopolitical influence. This is because, on the one hand, these countries have a robust overall national power, and on the other hand, because they show their leadership to the developed and developing countries in climate negotiation and management. Even within this level, however, different countries have different strengths and weaknesses in specific factors; for instance, the United States had higher scores in economic gross and environmental resource factors, while China had higher scores in human resource and cultural diplomacy factors.
The second level consists of Italy, Holland, Spain, South Korea, India, Canada, and Belgium (countries with scores from 0-0.3 points). Countries in this group had higher scores in two or more factors. Although they do not have as strong of a geopolitical influence as China or the United States, they still have power in the geopolitical field, and they should not be overlooked. In climate change negotiations, they also have certain effects in their own group.
The third level consists of the Russian Federation, Australia, Norway, Brazil, Mexico, Poland, Greece, South Africa, the Czech Republic, and Indonesia (countries with scores from-0.3-0 points). These countries often have higher scores in one or two factors. Their influence in their particular group is neutral. Generally, they follow the positions advanced by more influential countries, but they sometimes propose changes and take initiative in negotiations. For instance, the proposal to assess various countries’ historical responsibilities for climate change was put forward by Brazil in the Warsaw Convention; this was supported by most of the developing countries, improving the defensive position of the developing countries in negotiations.
The fourth level consists of the remaining countries (countries with scores less than-0.3 points). These countries can be divided into the following three categories: 1. Countries such as Saudi Arabia and Iran, which are dependent on energy exports and are impacted by climate change. 2. Countries such as New Zealand and Egypt, that worry that emission reduction requirements would impede their economic development and therefore take a negative attitude toward climate negotiations. 3. Countries that have always had low traditional geopolitical influence such as Cuba and Kenya. These countries tend to score lower on four or more factors, and their climate geopolitical influence is relatively low (Figure 1).

Figure 1: Climate-change-influenced geopolitical influence scores of 30 countries.
Internal influence level of national group: Based on the analysis on three climate negotiation groups, the differences in influence between group members can be seen from their scores in Table 4.
The ten EU countries are divided into three groups based on their degrees of influence. The first group comprises Germany, France, and Britain. These three countries are traditional geopolitical powers in Europe and are the backbone of EU leadership in climate change negotiations. The second group comprises Italy, Holland, Spain, and Belgium. They represent Europe’s moderately developed countries, which have less influence in geopolitics and climate negotiations than the countries in the first group. Normally they follow the lead of the first group. The third group comprises Poland, Greece, and the Czech Republic. They represent developed EU countries experiencing economic recession, and Southeast European countries with a lower level of economic performance. Due to their national, financial, and/or economic structures, they stand in a relatively weak position in climate negotiations, which is partially reflected in their lower scores.
The United States and Japan had the most influence among countries in the Umbrella Group. Japan’s negotiating position became weaker in the post-Kyoto era, but it still ranks near the top of the Umbrella Group due to its historical geopolitical influence. Canada, Russia, Australia, and Norway make up the second tier within the Umbrella Group. The first three countries were highly similar in resource richness and domestic resistance to emission reduction. New Zealand and Ukraine were peripheral members of the Umbrella Group.
The largest internal difference was found in the G77 and China group. The members in the leading Basic 4, China, India, Brazil, and South Africa, were 2, 11, 17 and 21, respectively. Compared with the EU group (Germany, 3; France, 4; U.K., 5) and Umbrella members (U.S.A., 1; Japan, 6; Canada, 12), the difference in influence between G77 and China members was much larger. The difference between major members and the other members of the group was also larger than that within the EU and Umbrella groups, indicating the existence of unequal positions on policy-making negotiations in the group. This may shed some light on why it is more difficult for the developing countries to form a unified block, such as the EU.
Conclusions
The following conclusions were drawn from this study:
1) Based on domestic and international research about the degree of climate change impacts on geopolitics, this paper constructed an evaluation model for a combination of geographical factors: hard power, soft power, and climate change influence. Unlike traditional geopolitical influence evaluation, this evaluation model selected several key indexes from the ecological effects of climate change and diplomatic and economic influence, and compensated for the gap in using only traditional geopolitical influences by including climate change factors into current evaluations of geopolitical influence.
2) The sample countries can be divided into four levels based on the total scores they received from the Factor Analysis. The first level includes the United States, China, Germany, France, Britain, and Japan. The second level includes Italy, the Netherlands, Spain, Korea, India, Canada, and Belgium. The third level includes the Russian Federation, Australia, Norway, Brazil, Mexico, Poland, Greece, South Africa, the Czech Republic, and Indonesia. The fourth level includes the rest of these countries. National influence decreased progressively down these four levels.
3) The internal influence of members within each of the three climate negotiation groups also merits attention. EU countries have obvious differences across three levels. The internal gap in the Umbrella group is large, and the member countries’ standpoints of climate change differ greatly. The differences among the members of the G77 plus China group appeared to be the greatest.
Further research on issues found in this study: When comparing calculations of individual scores and rankings of traditional geopolitical influence for each country, using 16 indexes of hard and soft power with ranking calculations provided in previous papers, it was found that countries’ positions within the two ranking systems were approximately the same. This indicates that the influence of current climate change negotiations on geopolitical influence is limited. Of course, it may also mean that the number of indexes for climate change influence is relatively scarce, and so the impact of common factors is not as well represented as are factors from indexes of traditional geopolitical influence. Moreover, the indexes selected for measuring climate change influence were condensed into a few major factors after Factor Analysis, making them unavailable for use in determining the indexes that caused changes to national influence. Future studies could discount the indexes of traditional geopolitical influence and consider only a climate change influencing factor index system in order to avoid interference from traditional influence indexes.
Changes in climate management pattern after the Paris climate conference: While this study was conducted, a convention for climate change management was held in Paris. The convention produced the Paris Agreement, the third landmark of international law, after the United Nations Framework Convention on Climate Change and the Kyoto Protocol. It clearly defined a mechanism for managing global climate change after 2020, introducing new criteria to global climate change management and national geo-competition.
The Paris Agreement made participation in a basic process of emission mitigation a global responsibility. The agreed-upon legally binding emission threshold was lowered, so that more countries could become more actively involved in global climate change management. By considering the variety of national conditions regarding emissions management, the Agreement ensures the most extensive participation from countries across the globe.
The Paris Agreement also abandoned the original top-down structure to emissions mitigation, and implemented a new model of bottom-up management, which allowed for certain top-down procedures as a supplement. Global climate change management now falls under a loosely binding mechanism of Intended Nationally Determined Contributions (INDCs). Even if the limits of this determined agreement are relatively weak, unifying developed countries such as the United States and developing countries such as China under a common agreement is a mark of great progress. In spite of the loosely binding mechanism, with in-depth climate change management and a clear understanding of the relevant legal treaties, the developed countries and major developing countries will make emission mitigation promises and contributions that are consistent with their particular levels of development.
Finally, the agreement clearly states a promise of financial support from developed countries to developing countries, giving developing countries with funding shortfalls the opportunity for substantial assistance. This will help to change the developing countries’ relatively weak positions in climate change negotiations.
The National Natural Science Foundation of China supported this work, No.41171110; Strategic Priority Research Program- Climate Change: Carbon Budget and Related Issues of the CAS, No.XDA05010205.