Fisheries and Aquaculture Journal
Open Access
ISSN: 2150-3508
ISSN: 2150-3508
Research Article - (2023)Volume 14, Issue 1
This study was conducted to assess current status of fishermen cooperatives in selected Oromia water bodies, Ethiopia that was aimed to update the information which will be used in fisheries management in major lakes and reservoirs. Both primary and secondary data sources were used to conduct the study. The primary data was collected from the fishermen organized at Lakes Zeway, Langano and Beseka and reservoirs Koka, Fincha and Gilgel-gibe. Papers were reviewed literatures and different secondary information source to conduct this study. The study included fishermen’s sociodemographic, educational status, fishing experience, purpose of fishing, season of fishing, fishing activities, fishing boat, fishing gears, saving practices and women participation. Data was analyzed using STATA version 14. A total of 154 fishermen (98.05% male), and 18 fishermen cooperatives operating on the selected lakes and reservoirs were interviewed during the survey. The livelihoods of majority of fishermen’s were fishing activities and some of them depend on mixing farming systems including crop production, livestock and petty trade. Among the respondent fishers, 88 (57.14) were involved in fishing activities year round. The majority of fishermen in selected water bodies responded that average fish catch per day was less than 10 kg. The main commercial fish species in Zeway, Koka, Langano water bodies were Nile Tilapia, African catfish, common carp and crucian carp and whereas in case Fincha and Gilgel-gibe, Nile tilapia and common carp fish species and African catfish in lake Beseka. The Tobit model was employed with household participation in saving as the dependent variable and the results shown that family size of household, access of fishing equipment, number of livestock unit, access of credit service and annual income of household from farming are significant determinants of saving decision of households. Based on these findings, we recommend that government policy intervention should focus on awareness creation and education on lakes and reservoir managements, increasing the availability and accessibility of credit services for fishermen, strengthen fishermen through providing fishing equipment's, increasing fishermen income through income source diversification and awareness creation for fishermen on how to improve saving practice.
Fishermen; Cooperative; Fishing activity; Saving decision; Tobit model; Water bodies
Ethiopia is a land-locked country and depends on its inland water bodies for fish supply for its population. The country’s water bodies have an estimated surface area of 7,334 km2 of major lakes and reservoirs, and 275 km2 of small water bodies, with 7,185 km of rivers within the country. According to Breuil, et al., the fishery is predominantly artisanal, currently involving 15,000 fishers (of which 5,000 are considered full-timers), fishing from 2,342 boats (366 motorized steel or wooden vessels, and the rest are reed or raft vessels), with some 17,240 nets and 28,000 hook gear [1]. Gear in use ranges from a variety of traps and spear, to gillnet and beach seine, and hooks on hand and long line. Motorized fishery is typical for Lake Tana. Primitive locally produced wooden boats are common in lakes Zeway, Langano and Hawassa and Koka reservior. Beach seines are used on lakes Zeway and Langano and Koka reservior. The use of gillnets and hook gear is widespread in the country's water bodies [2].
Ethiopia has the potential to produce over 51,500 tons of fish per annum. However, their exploitation and their contributions to food security and growth in the country are very less despite the technologies capable of resolving the problems of fisheries production [3]. Fisheries resource in Ethiopia, in spite of its significant contribution to poverty alleviation and food security, is an unexploited natural resource. Water bodies located in the rift valley show signs of overexploitation whereas those located in remote areas with poor infrastructure which make up the majority remain underutilized. Hence, the existing role of fishery is insignificant in the country’s overall economy because the fishery sector in the country is far below its potential. The current production is still far below the estimated potential yield, which suggests the possibility for further expansion of the fishery [4].
Fishery cooperatives played a significant role in helping small scale farmers to cope with competitive and fluctuating market and high transaction cost to develop their communities and have the potential to empower small scale fishers against environmental and socioeconomic shocks [5]. They can:
• Increase-fishers’ price negotiating power with market intermediaries, help stabilize markets and improve post-harvest practices and facilities.
• Increase market competition by setting up auctioning systems.
• Use their greater negotiating power to make cost-saving bulk purchases of fishing gears, equipment.
• Facilitate micro credit schemes for fishers to reduce their dependency on intermediaries and give them greater freedom in selecting buyers.
According to deacon, fishery cooperative defined as a group of cooperatives' members who are joined voluntarily to participate in catching fishes or supplying fishes from fish farmers. Cooperatives, as business entities and as self-help associations, play a significant role in improving the socioeconomic situations of the members and the communities [6].
There are many rivers and lake available in Ethiopia which used for a fish production, but there is still a problem regarding fish production and productivity to increase the profit of private and GDP of the country. According to, the fishing sector of the economy has various problems, among others, mismanagement of the resource, inappropriate policies and institution, inadequate technical and material backup to the sector and market are the major ones [7].
Study objectives
• To assess the current status of fishermen cooperatives in selected water bodies.
• To assess factors that affect saving practice of fishermen.
• To assess women participation in fishermen cooperative.
• To identify the major challenges of fishermen in selected water bodies.
Description of study area
Assessments of current status of fishermen cooperative was undertaken in selected water bodies of Oromia region. The research was conducted in East Showa Zone at Zeway lake, Koka reservior and Beseka Lake fishery cooperative, West Arsi Zone at Langano lake fishery cooperative, Horo Guduru Wollega Zone at Fincha reservoir fishery cooperative and Jimma zone at Gilgel- Gibe reservoir fishery cooperative in 2018 [8].
Koka reservoir: The koka reservoir is located in the Awash river basin in central Ethiopia (8 26°N, 39 02° E). The 1200 km long Awash river, this has its head waters in the plateau near Addis Ababa at 2300 m (above mean sea level), discharges below sea level into Lake Abbe in the Danakil desert. The koka reservoir is located 90 km south of Addis Ababa at an elevation of 1600 m [9]. It has a surface area of about 200 km2 and a capacity of 1650 Mm3. The Koka dam consists of concrete with a length of 458 meters and a maximum height of 47 meters [10]. It was created by the construction of the Koka Dam across the awash river [11]. The reservoir has an area of 180 square kilometers. The reservoir supports a fishing industry; according to the Ethiopian department of fisheries and aquaculture, 625 tonnes of fish are landed each year, which the department estimates is either 52% or 89% of its sustainable amount. Both the reservoir and the dam are threatened by increasing sedimentation caused by environmental degradation as well as the invasive water hyacinth [12].
Langano lake: Langano is a lake in the oromia region of Ethiopia, exactly 200 kilometers by road south of the capital, Addis Ababa, on the border between the East Shoa zone and West arsi zones. It is located to the east of lakeAbijatta in the main Ethiopian rift at an elevation of 1,585 meters (lake Langano is 18 kilometers long and 16 km wide, with a surface area of 230 square kilometers and a maximum depth of 46 meters. The lake has a catchment 1600 square kilometers in size, and is drained by the Hora Kallo river which empties into the adjacent lake Abijatta [13].
Lake Langano is popular with tourists and city dwellers. The lake is brown in color and at first sight one may think that the lake is not clean. However this is not the case, the reason for the color is due to the richness of minerals including high sulphur levels which have led many to believe that the lake water has healing properties. There are a number of resorts around the lake and water sports are popular.
There is a variety of wildlife around the lake, which includes hippos (rare), monkeys, baboons, warthogs, and a huge variety of birds. The area around the lake is largely deforested, however, and a large number of herders live around the area. Two earthquakes had their epicenter near this lake, the first in 1906 (a magnitude 6.8 on the richter scale), and the second in 1985 (magnitude 6.2). After the earthquake of 1906 there formed a 25 m-30 m tall geyser on Edo Laki Island on the Northern part of the lake. The geyser disappeared circa 1966-1970, leaving a hot spring [14].
Zeway Lake: Lake Zeway is one of the freshwater rift valley lakes of Ethiopia. It is located about 160 kilometers South of Addis Ababa. The districts holding the lake’s shoreline are Adami Tullu Jido Kombolcha, Dugda and Zeway Dugda. On the average, the lake is located at an elevation of 1650 meter above sea level and the lake is shallow and has an open water area of 434 km2 and shoreline length of 137 km, a maximum depth of 8.9 m and an average depth of 2.5 m. The maximum length and width of the lake is 32 km and 20 km, respectively. There are two main feeder rivers to L. Ziway; namely, Meki originating from Gurage mountains in the North-West and Ketar from the Arsi mountains in the east; and it has one out flow in the south through Bulbula river, draining into lake Abijata. Lake Zeway contains five main islands: Tullu Guddo (4.8 km2), Tsedecha (2.1 km2), Debresina (0.3 km2), Funduro (0.4 km2) and Gelila (0.2 km2). Debresina and Gelila have only a few inhabitants, the other three are inhabited by several hundreds of people. Technologies such as fish smoking technology was demonstrated at Tullu Gudo under lake Zeway condition [15].
Fincha reservoir: Fincha reservoir is one of the reservoirs in Ethiopia used for hydroelectric power generation. The reservoir is found in the Western part of the country in Horro Guduru Wollega zone, 286 km far from the capital city, Addis Ababa. The reservoir, situated at 9°33’N/37°24’E is surrounded by four administrative Woredas, namely Jimma Genet in South-West, Horro in West, Guduru in East and Southeast and Abay Choman in North and Northeast. It has an area of about 350 km2 at an elevation 2000 m.a.s.l. The reservoir has a mean depth of 7 m, maximum depth of 17 m with the temperature of 23°C [16].
Beseka Lake: Lake Beseka is located about 190 km from Addis Ababa, the capital of Ethiopia to the East. The lake is found in the rift valley system at 955 m.a.s.l. The time series of satellite data documented that Lake Beseka’s surface area was about 3 km2 in 1957, but reached 54 km2 in 2006. The fish resource of the lake was estimated to be about 205 tonnes per year whereas current production does not exceed 17 tonnes per year. For its high salinity, the lake water is not used for drinking purpose both for human and domestic animals although it is in area where water scarcity is much prominent [17].
Gilgel-Gibe reservoir: Gilgel-gibe reservoir is located 250 km Southwest of Addis Ababa and 75 km Northeast of Jimma city. It covers an area of 51 km2 at an altitude of 1670 meters above sea level. The four districts bordering the reservoir are Omonada, Sekoru, Tiro afeta and Kersa with 6 Kebeles, 4 Kebeles, 5 Kebeles and 2 Kebeles (smallest administrative unit) within ten kilometers from the shore line of the dam, respectively [18].
Sampling technique and sample size
A team of four members comprising BFOALRC staff conducted the survey using structured questionnaires with individual interview method. Three stage sampling procedures were used for the selection of sample household heads. In the first stage, three representative lakes namely lakes Zeway, Langano and Beseka and three representative reservoirs namely Koka, Fincha and Gilgel-Gibe were selected purposively from Oromia regional state. In the second stage, two cooperatives were selected purposively from each selected water bodies. In the last stage, from selected cooperatives about 154 sample of household heads were randomly selected from total fishermen involved in selected lakes and reservoirs using formula (Table 1) [19].
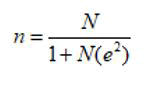
Where;
n=the sample size,
N=population size (sampling frame),
e=level of precision considered 9%.
| No. | Name of water bodies/site | Number of fishermen selected | Percent |
|---|---|---|---|
| 1 | Koka reservior (Site 1=fishermen cooperative organized at Koka reservior) | 37 | 24.03 |
| 2 | Lake langano (Site 2=fishermen cooperative organized at Langano lake ) | 21 | 13.64 |
| 3 | Zeway lake (Site 3=Fishermen cooperative organized at Zeway lake ) | 44 | 28.57 |
| 4 | Fincha reservior (Site 4=fishermen cooperative organized at Fincha reservoir ) | 19 | 12.34 |
| 5 | Beseka lake (Site 5=fishermen cooperative organized at Beseka lake ) | 13 | 8.44 |
| 6 | Gilgel-Gibe reservior (Site 6=fishermen organized at Gilgel-gibe reservoir) | 20 | 12.99 |
| Total | 154 | 100 | |
Table 1: List of study sites and fishermen selected.
Types of data and methods of data collection
For this study both primary and secondary data were used. The secondary data were explored from different sources including Horro Guduru Wollega zone and selected district Bureaus of livestock and fishery development, East Shoa zone and selected districts of livestock and fisher resource developments, West Arsi Zone and selected districts of livestock and fisher resource developments and Sokoru district livestock and fisher resource developments. Central Statistical Authority (CSA) and literatures were used as secondary data. On the other hand, questionnaires and checklists were prepared and employed to collect primary data from fishermen and key informants. The study employed cross sectional data collection tools because it is better and more effective for obtaining information about the current status or the immediate past of the case under study. It is also appropriate and suitable to use data collection tools such as questionnaires, interviews, Focus Group Discussions (FGD) and key informants interviews. The data collection survey and focus group discussions were undertaken in 2018. Both quantitative (questionnaire, secondary documents) and qualitative data collection instruments (FGD, Key Informant Interviews (KI) have been used. The formal survey was undertaken through personal interviews with a structured questionnaire administered. Before data collection, the questionnaire was pre tested on five farmers to evaluate the appropriateness of the design, clarity and interpretation of the questions, relevance of the questions and to estimate time required for an interview. Subsequently, appropriate modifications and corrections were made on the questionnaire. The questionnaire covered different topics in order to capture relevant information related to the study objectives. In both types of data information on the socioeconomic aspects of households including demographic characteristics, farm resources and source of income for the fishermen and fishing activities and constraints with fishing activities [20].
Method of data analysis
After data was collected from primary, it was analyzed using different methods of data analysis. Before analysis, quantitative data gathered using the survey was coded and entered into statistical software known as statistical package. The data analysis was carried out using the STATA-14 software. Simple descriptive statistical methods such as average %, standard deviation, and frequency distribution were used. In addition to this, descriptive tools such as tables, and pie chart were used to present data. The qualitative data analysis was used to see the relationships between the variables and they were then analyzed through systematically organizing the information and giving attention to local situations, opinions, perceptions and preferences of households and institutions operating in the district.
Econometrics model: In a probit model the variable of theoretical interest, y*, is unobserved; what is observed is a dummy variable, y, which takes on a value of 1 if yi* is greater than 0, and 0 if otherwise. In contrast, devised what became known as the tobit (tobin’s probit) or censored normal regression model for situations in which y is observed for values greater than 0 but is not observed (that is censored) for values of zero or less.
The standard Tobit model is defined as
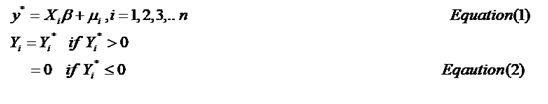
Where:
Yi is the observed decision of household savings,
Yi* is the latent variable which is not observed β is Vector of unknown parameters,
Xi is the vector of independent variables affecting household saving decision (Table 2).
| Description of variable | Measurement | Expected sign |
|---|---|---|
| Hh probability of saving | Dummy (1=saving, 0=not-saving) | |
| Age of the household head | measured in years | - |
| Sex of the household head | Dummy(1=male,0=female) | - |
| Family size of the households | Continuous variable measured in adult equivalent | - |
| Marital status of household | Categorical (1=single 2=married 3=divorced 4= widowed ) | + |
| Education of household head | Dummy (1=illiterate 2=followed formal education) | + |
| Access to credit | (1, if the household access credit, 0 otherwise) | + |
| Access of income of households from farming | Dummy(1=access of income from farming,0=not | + |
| Average fish catch per day | Continuous variable measured by kilogram | + |
| Access of own fishing equipments | Dummy (1, if the household access of own fishing equipments, 0 otherwise) | + |
| Fishing experience | Continuous variable measured in years | + |
| Access of own transportation | Dummy (1, if the household access of own transportation, 0 otherwise) | + |
| Access of extension service | Dummy (1,if the household access of extension service, 0 otherwise) | + |
| Livestock | Continuous variable measured in tropical livestock unit number | + |
Table 2: Dependent and independent variables.
The results discussed in this paper focus mainly on current status of the fishery cooperative in selected water bodies of Oromia region.
Socio-economic characteristics of sampled households
Demographics characteristics: As shown in Table 2, out of total households heads interviewed about 98.05 percent was male headed while 1.95 percent was female headed households. Education empowers people, strengthens their abilities to meet their wishes and increase their productivity and potential to improve their quality of life. In terms of education, the survey results show that about 5.84% of the sampled household heads was illiterate, 7.81% was able to read and write, 71.09% attended formal education (1 grades-8 grades), 4.69% was attended formal education (9 grades-12 grades) and 0.787% of sampled household holds diploma and above formal education. As depicted in Table 2, chi-square shows fishermen involved in fishing activity in selected water bodies were no statistically difference in level of education. The average age of sampled farm household heads was 42.54 year with a range of 18 years to 80 years. A family size ranging between 1 and 14 is witnessed in the selected farming households. The available data indicates that average family size in each household is 6.23.
Most of the fishermen have long experience on fishing activity. The average fishing experience of the respondents ranges 13.62 years. This study is in line with, which found that most fishermen at Zeway lakes have involved in fisheries activity in the last ten years (Table 3).
| Variables | Site 1 | Site 2 | Site 3 | Site 4 | Site 5 | Site 6 | Total | Chi-square | ||||||||
|---|---|---|---|---|---|---|---|---|---|---|---|---|---|---|---|---|
| Freq | % | Freq | % | Freq | % | Freq | % | Freq | % | Freq | % | freq | % | |||
| Sex | Male | 35 | 94.59 | 21 | 100 | 43 | 97.73 | 19 | 100 | 13 | 100 | 20 | 100 | 151 | 98.05 | 3.79 |
| Female | 2 | 5.41 | 0 | 0 | 1 | 2.27 | 0 | 0 | 0 | 0 | 0 | 0 | 3 | 1.95 | ||
| Education | Illiterate | 4 | 10.81 | 1 | 4.76 | 2 | 4.55 | 2 | 10.53 | 0 | 0 | 0 | 0 | 9 | 5.84 | 22.06 |
| Adult education | 4 | 10.81 | 1 | 4.76 | 1 | 2.77 | 1 | 5.26 | 1 | 7.69 | 0 | 8 | 5.19 | |||
| Primary education | 22 | 59.46 | 13 | 61.9 | 24 | 54.55 | 13 | 68.42 | 8 | 61.54 | 15 | 75 | 95 | 61.69 | ||
| Secondary education | 5 | 13.51 | 6 | 28.57 | 17 | 38.64 | 3 | 15.79 | 3 | 23.08 | 5 | 25 | 39 | 25.32 | ||
| Diploma and above | 2 | 5.41 | 0 | 0 | 0 | 0 | 0 | 0 | 1 | 7.69 | 0 | 0 | 3 | 1.95 | ||
| Marital Status | Single | 5 | 13.51 | 0 | 0 | 2 | 4.55 | 1 | 5.26 | 3 | 23.08 | 15 | 75 | 26 | 16.88 | 61.29*** |
| Married | 31 | 83.78 | 21 | 100 | 41 | 93.18 | 18 | 94.74 | 10 | 76.92 | 5 | 25 | 126 | 81.82 | ||
| Divorced | 0 | 0 | 0 | 0 | 0 | 0 | 0 | 0 | 0 | 0 | 0 | 0 | 0 | 0 | ||
| Widowed/er | 1 | 2.7 | 0 | 0 | 1 | 2.27 | 0 | 0 | 0 | 0 | 0 | 0 | 2 | 1.3 | ||
| Variable | Mean | SD | Mean | SD | Mea | SD | Mea | SD | Mean | SD | Mean | SD | Mea | Sd | F-value | |
| Family size (number) | 4.43 | 2.49 | 8.38 | 4.37 | 6.61 | 3.23 | 7.11 | 2.84 | 3.31 | 2.02 | 1.6 | 1.19 | 5.46 | 3.58 | 15.90*** | |
| Age (year) | 32.81 | 8.17 | 38.24 | 11.38 | 38.95 | 10.9 | 36.31 | 7.55 | 34.46 | 14.88 | 21.4 | 2.66 | 34.39 | 11.04 | 10.15*** | |
| Fishing experience (year) | 8.78 | 5.32 | 15.71 | 9.02 | 15.71 | 8.67 | 10.31 | 4.29 | 15.69 | 11.79 | 6.25 | 3.58 | 13.62 | 9.85 | 13.31*** | |
Table 3: Demographics characteristics of sampled fishermen in selected Oromia water bodies.
Land size and allocated pattern: One of the most important factors that influence crop production is resource endowment, availability of land for crop production and livestock rearing. As indicated in Table 3, out of 154 sampled fishermen 51.30 percent have access of cultivated land and 48.70 percent of fishermen have no access for cultivated land. This implies fishing activity is sole income source for majority of fishermen. The survey revealed that the mean own cultivated land size of sampled households was 1.01 hectare. Own cultivated land size of fishermen organized at Langano lake was more followed by fishermen organized at Fincha reservoir. As depicted in Table 3, also that the average rented land and shared in 2017/18 production season were 1.10 hectare and 1.14 hectare, respectively (Table 4).
| Variables | Site 1 | Site 2 | Site 3 | Site 4 | Site 5 | Site 6 | Total | Chi square | ||||||||
|---|---|---|---|---|---|---|---|---|---|---|---|---|---|---|---|---|
| Freq | % | Freq | % | Freq | % | Freq | % | Freq | % | Freq | % | Freq | % | |||
| Own land availability | Yes | 16 | 43.24 | 20 | 95.24 | 19 | 43.18 | 16 | 84.21 | 0 | 0 | 8 | 40 | 79 | 51.3 | 41.3*** |
| No | 21 | 56.76 | 1 | 4.76 | 25 | 56.82 | 3 | 15.79 | 13 | 100 | 12 | 60 | 75 | 48.7 | ||
| Variable | Mean | SD | Mean | SD | Mean | SD | Mean | SD | Mean | SD | Mean | SD | Mean | SD | F-value | |
| Own cultivated land | 0.77 | 0.49 | 1.36 | 1.57 | 0.69 | 0.24 | 1.2 | 0.79 | - | - | 0.75 | 0.28 | 1.01 | 0.97 | 1.23 | |
| Homestead land | 0.21 | 0.11 | 0.23 | 0.15 | 0.21 | 0.06 | 0.29 | 0.12 | - | - | 0.25 | 0.23 | 0.11 | 0.65 | ||
| Grazing land | - | - | - | - | - | - | 0.5 | 0.24 | - | - | - | - | 0.5 | 0.2 | ||
| Rented in land | 1.9 | 2.3 | 0.65 | 0.38 | 0.82 | 0.65 | 1.5 | 0.61 | - | - | 1 | - | 1.1 | 1.13 | 1.22 | |
| Rented out land | - | - | - | - | - | - | - | - | - | - | - | - | ||||
| Shared in land | 1 | - | 1 | - | 0.5 | - | 1.45 | 0.71 | - | - | 0.92 | 0.63 | 1.14 | 0.62 | 0.57 | |
| Shared out land | - | - | - | - | - | - | 0.25 | - | - | - | - | - | ||||
Table 4: Average land size of selected households in 2018.
Access of institutional services: Institutions play a significant role in promoting people’s participation in the supply of services and resources for human development, improving resource allocation and for ensuring effective public service delivery. The supporting function institutions are those who are not directly related to agricultural productions but provide different supports to the fishermen. Support service providers are essential for fishery sector developments and include sector specific input and equipment providers, financial services, extension service, and market information access and dissemination. In the study areas, there are many institutions supporting the agricultural sectors in one way or another. The most common support providers are Livestock and Fisher Resources Development Offices (LFRDO), District Trade and Market Development Office (DTMDO), IMX, Oromia micro finance institutions and agricultural research center.
Extension service: As depicted in Table 4, only 21.43% of the fishermen reported that they had access to extension service in 2018. About 78.57% of the fishermen reported that they had no access to extension service. The extension services providers were Batu fish and other aquatic life research center, livestock and fishers resource development experts and NGOs. The extension services provided were on water bodies’ management, fish production, net making and fish marketing (Table 4). According to survey results, the major problem related to extension service were lack of service provider nearby (94.48%), do not have a time to get service (2.56%) and possesses the required information about (1.71%) (Table 5).
| No. | Items | Frequency | Percent | |
|---|---|---|---|---|
| 1 | Access to extension services | Yes | 33 | 21.43 |
| No | 121 | 78.57 | ||
| Total | 154 | 100 | ||
| 2 | Problem related to obtain extension service | Lack of service provider nearby | 111 | 94.48 |
| Possessed the required information | 2 | 1.71 | ||
| Do not have time to get the service | 3 | 2.56 | ||
| Lack of interest of experts to give service | 1 | 0.85 | ||
| Total | 117 | 100 | ||
| 3 | Type of extension services provided for fishermen | Water bodies management | 10 | 31.25 |
| Fish production | 1 | 3.13 | ||
| Net making | 2 | 6.25 | ||
| Water bodies management, fish production, fish marketing and net making | 19 | 59.38 | ||
| Total | 32 | 100 | ||
Table 5: Fishermen access to extension services and problem related to extension service.
Access to credit service: Finance is the crucial element starting fish production and marketing. Fishermen mainly require credit to purchase fishing equipment's, i.e., gears, boats, refrigerator and others materials and also for family consumption. As depicted in Table 5, 24.03% of fishermen access for credit and 75.97% of fishermen reported that they have no access for credit service. The main institutions that provide credit for fishermen were micro-finance institution (Oromia Credits and Saving Share company (OCSSCO) (88.57%) and relatives/friends (5.72%). The main objectives households take of the credit were to purchase fertilizer, to purchase to purchase fishing equipments (60%) and family consumption and agricultural inputs. improved seeds/seedling and for family consumptions. The providers of credit services were micro finance institutions (88.57%), relatives/friends (5.72%) and fish traders (2.66%). The major problems farmers reported related to credit services were lack of service providers (73.17%), high loan interest rates (10.57%) and need collateral to take credits (8.13%) (Table 6).
| No | Items | Frequency | Percent | |
|---|---|---|---|---|
| 1 | Access to credit services | Yes | 37 | 24.03 |
| No | 117 | 75.97 | ||
| Total | 154 | 100 | ||
| 2 | Purpose of credit taken | Purchasing of fishing equipments | 21 | 60 |
| For family consumption | 2 | 5.71 | ||
| Purchase agricultural inputs | 6 | 17.14 | ||
| For both family consumption and purchase fishing equipments | 6 | 17.14 | ||
| Total | 35 | 100 | ||
| 3 | Source of credits | Micro finance institutions | 31 | 88.57 |
| Relatives/friends | 2 | 5.72 | ||
| Bank | 1 | 2.86 | ||
| Fish traders | 1 | 2.86 | ||
| Total | 35 | 100 | ||
| 4 | Problems related to credit services | High interest rate | 13 | 10.57 |
| Need collateral | 10 | 8.13 | ||
| Credit provider not give attention for fishery | 2 | 1.63 | ||
| Lack of service providers/lack of access | 90 | 73.17 | ||
| Lack of interest to take credit | 8 | 6.5 | ||
| Total | 123 | 100 | ||
Table 6: Access to credit service and problems of credits services of sampled households.
Livelihood activities of fishermen
Crop production: It is clear that crop production pattern of an area depends mainly on agro-ecology factors namely climate, soil types, crops types, community crop production habit and also marketing factors. According to survey results, maize, teff, wheat and sorghum were the major crops farmers produce for consumption and source of cash in line with fishing activities (Table 7).
| Variables | Site 1 | Site 2 | Site 3 | Site 4 | Site 5 | Site 6 | Total | ||||||||
|---|---|---|---|---|---|---|---|---|---|---|---|---|---|---|---|
| Freq | % | Freq | % | Freq | % | Freq | % | Freq | % | Freq | % | Freq | % | ||
| Maize | Yes | 4 | 10.81 | 20 | 95.24 | 19 | 43.18 | 12 | 63.16 | 0 | 0 | 10 | 50 | 65 | 42.21 |
| No | 33 | 89.19 | 1 | 4.76 | 25 | 56.82 | 7 | 36.84 | 13 | 100 | 10 | 50 | 89 | 57.79 | |
| Teff | Yes | 14 | 37.84 | 7 | 33.33 | 11 | 25 | 14 | 73.68 | 0 | 0 | 6 | 30 | 52 | 33.77 |
| No | 23 | 62.16 | 14 | 66.67 | 33 | 75 | 5 | 26.32 | 13 | 100 | 14 | 70 | 102 | 66.23 | |
| Wheat | Yes | 3 | 8.11 | 7 | 33.33 | 10 | 22.73 | 1 | 5.26 | 0 | 0 | 1 | 5 | 22 | 14.29 |
| No | 34 | 91.89 | 14 | 66.67 | 34 | 77.27 | 18 | 94.74 | 13 | 100 | 19 | 95 | 132 | 85.71 | |
| Sorghum | Yes | 0 | 0 | 3 | 14.29 | 0 | 0 | 0 | 0 | 0 | 0 | 3 | 15 | 6 | 3.9 |
| No | 37 | 100 | 18 | 85.71 | 47 | 97.92 | 19 | 100 | 13 | 100 | 17 | 85 | 148 | 96.1 | |
Table 7: Major crop produced by selected fishermen in selected study area.
Livestock production of fishermen: Livestock plays significant role in the economy of the fishermen in the studies area. In general they provide food (milk, meat, egg, hides and skin) as power for cultivation, serve as means of transportation, and manure production for soil fertility management and as saving. Farmers' kept livestock for food, cash, draught power and manure production and used as a source of income to purchase fishing equipments. In terms of population of livestock fishermen organized at Fincha, Koka and Gilge-Gibe are higher compared to fishermen organized at others selected water bodies. As indicated in Table 7, on average about 1.97 oxen were holds by sampled households in study area. On average fishermen have 2.61 local cows. Goats and sheep are also kept by fishermen to meet the need of money and source of meat for home consumption (Table 8).
| Variables | Site 1 | Site 2 | Site 3 | Site 4 | Site 5 | Site 6 | Total | Chi-square | ||||||||
|---|---|---|---|---|---|---|---|---|---|---|---|---|---|---|---|---|
| Freq | % | Freq | % | Freq | % | Freq | % | Freq | % | Freq | % | Freq | % | |||
| Livestock owned | Yes | 20 | 54.05 | 19 | 90.48 | 21 | 47.73 | 18 | 94.74 | 2 | 15 | 11 | 55 | 91 | 59.09 | 31.69*** |
| No | 17 | 45.95 | 2 | 9.52 | 23 | 52.27 | 1 | 5.26 | 11 | 85 | 9 | 45 | 63 | 40.91 | ||
| Total | 35 | 100 | 19 | 100 | 48 | 100 | 19 | 100 | 13 | 100 | 20 | 100 | 154 | 100 | ||
| Variable | Mea | SD | Mean | SD | Mean | SD | Mea | SD | Mean | SD | Mean | SD | Mean | SD | F-value | |
| Oxen | 1.83 | 0.83 | 2.06 | 0.99 | 2.25 | 1.34 | 2 | 1.09 | NA | NA | 1.58 | 0.51 | 1.97 | 1.01 | 0.82 | |
| Cows | 2.77 | 1.92 | 3.29 | 1.65 | 2.41 | 1.33 | 2.33 | 1.39 | NA | NA | 1.66 | 0.81 | 2.61 | 1.53 | 1.71 | |
| Heifer | 2 | 1.41 | 1.55 | 0.73 | 1.92 | 1.04 | 2.45 | 1.69 | NA | NA | 1.33 | 0.57 | 1.95 | 1.23 | 0.87 | |
| Calf | 4.5 | 2.12 | 2.71 | 1.11 | 1.36 | 0.5 | 2.2 | 1.69 | NA | NA | 1.33 | 0.57 | 2.05 | 4.51*** | ||
| Goat | 6.75 | 4.27 | 7.41 | 5.66 | 3.25 | 2.37 | 2.77 | 1.71 | NA | NA | 1.4 | 0.54 | 4.61 | 4.24 | 2.96** | |
| Sheep | 7.33 | 3.05 | 6.5 | 6.36 | 6.33 | 4.41 | 2.57 | 1.72 | NA | NA | 1.5 | 0.71 | 4.79 | 3.86 | 1.71 | |
| Horse | - | - | - | - | 1 | - | 1.6 | 0.54 | NA | NA | NA | 1.5 | 0.54 | 1 | ||
| Mule | - | - | - | - | 1 | - | 1.5 | 0.71 | NA | NA | NA | 1.33 | 0.57 | 0.33 | ||
| Donkey | 2.14 | 2.19 | 2 | 1.31 | 1.5 | 1.07 | 2.37 | 1.06 | NA | NA | 1.66 | 0.57 | 1.97 | 1.35 | 0.45 | |
| Poultry | 13.7 | 13.78 | 2 | - | 9.5 | 8.84 | 6.14 | 3.32 | 11 | 5.6 | 3.8 | 1.09 | 8.38 | 8.18 | 1.4 | |
Table 8: Livestock population and purpose of rearing in selected districts.
Fishing activities: Fish serves as a source of human diet and source of income for fishermen cooperative organized in selected water bodies of Oromia region. The importance of fishing in terms of economics, food security and employment opportunity for people lives near lakes and reservoirs are enormous. Artisanal or non-motorized fishery is one of the most significant economic activities in the studies area. Fishery is practiced in a traditional way and tools as past time activity.
Season of fishing activities: Fishing activity is seasonal and the supply of fish is mostly available during fasting time. As indicated in Table 7, about 57.14% of fishermen were involved in fishing activities year round. The primarily livelihood of those fishermen involved in fishing activity was catches fish year round. Besides, about 24.04 percent of selected fishermen were involved on fishing activities during fasting time. Peak of fishing is during the fasting months (February, March, April and August) when meat markets are dwindling (Table 9).
| Variables | Site 1 | Site 2 | Site 3 | Site 4 | Site 5 | Site 6 | Total | Chi-square |
|---|---|---|---|---|---|---|---|---|
| Freq (%) | Freq (%) | Freq (%) | Freq (%) | Freq (%) | Freq (%) | Freq (%) | 150.5**** | |
| Year round | 27 (72.97) | 10 (47.62) | 32 (72.73) | 1 (5.26) | 13 (100) | 5 (25) | 88 (57.14) | |
| During fasting time | 7 (18.92) | 2 (9.52) | 9 (20.45) | 15 (78.96) | 0 | 2 (10) | 37 (24.03) | |
| September-April | 2 (5.40) | 7 (33.33) | 3 (6.82) | 1 (5.26) | 0 | 3 (15) | 14 (9.09) | |
| January-May | 1 (2.70) | 2 (9.52) | 0 | 2 (10.52) | 0 | 10 (50) | 15 (9.74) | |
| Total | 37 (100) | 21 (100) | 44 (100) | 19 (100) | 13 (100) | 20 (100) | 154 (100) |
Table 9: Time of fishing activities in selected water bodies of Oromia region.
Fishery cooperative
Currently the majority of fishermen have been organized into fishermen cooperatives, in line with the policy of the government. The ministry of agriculture has granted commercial fishing rights only to fishermen cooperatives, each of which has to pay in return for the privilege of exploiting the lake resource. According to the survey results, there were 34 fishery cooperatives on selected water bodies of Oromia region. Of these 34 fishery cooperatives, 18 were selected for this research and name of those cooperatives are indicated in Table 8 below.
As indicated in Table 8, financial capital of fishermen cooperative is less than 100,000 Birr expect Melka koffe fishermen cooperative and Zeway Batu fishermen cooperative which 140,00 Birr and 100,000 Birr, respectively. Total numbers of boat of cooperative in Zeway Lake and Koka reservoir are high compared to other water bodies (Table 8). Currently, fishers’ cooperatives exist in most fisheries but they are generally weak. The cooperatives have bylaws and these could be developed to cover fisheries management issues considering that cooperatives have the potential to participate in co-management arrangements with government provided that they are strengthened. Fishermen cooperative activities are coordinated by a governing board including a chairman, a vice-chairman, a secretary and a treasurer elected by the cooperative members, who manages the cooperative according to the annual plan approved by its general assembly (Table 10).
| No | Zone | Selected water bodies | Name of fishermen cooperative | Total cash of fishermen cooperative | Total boats of fishermen cooperative | Total gears of fishermen cooperative |
|---|---|---|---|---|---|---|
| 1 | Horro guduru | Fincha | Abdi boru fishermen cooperative | 26000 | 3 | 6 |
| Gudatu diga fishermen cooperative | 32000 | 5 | 3 | |||
| Oda giregna fishermen cooperative | - | - | - | |||
| 2 | Jimma | Gilgel-Gibe | Gurmu kanisa fishermen cooperative | 10000 | 4 | 12 |
| Gudata bula fishermen cooperative | 27000 | 12 | 50 | |||
| 3 | Arsi | Koka | Gora hadha degaga and arara fishermen cooperative | 75000 | 30 | 40 |
| East Shoa | Derara fishermen cooperative | 50000 | 40 | 30 | ||
| Koka negawo fishermen cooperative | 48000 | - | - | |||
| Mali bari fishermen cooperative | 30000 | 24 | 24 | |||
| Zeway | Abosa fishermen cooperative | 14000 | 5 | 5 | ||
| Melka fesasa fishermen cooperative | 32000 | - | - | |||
| Melka koffe fishermen cooperative | 1 E+05 | 25 | 25 | |||
| Meki denbel fishermen cooperative | 10000 | 26 | 26 | |||
| Zeway batu fishermen cooperative | 1 E+05 | 73 | 135 | |||
| Langano | Oyitu langano fishermen cooperative | 20000 | 30 | 30 | ||
| Beseka | Beseka fishermen cooperative | 6000 | - | - | ||
| 4 | West Arsi | Langano | Langano fishermen cooperative | 80000 | 60 | 60 |
| Keraro eddo mindaye fishermen cooperative | 75000 | 12 | 12 |
Table 10: Name and number of fishing technologies of selected cooperatives.
Type of fishing equipments used for fishing activities
According to survey results steel boat, wooden boat and yebela/ bofofe were the major types of boats fishermen was used for fish catch at selected water bodies. Most fishers operate with basic rafts made of papyrus or scirpus. Wooden boats are also the major boats fishermen used for fishing purpose on selected water bodies. Motorized boat is found on lake Zeway and Fincha reservior. Motorized boat in lake Zeway where there are mostly used for fish collection and transport purpose. In case of Fincha reservior steel boat was supplied for fishermen by nongovernment organization (fish for all). Average purchase price of steel boat was 49,571.43 Birr which is so expensive for fishermen to purchase. On average fishermen holds 1.07 wooden boat and purchase price or preparation cost was 6,222.35 Birr.
Gears in use include gillnets, beach seines and hook/long-line on selected water bodies. The use of gillnets and hook gear is widespread in the selected water bodies, whilst beach seines are principally used on Koka reservior, lakes Zeway and Langano. On average fishermen hold 1.33, 5.56 and 4.98 number of beach seines, gillnet and hook/long line, respectively (Table 11).
| Type of boat/gear (No) | Site 1 | Site 2 | Site 3 | Site 4 | Site 5 | Site 6 | Total | F-value | |||||||
|---|---|---|---|---|---|---|---|---|---|---|---|---|---|---|---|
| Mean | SD | Mean | SD | Mean | SD | Mean | SD | Mean | SD | Mean | SD | Mean | SD | ||
| Steel boat | 1.5 | 0.77 | - | - | - | 1 | - | - | - | 1.11 | 0.33 | 5.44 | |||
| Wooden boat | 1.08 | 0.28 | 1 | 1.2 | 0.4 | - | 1 | 1 | 1.07 | 0.25 | 7.59 | ||||
| Yebela/Bofofe boat | 1 | - | - | - | 1 | - | - | - | - | - | 1 | 0 | - | ||
| Beach seine | 2 | 1.63 | 1.12 | 0.48 | 1 | 1 | - | - | - | 1.33 | 1.01 | 3.90 | |||
| Gillnet(50 m) | 12.77 | 31.8 | 1 | 2.59 | 2.59 | 1 | 4.27 | 1.9 | 5.56 | 18.22 | 1.04 | ||||
| Hook/long line (by 100) | 26.5 | 33.2 | - | - | 3.62 | 2.19 | 1 | - | 4.28 | 2.22 | 2 | - | 4.98 | 8.11 | 6 |
Table 11: Type of fishing equipments fishermen holds.
Fish production and experience
As indicated in Figure 1, the majority of fishermen experience involved in cooperative are less than 20 years on selected water bodies. In case of lakes Zeway, Langano and Beseka fishermen involvement in one cooperative goes until forty years. Whereas in case of Koka, Fincha and Gilgel-Gibe reservior fishermen responded that experience involved in one cooperative were less than 20 years (Figure 1).

Figure 1: Average experience of fishermen in fishermen cooperative.
Fish catch
The estimated mean catch per day in kg was summarized in Figure 2 by selected water bodies. As indicated in Figure 2, the majority of fishermen in selected water bodies respond that average fish catch was less than 10 kg per day. Langano lake and Fincha reservior fishermen respond that they obtain average fish catch above 50 kg per day. Fluctuations of fish yield are there in all selected water bodies due to different internal and external factors. According to focus group discussion the yield of fish especially in rift valley area was decreasing from time to time due to overfishing, expansion of small size fish nets which is not recommended, climate change and etc. (Figure 2).

Figure 2: Average fish catch per day (kg) by fishermen.
Fish species
The main commercial fish species at Koka reservior, Langano and Zeway lakes are Nile Tilapia, African catfish, common carp and curcian carp whereas in Fincha and Gilgel-Gibe reservior Nile tilapia and common carp are important commercial fish species. In the case of Beseka fishermen use only African catfish as a commercial fish (Figure 3). According to survey results catch proportion varied among species in different water bodies. For instance, the catch of Nile Tilapia and common carp in Langano lake and Fincha reservior are above 10 kg per day. While all species in case of Lake Zeway, Lake Beseka, Gilgel Gibe and Koka reservior fish catch per day were less than 10 kg per day (Figure 3).

Figure 3: Yield of fish species in selected water bodies of Oromia region.
Purpose of fishing in selected water bodies
As indicated in Table 10, fishermen involved in fishing activities for source of income by selling fish and for family consumption to fulfill their children balanced diet. In terms of acceptance in the market Nile Tilapia species is the important species in the case of Koka reservior, lake Langano, lake Zeway, Fincha reservior and Gilgel-Gibe reservior. However, in case of Beseka lake African catfish commercial accepted species. According to focus group discussion catch of Nile Tilapia species was decreasing from time to time due to overfishing while catch of common carp and catfish were increasing (Table 12).
| Purpose of fishing | Site 1 | Site 2 | Site 3 | Site 4 | Site 5 | Site 6 | Total | ||||||||
|---|---|---|---|---|---|---|---|---|---|---|---|---|---|---|---|
| Freq | % | Freq | % | Freq | % | Freq | % | Freq | % | Freq | % | Freq | % | ||
| N.Tilapia | Sale/income source | 6 | 17.65 | 1 | 4.76 | 2 | 4.65 | 3 | 15.79 | - | - | - | - | 12 | 8.7 |
| Consumption | 0 | 0 | - | - | - | - | - | - | - | - | - | ||||
| Both | 28 | 82.35 | 20 | 95.24 | 41 | 95.35 | 16 | 84.21 | - | - | 19 | 100 | 126 | 91.3 | |
| African catfish | Sale/income source | 16 | 45.71 | 3 | 14.29 | 11 | 25.58 | - | - | 2 | 15 | - | - | 33 | 25.58 |
| Consumption | - | - | - | - | - | - | - | - | - | - | |||||
| Both | 19 | 54.29 | 18 | 85.71 | 32 | 74.42 | - | - | 11 | 85 | 15 | 100 | 96 | 74.42 | |
| Common carp | Sale/income source | 9 | 25.71 | 2 | 10 | 5 | 12.2 | 5 | 26.32 | - | - | - | - | 21 | 27.65 |
| Consumption | - | - | 3 | 15 | - | - | - | - | - | - | - | - | 3 | 2.52 | |
| Both | 26 | 74.29 | 4 | 75 | 36 | 87.8 | 14 | 73.68 | - | - | 4 | 100 | 95 | 79.83 | |
| Curcian carp | Sale/income source | 5 | 45.45 | 3 | 42.86 | 9 | 26.47 | - | - | - | - | - | - | 16 | 29.09 |
| Consumption | 3 | 27.27 | 2 | 28.57 | 6 | 17.65 | - | - | - | - | - | - | 23 | 23.64 | |
| Both | 3 | 27.27 | 2 | 28.57 | 19 | 55.88 | - | - | - | - | - | - | 26 | 47.27 | |
| Rank in commercially accepted fish species | 1. N.Tilapia | 1. N.Tilapia | 1. N.Tilapia | 1. N.Tilapia | 1.Catfish | 1. N.Tilapia | |||||||||
| 2. A.Catfish | 2. A. Catfish | 2. Common Carp | 2. A.Catfish | 2. A.Catfish | |||||||||||
Table 12: Type of fish species and purpose of fishing.
Saving practice of fishermen at selected water bodies
According to survey results, about 144 (93.51%) of respondents have saving practice as a cooperative from selling of fish. Amount of saving as a cooperative is different from site to site which was depending on bylaws of cooperatives. From total 154 respondents, only 95 (61.69%) of respondents have practices saving individually. In addition, most households prefer to save money in cash than asset. With regard to institution fishermen saving 76 (80%) of respondents reported that they have saved their money in formal institution and 13 (13.68%) and 6 (6.32%) percent of respondents reported that they have save their money in informal institution (Ikub) and at home own box (Table 11). As depicted in Table 11, among those who have practiced saving their time pattern, 46.88 percent saving time pattern was at any time when income generated, followed by once in week (19.79%) and every day (17.71%) (Table 13).
| Saving practice | Site 1 | Site 2 | Site 3 | Site 4 | Site 5 | Site 6 | Total | Chi-square | ||||||||
|---|---|---|---|---|---|---|---|---|---|---|---|---|---|---|---|---|
| Freq | % | Freq | % | Freq | % | Freq | % | Freq | % | Freq | % | Freq | % | |||
| Saving practice of fishermen as a cooperative | Yes | 36 | 97.3 | 18 | 85.71 | 40 | 90.91 | 18 | 94.74 | 13 | 100 | 19 | 95 | 144 | 93.51 | 4.48 |
| No | 1 | 2.7 | 3 | 14.29 | 4 | 9.09 | 1 | 5.26 | 0 | 1 | 5 | 10 | 6.49 | |||
| Fishermen saving practice as individual | Yes | 26 | 70.27 | 19 | 90.48 | 24 | 54.55 | 7 | 36.84 | 7 | 54 | 12 | 60 | 95 | 61.69 | 14.79** |
| No | 11 | 29.73 | 2 | 9.52 | 20 | 45.45 | 12 | 63.16 | 6 | 46 | 8 | 40 | 59 | 38.31 | ||
| Institution choice in saving their money | Formal institution (bank) | 17 | 65.38 | 19 | 100 | 17 | 70.83 | 7 | 100 | 7 | 100 | 8 | 66.7 | 76 | 80 | 32.00*** |
| Informal institution (Ikub) | 3 | 11.54 | - | - | 6 | 25 | - | - | - | - | 4 | 33.3 | 13 | 13.68 | ||
| At home (own box) | 6 | 23.08 | - | - | 1 | 4.17 | - | - | - | - | - | - | 6 | 6.32 | ||
| Mechanism of saving | Cash | 26 | 100 | 14 | 73.68 | 22 | 91.67 | 7 | 87.5 | 6 | 86 | 10 | 83.3 | 85 | 88.54 | 22.27** |
| Asset | - | - | - | - | - | - | - | - | 1 | 14 | - | - | 1 | 1.04 | ||
| Both | - | - | 12 | 26.32 | 2 | 8.33 | 1 | 12.5 | - | - | 2 | 16.7 | 10 | 10.42 | ||
| Time interval fishermen saving their money | Every day | 6 | 23.08 | 1 | 5.26 | 5 | 20.83 | 1 | - | 1 | 14 | 3 | 25 | 17 | 17.71 | |
| Once in a week | 4 | 15.38 | 4 | 21.05 | 8 | 33.33 | 14.29 | 1 | 14 | 1 | 8.33 | 19 | 19.79 | |||
| Once in the month | 7 | 26.92 | 2 | 10.53 | 1 | 4.17 | 1 | 14.29 | - | - | 4 | 33.3 | 15 | 15.63 | ||
| At any time when income generated | 9 | 34.62 | 12 | 63.16 | 10 | 41.67 | 5 | 71.43 | 5 | 71 | 4 | 33.3 | 45 | 46.88 | ||
Table 13: Saving practice of fishermen at selected water bodies of Oromia region.
Econometric results
Twelve explanatory variables were considered in the econometric model out of which five variables were found to be significant determinants of the sample households saving practice. Econometric tobit analysis has shown that family size of household, access of fishing equipment, number of tropical livestock unit, income from farming activities and access of credit for household also significant determinants at saving decision of household. As shown in the Table 12, family size has statistically significant at 5% and positive effect on the decision to save. This is because as family size increases, households are expected to allocate more labor for fishing activities and thus there will be more income generated and left for saving. As family adult equivalent increase by one unit, probability of household saving increases by about 8.1%. Holding all other variables constant. This finding is contradicted with who found that family size significantly and inversely affecting household saving.
The number of tropical livestock unit of household has positively and significantly related to household saving at 1 percent. As tropical livestock unit of household increases by one unit it will result probability household savings increase by 80.3 percent. The result of the tobit model indicated that sample households who had large livestock unit have high saving capacities. This is an implication that irrespective of bigger number of livestock one cannot easily increase fish production because livestock is an indicator of economic wealth and place for fishing activities in purchasing fishing equipments. Another possible explanation for the positive coefficient of the number of livestock may be due to the reason that, when number of livestock increases the need for more improved fishing technologies, which requires the need for additional capital and this increases demand for previous savings. The findings of the study agree Degu with shows positive and significant relationship between households saving and livestock ownership.
Availability of own fishing equipments (gears and boats) positively and significantly determines household saving at 1 percent. The result of the tobit model indicated, when access to own fishing equipments change from “no access” to “own fishing equipments access” probability of saving increases at about 87.7 percent. This is because fishermen who are own fishing equipments catch more fish and spent more time on fishing activities and it will result in an increased household saving. Another possible explanation for the positive coefficient of availability of own fishing equipments may be due to the reason that, when fishermen own fishing equipments fee cost paid for rent of fishing equipments will reduce and as a result probability of saving increases.
In this study it was found out that credit has a significant positive effect on savings of fishermen. Availability of credit service positively and significantly determines household saving. Holding other variables constant, when access to credit change from “no access” to “credit access” probability of saving increases at about 49.6 percent. The result was due to the fact that access to credit can increase an opportunity to invest and participate in different income generating activity which can enhance income and saving level at the same time. This finding is in line with which confirm that access of credit positive and significantly influence saving decision of households. This result is also concurring the research hypothesis and the finding of Abdelkhalek et al.
In this study annual income of the household from farming was positively related and coefficient is significantly different at 5 percent level. Other things remain constant, as annual farm income of the household increases by a unit, the probability of household decision for saving increases by/at about 70.9 percent. This is due to the fact that when income from farming increases households’ tendency to save increase it means as income increase proportion of income saved also increases which are because share of income consumed decreases. The results agreed with a study conducted in Gamo Gofa zone which shows that a statistically significant relationship between income and savings decision of households (Table 14).
| Variable | Coef. | Robust Std. Err | Marginal effects (dy/dx) | Std.Err |
|---|---|---|---|---|
| Age of household head | -0.165 | 0.02 | -0.17 | 0.02 |
| Marital status of household | -0.156 | 0.25 | -0.16 | 0.25 |
| Education level of household | 0.135 | 0.1 | 0.135 | 0.1 |
| Family size of household | 0.081** | 0.04 | 0.081** | 0.04 |
| Number of livestock household owned | 0.803*** | 0.22 | 0.803*** | 0.22 |
| Fishing experience of household | 0.023 | 0.02 | 0.023 | 0.02 |
| Average fish caught per day | -0.001 | 0 | -0 | 0 |
| Access of own fishing equipment | 0.877*** | 0.27 | 0.877*** | 0.27 |
| Access of extension service | -0.174 | 0.24 | -0.17 | 0.24 |
| Access of credit access of household | 0.496* | 0.25 | 0.496* | 0.25 |
| Annual Income of household from farming | 0.709** | 0.31 | 0.709** | 0.31 |
| Own transport service of household | -0.232 | 0.23 | -0.23 | 0.23 |
| Constant | -3.101** | 1.22 |
Dependent variable: saving decision (save =1/0)
***Significant at 1%,
**Significant at 5%,
*Significant at 10%.
Table 14: Estimation of tobit model for factors affecting fishermen saving decision.
Role of women in fishing activity
According to survey results 35.71 percent of respondent reported that women were a member of fishery cooperative (Table 13). Besides, 64.05 percent of respondent reported that women have the role in decision making of fishery cooperative. Female members of the fishing cooperative participate in processing and selling activities than fishing. In fisheries, men and women often have distinct roles. At selected water bodies fishery only men go out to fish, but women are often involved in marketing and post-harvest processing. In general, women’s participation in the fishery sector is restricted especially; fishing is unthinkable because nature of fishing activities is difficult for female. Post-harvest processing, preparing food, shopping and cooking are the main tasks of women in fishery cooperative in the study area (Table 15).
| Variable | Site 1 | Site 2 | Site 3 | Site 4 | Site 5 | Site 6 | Total | ||||||||
|---|---|---|---|---|---|---|---|---|---|---|---|---|---|---|---|
| Freq | % | Freq | % | Freq | % | Freq | % | Freq | % | Freq | % | Freq | % | ||
| Is women a member of cooperative | Yes | 8 | 21.62 | 17 | 80.95 | 18 | 40.91 | 1 | 5.26 | 8 | 62 | 3 | 15 | 55 | 35.71 |
| No | 29 | 78.38 | 4 | 19.05 | 26 | 59.09 | 18 | 94.74 | 5 | 38 | 17 | 85 | 99 | 64.29 | |
| Total | 37 | 100 | 21 | 100 | 44 | 100 | 19 | 100 | 13 | 100 | 20 | 100 | 154 | 100 | |
| Is women have a role in decision making of a fishery cooperative | Yes | 18 | 50 | 17 | 80.95 | 25 | 56.82 | 13 | 68.42 | 9 | 69 | 16 | 80 | 98 | 64.05 |
| No | 18 | 50 | 4 | 19.05 | 19 | 43.18 | 6 | 31.58 | 4 | 31 | 4 | 20 | 55 | 35.95 | |
| Total | 36 | 100 | 100 | 44 | 100 | 19 | 100 | 13 | 100 | 20 | 100 | 154 | 100 | ||
Table 15: Women role in fishery cooperative at selected water bodies.
The major constraints of fishery sector at selected water bodies of Oromia region
Farmers operating in fishing have many constraints. As depicted in Table 14, the major existing production constraints that hinder fish production were lack of improved fishing technologies, low fish yield, low price of fish, expansion of illegal fishermen and traders, overexploitation of fish stock, transportation problem, lack of market access and market place, low demand for fish consumption, low awareness in fish production and consumption, fishery regulation problem, theft problem (stolen of fishing equipments), lakes/reservior pollution due to chemical inflows, climate change, Water hyacinth problem and lack of support for this sector from governments and NGOs. The fishermen were interviewed to rank them according to their importance: Accordingly, expansion of illegal fishermen was ranked as the first most important constraint while fishery regulation problem was ranked as the least observed constraint at Koka reservior (Table 14). In case of lake Langano fishermen responded that lack of market access and market place as first important constraints followed by fishery regulation problem (poor lake management) while in case of Zeway lake first ranked constraint was fishery regulation problem followed by expansion of illegal fishermen and traders. But the rank of constraints at Fincha reservior, lake Beseka and Gilgel-Gibe reservior were different from others three i.e. at three of them, the respondents’ ranked lack of improved fishing equipments as the first most important constraint. In general, the three top ranked problem of fishing activities in selected water bodies were expansion of illegal fishermen, lack of improved fishing technologies and fishery regulation problem. This research is in line with the finding of Hussien in which lack of transportation facilities, proper fishing gears; they all use hook for fishing, poor post-harvest handling, low price of fish as a result of low bargaining power of producers, lack of proper fish processing and storage facilities, poor extension service, lack of awareness, poor culture of eating fish, lack of permanent fish market places (shops) are the main fish production constraints in Afar region (Table 16).
| Major Constraints | Yes/No | Site 1 | Site 2 | Site 3 | Site 4 | Site 5 | Site 6 | Total | |||||||
|---|---|---|---|---|---|---|---|---|---|---|---|---|---|---|---|
| Freq | % | Freq | % | Freq | % | Freq | % | Freq | % | Freq | % | Freq | % | ||
| Lack of improved fishing technologies | Yes | 17 | 45.95 | 11 | 52.38 | 28 | 63.64 | 17 | 89.47 | 13 | 100 | 20 | 100 | 106 | 68.83 |
| Low yield/fish caught per day | Yes | 15 | 40.54 | 8 | 38.1 | 32 | 72.73 | 12 | 63.16 | 6 | 46 | 14 | 70 | 87 | 56.49 |
| Low selling price of fish | Yes | 18 | 48.65 | 15 | 71.43 | 12 | 27.27 | 16 | 84.21 | 8 | 62 | 13 | 65 | 82 | 53.35 |
| Expansion of illegal fishermen | Yes | 28 | 75.68 | 17 | 80.95 | 43 | 97.73 | 7 | 36.84 | 3 | 23 | 11 | 57.9 | 109 | 71.24 |
| Overexploitation of fish stock | Yes | 9 | 24.32 | 8 | 38.1 | 36 | 81.82 | 10 | 52.63 | - | - | 11 | 55 | 74 | 48.05 |
| Transportation problem | Yes | 10 | 27.03 | 7 | 33.33 | 1 | 2.27 | 13 | 68.42 | 10 | 77 | 8 | 40 | 49 | 31.82 |
| Lack of market access and market place | Yes | 19 | 51.35 | 20 | 95.24 | 12 | 27.27 | 16 | 84.21 | 9 | 69 | 11 | 55 | 87 | 56.49 |
| Low demand for fish consumption | Yes | 2 | 5.41 | 4 | 19.05 | 1 | 2.27 | 4 | 21.05 | 1 | 7.7 | 4 | 20 | 16 | 10.39 |
| Lack of awareness in fish production and consumption | Yes | 4 | 10.81 | 6 | 28.57 | 5 | 11.36 | 2 | 10.53 | 4 | 31 | 1 | 5 | 22 | 14.29 |
| Fishery regulation problem | Yes | 28 | 75.68 | 18 | 85.71 | 44 | 100 | 2 | 20.53 | 3 | 23 | 7 | 35 | 102 | 66.23 |
| Theft problem | Yes | 12 | 32.43 | 1 | 4.76 | 3 | 6.82 | 1 | 5.26 | - | - | 9 | 45 | 26 | 16.88 |
| Water pollution due to chemical inflow to lake/ reservior | Yes | 8 | 21.62 | 3 | 14.29 | 32 | 72.73 | - | - | - | - | 1 | 5 | 44 | 28.57 |
| Climate change | Yes | 16 | 43.24 | 6 | 30 | 34 | 77.27 | - | - | 1 | 7.7 | 3 | 15 | 60 | 29.22 |
| Water hyacinth problem | Yes | 8 | 21.62 | - | - | 4 | 9.09 | - | - | - | - | 1 | 5 | 13 | 8.5 |
| Rank of the main | 1st | Expansion of illegal fishermen | Lack of market access and market place | Fishery regulation problem | Lack of improved fishing technologies | Lack of improved fishing technologies | Lack of improved fishing technologies | Expansion of illegal fishermen | |||||||
| problem | 1st | Fishery regulation problem | Fishery regulation problem | Expansion of illegal fishermen | Low selling price of fish | Transportation problem | Low yield/fish caught per day | Lack of improved fishing technologies | |||||||
| 3rd | Lack of market access and market place | Expansion of illegal fishermen | Overexploitation of fish stock | Lack of market access and market place | Lack of market access and market place | Low selling price of fish | Fishery regulation problem | ||||||||
Table 16: The major constraints of fishermen in selected water bodies.
This study was conducted in East Shoa zone at Zeway lake, Koka reservior and Beseka lake fishery cooperative, West Arsi zone at Langano lake fishery cooperative, Horro Guduru Wollega Zone at Fincha reservoir fishery cooperative and Jimma zone at Gilgel- Gibe reservoir fishery cooperative in 2018. The objectives of this study are to assess the current status and performance of fishery cooperatives, to assess factors that affect saving practice of fishermen, to assess role of women in fishery cooperative, to identify the major challenges of fishermen in selected water bodies. To address the objectives of the study, both quantitative and qualitative method were used to collect the data from primary and secondary sources using structured questionnaires, key informants interview, focus group discussion and reviewing relevant literatures. The study used a three-stage sampling procedure in which three lakes and three reservoirs were selected purposively and then, fishery cooperatives were selected purposively. At third stage simple random sampling technique applied to select the sample respondents in proportion to size. Descriptive statistical tools such as frequency, %, mean, and standard deviation were used to analyze the quantitative data and documents analysis and focus group discussion used. The results for sex and marital status shows that majority of 151 (98.05%), 126 (61.69) and 95 (81.82) of the respondents were male, married and attend primary education respectively. As far as the sociodemographic characteristics of the respondents is concerned, the results reveal that the family size, average age, and fishing experience of the respondents were 5.46, 34.39 and 13.62 with the standard deviation of 9.85, 11.04 and 3.58 respectively. According to this study, Nile tilapia, catfish, common carp and crucian carp were the commercial fish species at selected water bodies. The major constraints that affect fishermen were lack of improved fishing technologies, low fish yield, low price of fish, expansion of illegal fishermen and traders, overexploitation of fish stock, transportation problem, lack of market access and market place, low demand for fish consumption, low awareness in fish production and consumption, fishery regulation problem, theft problem (stolen of fishing equipments), lakes/reservoir pollution due to chemical inflows, climate change, water hyacinth problem and lack of support for this sector from governments and NGOs. With regard to extension service, 33 (21.43%) of them did get extension service since 2018. Again the results of the study show that 37 (24.03%) of the respondents have access to credit service respectively.
Results of the tobit model applied in this study reveal that family size of household, access of fishing equipment, number livestock unit, credit access of household and annual income from farming of household are significant determinants of saving decision.
Based on the results of the study the following points are recommended:
• The current pressure on the lakes/reservoirs threatens sustainability of the fishery and hence management system of the lakes/reservoirs should be addressed though sustainable management of the lakes/reservoirs watershed.
• Woreda level livestock and cooperative offices should be conduct fish stock assessment before organizing any new fishery cooperatives in the lakes/reservoirs in the study area.
• Rights and responsibilities should be bestowed on fishing communities to restore, protect and manage local aquatic and coastal ecosystems on water bodies.
• Government agencies should create enabling legislation and policy framework that would separate fisheries cooperatives members with unorganized fishermen that would alleviate cheating gears or catch fish and conflict between members and fishermen.
• Policies for alternative markets, credit and income source, and with members can help empower fisheries cooperatives.
• Accessibility of fishing technologies should be improved through strengthen both public and private partnership involved in disseminating and supporting fishing communities.
• Accommodative credit policy should be employed; meaning that MFIs and other development agencies need to introduce credit policies targeting low income fisheries communities.
• To improve women in fishing activities and saving practices emphasis should be given for women by improving in access to boats/gear, equipment and markets through providing credits services.
• To improve the saving behavior of fishermen in the study areas, the households should able to avoid negative personal saving habits that may impair its saving behavior and adopt good saving practices even at small amount of income.
• Finally, it is recommended that the government and other concerned bodies should provide capacity building training on awareness, culture and attitude of saving to boost the level of fishermen saving.
Citation: Hailu A, Abebe A (2023) Assessment of Current Status of Fishermen Cooperatives at Selected Oromia Water Bodies, Ethiopia. Fish Aqua J. 14:315.
Received: 02-Jan-2023, Manuscript No. FAJ-23-20101; Editor assigned: 03-Jan-2023, Pre QC No. FAJ-23-20101 (PQ); Reviewed: 18-Jan-2023, QC No. FAJ-23-20101; Revised: 25-Jan-2023, Manuscript No. FAJ-23-20101 (R); Published: 31-Jan-2023 , DOI: 10.35248/2150-3508.23.14.315
Copyright: © 2023 Hailu A, et al. This is an open-access article distributed under the terms of the Creative Commons Attribution License, which permits unrestricted use, distribution, and reproduction in any medium, provided the original author and source are credited.