Journal of Fertilization: In Vitro - IVF-Worldwide, Reproductive Medicine, Genetics & Stem Cell Biol
Open Access
ISSN: 2375-4508
ISSN: 2375-4508
Editorial - (2011) Volume 1, Issue 1
Background: Meiosis 1 errors are believed to be the largest single cause of clinical embryo failure and early miscarriage. Following the failure of FISH technology and concerns over embryo mosaicism, our aim was to assess paired chromosome status and error rates, and predict oocyte aneuploidy using the metaphase2 polar body with a novel Array CGH platform as a means to select embryos for couples with multiple IVF failures.
Methods: The PB1 was removed from metaphase 2 oocytes using a laser-assisted breech of the zona pellucida to effect the biopsy. Reliable 23-paired chromosome analysis was obtained, and in time for fresh embryo transfer. It was a non- randomised investigation in patients seeking this technology as a result of previous multiples failures of IVF.
Results: 134 couples presented for 150 cycles of array CGH with a median age of 41.0. 861 polar bodies were evaluated, 67.4% and 32.6% were aneuploid and euploid, respectively. 19,803 paired chromosomes were analysed, 3.5% and 3.4% of chromosome errors resulted in either a gain or loss, respectively. There was a positive correlation between female age and aneuploidy, but no correlation with numbers oocytes harvested. 26% of cycles (n=39) failed to achieve embryo transfer (ET) as none of the oocytes were euploid. The live birth rate per ET and implantation was 24.1% and 27.7%, respectively, and 5.2% of chemical pregnancies (1.9% of transfers) resulted in a dizygotic multiple pregnancy.
Conclusion: Array CGH was proven to generate robust chromosome information. Chromosome segregation error rates were found to be inversely proportional to chromosome length and proportional to the G/C base content. Clinically, the transfer of a single embryo after PB 1 array CGH analysis appeared to generate improved implantation rates in women with very poor prognosis, whilst reducing the risk of a multiple pregnancy.
<Aneuploidy is the main cause of miscarriage and congenital birth defects, and is the most common chromosome abnormality in humans with at least 5% of all clinical pregnancies being of trisomy or monosomy origin [1]. Clinical assessment of in vivo conceived pregnancies over five decades has catalogued risk factors and aetiology in detail, with most apparently derived from errors in maternal meiosis 1 [1]. An IVF cycle, however, generates oocytes and products of conception - the zygote and preimplantation embryo - in far greater numbers than ovulation during the menstrual cycle, and it is believed that the incidence of aneuploidy after ovulation induction for IVF can be up to 50% of oocytes harvested [2,3].We are beginning to understand, through full chromosome copy number analysis, that anomalies related to embryos of poor 'quality', arrested embryos and transferred embryos that do not implant or result in a failed pregnancy, encompass a large and much broader range of aneuploidies than observed in the products of natural conception [4,5].
Preimplantation genetic screening (PGS) procedures using FISH (fluorescent in situ hybridization) are now regarded as redundant for improving live birth rates [6,7]. But, as the prevailing assumption remained - that the presence of chromosomal anomalies are a major cause of embryo failure, of which the majority derive from the oocyte - there was a need to develop a reliable technology to identify full chromosome copy number. This technology needed to provide dependable data within 48 h to support 'fresh' embryo transfer. With such technology meiotic errors (polar bodies 1 and 2), and errors in the embryo resulting from sperm aneuploidy or cleavage mitotic errors can be examined with confidence. In 2008 we were the first to undertake a study to assess the use of a new, robust and reproducible array CGH method to assess full 23 chromosome pair copy number and, when satisfied, applied this approach clinically in 'last resort' cases requesting this technology [8]. This approach of PB chromosome assessment by array CGH was subsequently supported by the European Society for Human Reproduction (ESHRE) consortium [9]. Encouraged by the outcome of the technology and its prospects as an objective prognosticator for embryo viability we expanded its clinical use and present the outcome of our experience to date.
Participants
Patients attending the CARE Fertility Group requested our recently developed array CGH technology for IVF as a 'last resort' to multiple failures of IVF and/or miscarriages, and they were accepted as part of a proof of principle study. This study was first considered by our IRB and, following an application was licensed and regulated by the UK Human Fertilisation and Embryology Authority (HFEA). Each couple was presented with comprehensive information documents, explaining the experimental nature of the technology and the rationale behind it, along with a detailed consent for their approval.
One hundred and thirty four couples elected to undergo IVF with array CGH 23 paired chromosome screening of PB 1 due to their previous IVF history; poor prognosis relating to their advanced reproductive age, recurrent miscarriage and previously failed IVF. The follicular phase was managed by pituitary desensitisation induced with daily 0·5 ml s·c· Buserelin (Sanofi Aventis, Guildford, UK) and, following confirmation of 'down regulation', ovarian stimulation commenced using either Menopur (Ferring, Slough, UK), or GONAL-f® (follitropin alfa for injection; Merk-Serono, Feltham, UK) 150-450 IU daily, depending upon each patient. Where appropriate, and on occasion, 500 mg tds Metformin (Bristol-Myers Squibb, Uxbridge, UK) was administered. Ovulation induction was using either 10,000 IU Pregnyl® (Organon, Cambridge, UK) or 250 mcg s.c. HCG (Ovitrelle, Merk-Serono, Feltham, UK). No differences in outcome data were evident from any of the various stimulation regimes applied. The oocytes were collected under sedation using ultrasound-guided transvaginal control around 36h following administration of Pregnul® , and ICSI was required. Most patients had a single embryo transferred.
IVF procedures
The oocytes were cultured in Ferticult IVF medium supplemented with 0·4% human serum albumin (Microm UK, Bicester, UK) for 3h before those at metaphase 2 underwent ICSI using a Research Instruments (Falmouth, UK) Integra Ti micromanipulator system. Immediately following ICSI oocytes are placed in culture; polar body biopsy was then undertaken within 30 minutes following ICSI using a Saturn laser making approximately a 7 µm opening in the zona pellucida along the horizontal plane of the polar body. Using a 13-15 µm i.d. biopsy pipette (Humagen, Charlottesville, USA) each polar body was carefully extracted and placed into 2·5 µl phosphate buffered saline in a sterile 0·2 ml PCR tube. Each was carefully labelled with the number of each oocyte, and each inseminated oocyte was cultured individually post ICSI in Quinn's Cleavage medium (Rochford Medical, Yarnton, UK) at 6% CO2 in air at 37°C until day 2 post oocyte retrieval; on day 3 the embryos were transferred to Global IVF medium (IVFonline).
Array CGH
For this study, modifications were made to polar body analysis from the first published work [8]. Amplification positive and negative controls were prepared. Human female DNA (Promega, cat# G1521) was freshly diluted in sterile 1 x PBS (prepared from 20x PBS, Cell Signalling Technologies, cat# 9808) to 25 and 6.25 pg/µl. Two and a half microlitres of each dilution, comprising 62.5 pg and 15.6 pg of DNA, and 2.5 µl of 1 x PBS alone were transferred to 0.2 ml PCR tubes and amplified in parallel with polar bodies.
Polar bodies, and media/reagent blanks were amplified using the SurePlex DNA Amplification System (BlueGnome Ltd, Cambridge, UK cat# 4151-1) according to the suppliers' protocol. Amplification was assessed by DNA gel electrophoresis and only abundant products of the expected size range were labelled. Eight microlitres of control/ sample product and SureRef Male DNA (BlueGnome Ltd, Cambridge, UK cat# 4152-1) were labelled with Cy3 and Cy5, respectively, using the BlueGnome Fluorescent labelling System (BlueGnome Ltd, Cambridge, UK cat# 4131-1) according to the manufacturer's instructions. Labelled control/sample and SureRef Male DNA were cohybridized onto 24sure microarrays (BlueGnome Ltd, Cambridge, UK cat# 4085-1). Resulting 24sure microarrays were hybridized, washed, and scanned according to the manufacturer's protocol.
Scanned images were analysed, quantified and whole chromosomal copy number ratios were reported using the Cytochip algorithm fixed settings in BlueFuseT Multi Software (BlueGnome Ltd, Cambridge, UK). Determination of specific human SurePlex amplification was confirmed by visualisation of Y nullisomy in the resulting aCGH plots in BlueFuse. Where specific amplification was observed autosomal and X chromosome profiles were analysed for gain or loss of whole chromosomal ratio using a 3 x SD assessment. Sample profiles were then reported as either euploid or aneuploid, as expressed in Figure 1.
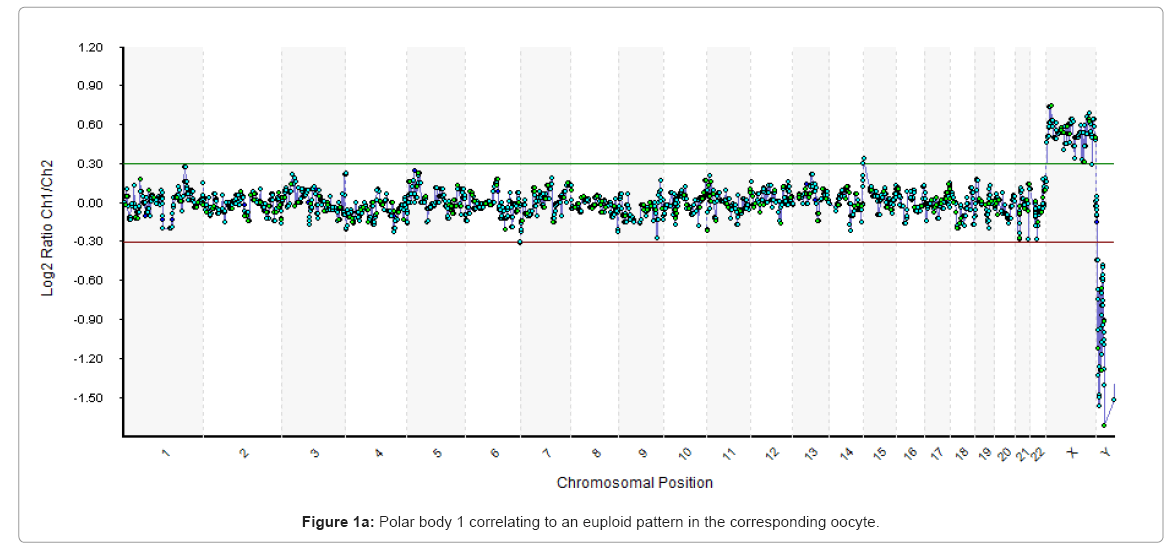
Figure 1a: Polar body 1 correlating to an euploid pattern in the corresponding oocyte.
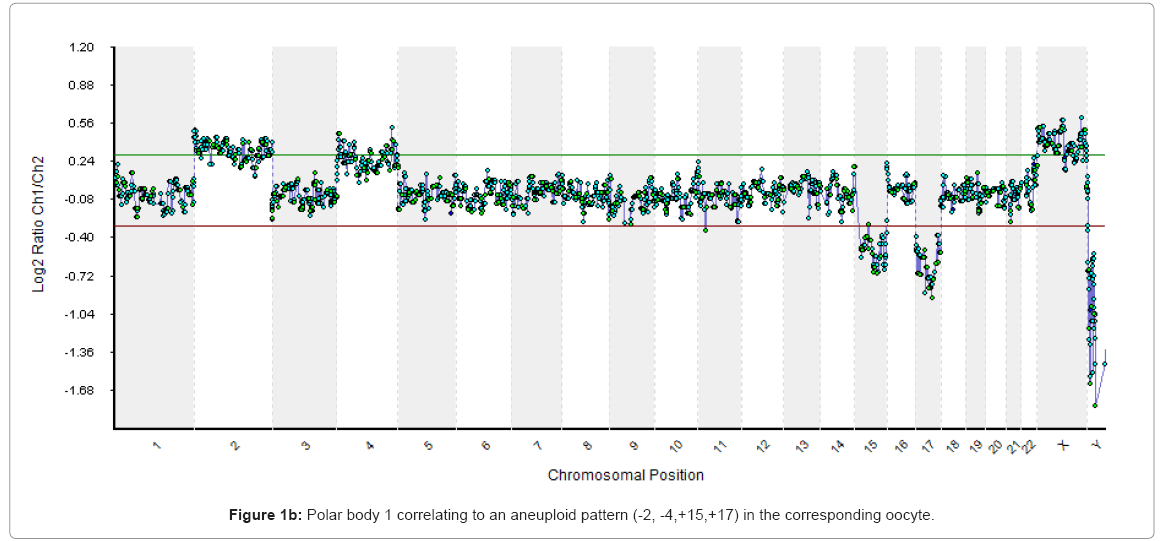
Figure 1b: Polar body 1 correlating to an aneuploid pattern (-2, -4,+15,+17) in the corresponding oocyte.
Due to the high cost of array technology a decision had to be made on testing only polar body 1 or both polar bodies. Testing only polar body 1, halved the cost to the patient. Also, at this early phase in the development of the technology there was considerable more 'noise' from PB2. It is possible that by knowing the meiosis 2 errors the clinical outcome would have been more efficient. This still needs to be proven. However, from our unpublished studies at the time there was a high correlation between PB1 aneuploidy and embryo aneuploidy on Day 3, suggesting by at least eliminating those errors the overall results may be improved.
Statistics
Were appropriate, linear regression modelling, and statistical analyses by either X2 or t-test were undertaken.
There were 134 individual patients making up 150 cycles with a median age of the female patients of 41.0 years and an inter quartile range of 38-43. The mean number of miscarriages, previously failed IVF cycles and the duration of infertility is given in Table 1. Of the 134 patients, 120 (89.6%) had a single cycle of array CGH, 12 patients had two cycles and two patients had three cycles. The median number of oocytes per cycle was 10 with an inter quartile of 7-12. There was little relationship between the numbers of oocytes harvested or the proportion of metaphase 2 oocytes with patient age (data not shown).
| Condition | Array CGH (Group 1) |
RPL1 ≥ 2 Age ≥ 38 (Group 2) |
RIF2 ≥ 2 Age ≥ 38 (Group 3) |
|---|---|---|---|
| # Cycles | 150 | 54 | 66 |
| Age | 41.0 | 39.9 | 39.8 |
| # Met 2 Oocytes | 1305 (‾8.7) | 250 (‾4.6) | 508 (‾9.1) |
| RPL1 | 2.2 | 2.1 | N/A |
| RIF2 | 4.3 | 0.3 | 2.6 |
| Duration of infertility (years) | 5.1 | 1.7 | 4.3 |
| # Embryo Transfers | 108 (72%) - 39 (26%)aneuploid - 3 (2%) all frozen |
48 (88.9%) | 56 (84.8%) |
| # Embryos Transferred | 112 (‾1.04) | 78 (‾1.63) | 109 (‾1.9) |
| # Biochemical Pregnancies | 38 (35.2%/ET) | 14 (29.2%/ET) | 11 (19.6%/ET) |
| # Deliveries | 26 (24.1%/ET)* | 8 (16.7%/ET) * | 7 (12.5% ET)* |
| Delivery/CS3 | 17.6% | 14.8% | 10.6% |
| Biochemical Loss | 31.6% | 42.9% | 36.4% |
| # Foetal Hearts | 31 | 7 | 8 |
| Implantation Rate | 27.7%$ | 8.9%$ | 7.3%$ |
1Recurrent Pregnancy Loss 2 Recurrent Implantation Failure
3Delivery Per Cycle Started
*P<0.0001; $ P<0.0001
Table 1: Comparative data between couples undergoing PB1 array CGH and those with Recurrent Miscarriage and/or Recurrent Implantation Failure without array CGH.
Of all 861 polar bodies tested, 67.4% were aneuploid in this cohort of patients. There was a positive correlation, between maternal age and the proportion of aneuploid oocytes (Figure 2), but outlier cycles which deviated from this trend may be due to the composite nature of the cohort which includes patients with varied histories. A similar analysis was performed on the number of oocytes harvested and the proportion of aneuploid oocytes showing no clear relationship (Figure 3).
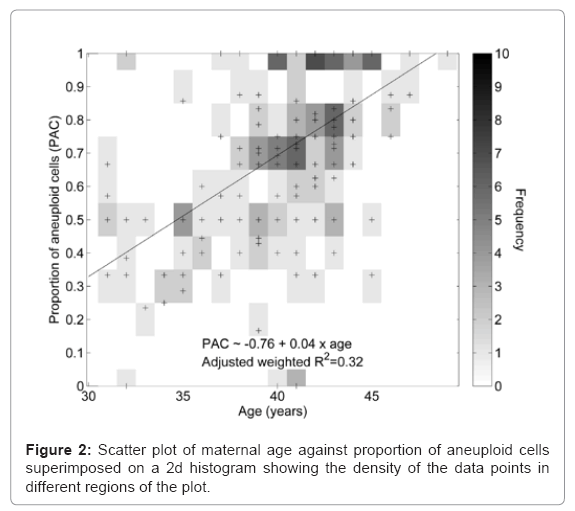
Figure 2: Scatter plot of maternal age against proportion of aneuploid cells superimposed on a 2d histogram showing the density of the data points in different regions of the plot.
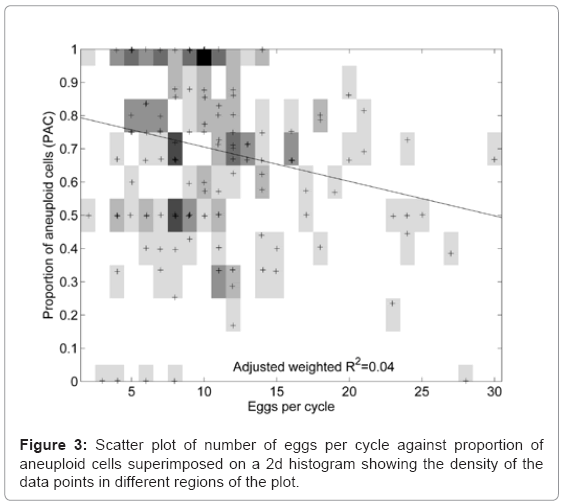
Figure 3: Scatter plot of number of eggs per cycle against proportion of aneuploid cells superimposed on a 2d histogram showing the density of the data points in different regions of the plot.
Of the 580 aneuploid polar bodies, 47% were single chromosome aneuploidies. Analysis of the total 19,803 paired chromosome showed 689 errors leading to a chromosome gain and 667 to the loss of a chromosome. Assuming a null hypothesis that all chromosomes have the same error rate, then the error rates of chromosomes 15, 16, 21 and 22 were higher than expected, and chromosomes 2-7, 11,12, and X were lower than expected (Figure 4a). Using a linear regression model it was possible to ascertain that segregation error rate is inversely proportional to chromosome length when percentage G/C base content is held constant, and the segregation error rate is positively correlated to the percentage G/C base content when chromosome length is held constant (Figures 4b and 4c, respectively). The frequency of segregation error and maternal age correlated with the highest age band, having a higher chromosome segregation error rate overall (Figure 5). The numbers of different aneuploidies were also examined for any evidence of a particular pattern. All 23 chromosomes were represented as 23 element vector where the value of each element is zero if the chromosome is euploid or one if aneuploid, providing for 8.35 million possible patterns (223) for the 580 aneuploid cells. There were 282 distinct patterns of which 80% (n=227) were observed only once (Figure 6). The most frequent pattern was a single error of chromosome 22, which was observed 43 times, representing 7% of aneuploid cells. The maximum repeat of any pattern in the 150 cycles was three, involving a single error of chromosome 22. In this cycle there were 11 aneuploid results in total, including two cells with single chromosome 21 errors, which was the second most frequent error. Fourteen patients had repeat cycles. We analysed the aneuploid status of their oocytes for repeat patterns and no patient had errors significantly different than expected by chance (data not shown).
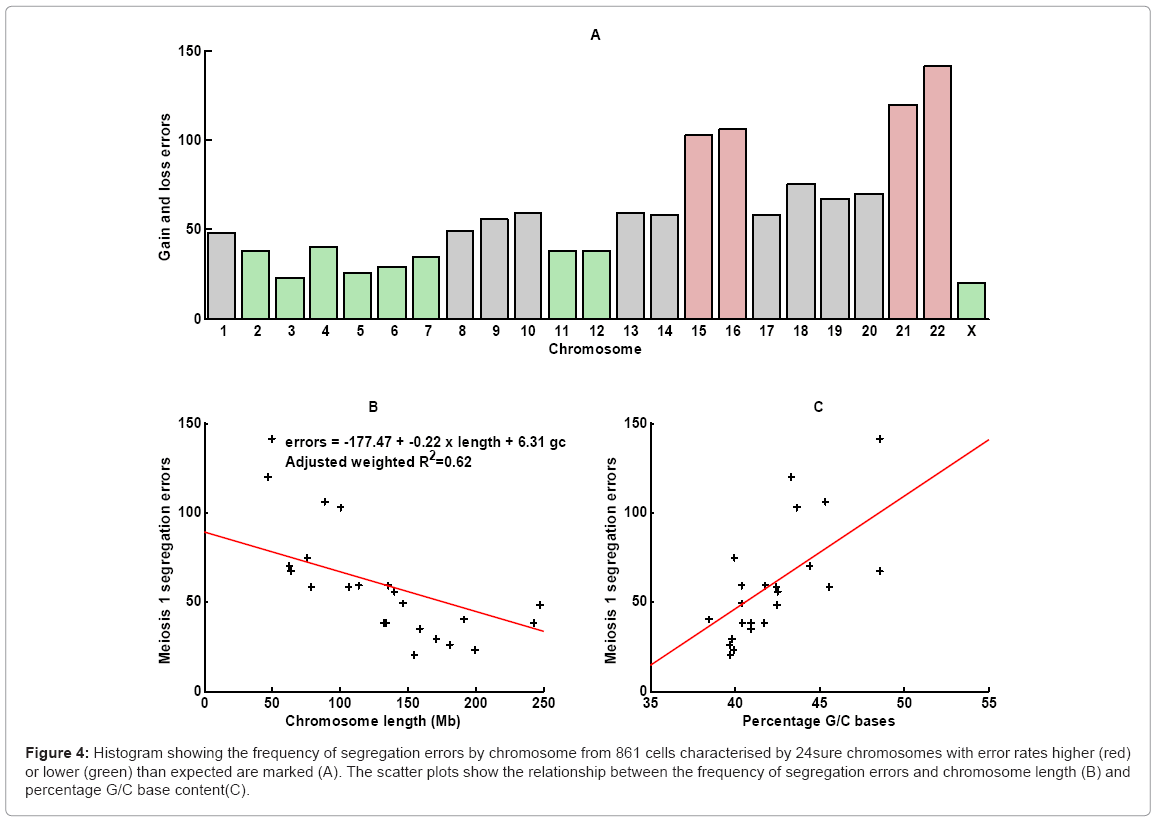
Figure 4: Histogram showing the frequency of segregation errors by chromosome from 861 cells characterised by 24sure chromosomes with error rates higher (red) or lower (green) than expected are marked (A). The scatter plots show the relationship between the frequency of segregation errors and chromosome length (B) and percentage G/C base content(C).
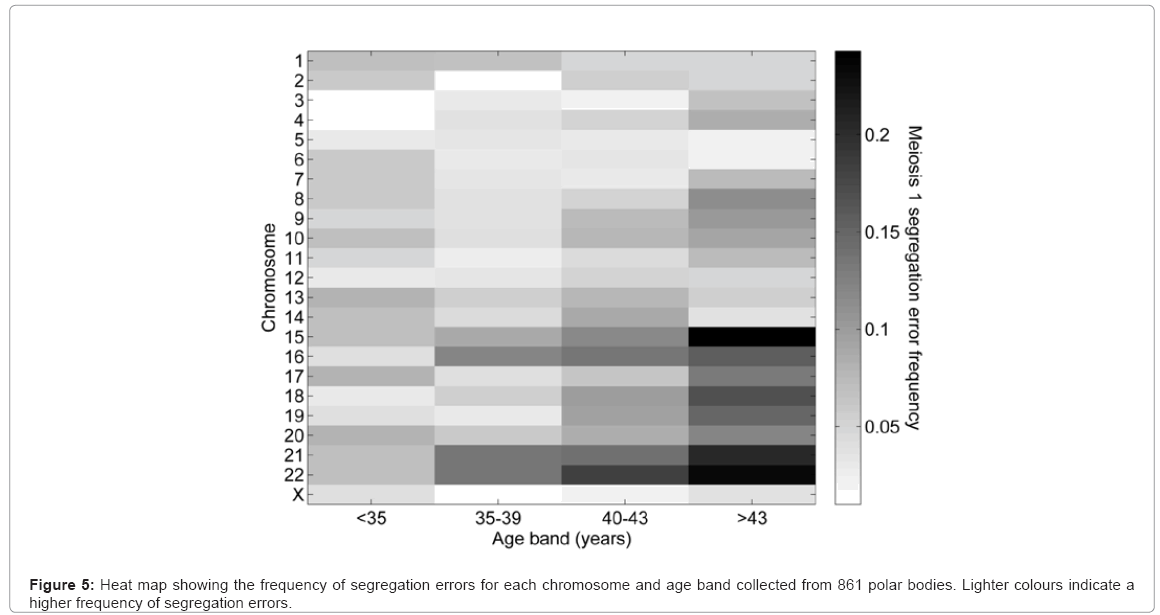
Figure 5: Heat map showing the frequency of segregation errors for each chromosome and age band collected from 861 polar bodies. Lighter colours indicate a higher frequency of segregation errors.
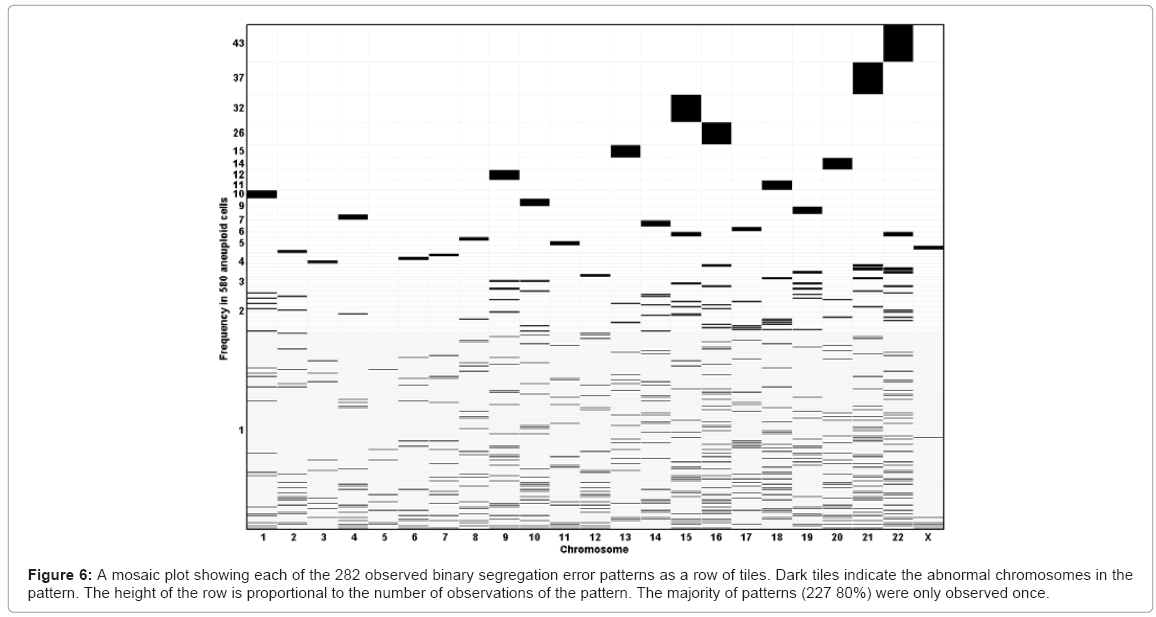
Figure 6: A mosaic plot showing each of the 282 observed binary segregation error patterns as a row of tiles. Dark tiles indicate the abnormal chromosomes in the pattern. The height of the row is proportional to the number of observations of the pattern. The majority of patterns (227 80%) were only observed once.
Of the 134 patients 13 (9.7%) had all aneuploid oocytes (10.7% of cycles), 29 (21.6%) had only aneuploid or 'no result' (24.7% of cycles) and 4 (3.0%) had only euploid or no result (3.3% of cycles); no cycle had only all euploid oocytes. No result was declared if there were no products of amplification. This can be due to either DNA deterioration in a degenerating polar body or loss of the polar body during the tubing stage. There were 14 patients with two or more cycles and in all of these there was at least one euploid oocyte in one of their cycles with the exception of one patient who had no euploid oocytes in either cycle. Patients with <25%, 25-50% or>50% of their oocytes aneuploid represented 6.7%, 30.6% or 62.7% of the patients (P<0.003), with a mean age of 37.3, 38.5 and 41.1, respectively.
As it was not feasible to undertake a randomized, blinded clinical study, an attempt was made to find a similar cohort of patients during the same period with which to make a matched comparison; this proved difficult as few patients had the composite clinical history that existed in the Group 1 patients who had array CGH. Two comparative groups were assesed, each having a similar age range but one group presenting with at least =2 miscarriages (Group 2), the other at least =2 failures of implantation after previous IVF attempts and no previously successful pregnancy (Group 3) (Table 1). Groups 2 and 3 each presented with a duration of infertility of less than the array CGH group (Table 1). In Group 1, 26% of patients (n=39) did not have embryo transfer due to all oocytes being aneuploid; three patients (2%) had all embryos frozen. There were 108 embryo transfers with a mean of 1.04 embryos transferred, totalling 112 embryos. This resulted in 26 patients having delivery, representing a 17.6%, and 24.1%, delivery rate per cycle started or embryo transfer, respectively. There were 38 (35.2%) biochemical pregnancies in this cohort, of which 3 (7.9%) where multiple (twin) pregnancies, one of these being monozygotic. The incidence of implantation per embryo transferred was 27.7%, significantly (P<0.0001) higher than Group2 (8.9%) and Group 3 (7.3%).
The choice of polar body 1 as an appropriate cell for array CGH assessment of oocyte aneuploidy has been discussed previously [8]. Preceding studies using up to 9, and more recently a larger number of chromosomes assessed by FISH evaluated mainly blastomeres or trophectodermal cells of the blastocyst. Due to a paucity of knowledge on the true incidence of embryo mosaicism and concordance between ICM and trophectoderm it was impossible to assess the validity of that approach, coupled with a technology, such as FISH, that was prone to a high incidence of interpretation and technological error [10]. As a rationale for this work we proposed that a robust technology that could accurately assess all 23 paired chromosomes in the polar body could be a candidate for reliable assessment of aneuploidy and detailed chromosome analysis (unpublished correlations with data on unused oocytes and non-transferred embryos built a confidence in the initial use of this technology [8]. The rationale for the clinical work was the axiom that if the oocyte was aneuploid then the embryo would be aneuploid - thus eliminating known aneuploid embryos should improve the efficiency of implantation. At the outset of this study it was believed that mitotic and sperm aneuploidy contributed up to 15% towards embryo aneuploidy, making 85% knowledge of aneuploidy a more reliable, objective discriminator than any other candidate currently used for embryo viability [2,11]; and especially when aneuploidy is the largest single cause of embryo implantation failure or early miscarriage [1]. However, more recent data on 24- chromosome microarray molecular karyotyping indicated that approximately 80% of blastocysts are euploid [12], which is in contrast to the data of other studies, stating that aneuploidy typically affects more than 50% of blastocysts [13,14]. Possibly, patient selection for embryo studies may have a bearing on results [15], and the derivation of pure inner cell mass cells (ICM) - an essential part of the understanding of concordance between trophoblast and ICM - is critical to reliable data. It is reported, from FISH studies, that approximately 50% of preimplantation embryos are abnormal in women at 35 and older, rising to nearly 80% in patients =40 years of age [16,17], and the majority of these chromosomally abnormal embryos seem to be eliminated before implantation. Hence, in 2008 we adopted this polar body approach and reported on the first birth using array CGH [8] . Our decision to move to polar body chromosome testing was recently supported by the ESHRE PGD Consortium Task Force, who advocated the theoretical advantage of assessing both polar bodies, 1 and 2 [9].
Microarray technology is expensive and pragmatic choices have to be made as to as how to obtain information for patients at an affordable cost. There was a high number of biochemical pregnancies in this cohort, but there remained a biochemical loss of 31.6%, similar to the other two groups. Perhaps assessment of PB2 errors would have reduced this further.
The very recent publication by the ESHRE Study Group on 42 cycles has confirmed the reliability of the array CGH platform, giving an excellent 94% correlation of the PB1 and PB2 data with the zygote [18]. But the study surprisingly showed no improved clinical outcomes compared to this study utilizing polar body 1 only. Whether this is a reflection of biology or the inherent pregnancy rates of the two ESHRE clinics is unclear; but if the latter is the cause then it is possible that our results could be improved by incorporating PB2. The justification for this on economic terms will have to be considerable as the commercial cost of doing both PB1 and PB2 is prohibitive. Furthermore, this discrepancy perhaps highlights the need to ensure that clinics of the highest calibre partake in RCT's, and their own parallel clinical outcome data is controlled for.
Substantial information has been gleaned on polar body chromosomes over many years. However, in hindsight, the concerns of the inherent errors of the FISH technology used previously, complicated by the significant differences arising in polar body data when FISH technology is compared with metaphase CGH, for example [19], need to be considered with any review of data using FISH technology. As Fragouli et al. [10], point out; the need to spread cells on microscopic slides for FISH analysis can lead to diagnostic errors because of artefactual loss of chromosome material. Nevertheless, it has been accepted that reduced fertility with age mostly arises from chromosome abnormalities deriving from meiotic errors [20]. Kuliev et al. [21], using only 5 chromosome FISH over many years, examining>10,000 oocytes, estimated that up to one third of oocytes had meiosis 2 errors, with at least half originating at meiosis 1, and almost half of the meiosis 2 errors were detectable as PB1 aneuploidies. Hence, although Kuliev et al. [21] data is in contrast to others who have shown that majority of errors reside in female meiosis 1 [22-24] , it appears to demonstrate errors originating equally from meiosis 1 and 2; with a significant proportion of meiosis 2 errors originated from meiosis 1. Although in miscarriages after conception in vivo>90% of maternally derived aneuploidy is derived from meiosis 1 [25], an important, recent study by [13] has demonstrated that the largest incidence of chromosome mal-segregation derives from meiosis 2. These authors demonstrated that for patients with reproductively-advanced age, and recurrent implantation failure the incidence of aneuploidy was 45% and 59%, or 39% and 50% for meiosis 1 and meiosis 2, respectively. For patients with recurrent pregnancy loss, however, the data was similar at 35.6% and 38.3%, respectively.
Due to the important clinical significance, it is essential to establish the true incidence of independent meiosis 2 errors of all 23 paired chromosomes with high fidelity. An earlier study by Fragouli et al. [26] examined a small number (n=16) of couples whose history was poor response to ovarian stimulation or diminished ovarian reserve and previous unsuccessful IVF attempts. They used metaphase CGH on 117 PB1 cells and corresponding PB2 cells. The overall oocyte aneuploidy rate was 65.5%; the mean maternal age was 39.8 years; very similar to the data discovered in the present study. The meiosis 1 and 2 error rates were 36.5% and 45.8%, respectively; and similar to the Kuliev et al studies [21] many of the abnormalities arising in metaphase 2 preexisted as chromatid errors in PB1. In the Fragouli, et al. [26] (study, the correction of meiosis 1 errors at the meiosis 2 stage occurred in 5 of all zygotes, with 2 ( 2.7%) potentially reverting to euploid. When we embarked on the present work it was not possible to undertake PB2 analysis, but this is now underway in several clinics. Large studies, and classification of different patient groups are urgently needed to affirm the meiosis 1 and 2 relationships, as reported by Fragouli et al. [3], and we are hopeful that the ESHRE study will provide this soon. However, comparing array CGH with metaphase CGH may lead to differences, especially in gains due to the inherently more signal noise in the latter technology.
Recently a study of 164 first polar bodies challenged the hitherto perceived wisdom that aneuploidy arises primarily through chromosome segregation errors in the oocyte - 'non-disjuncton' - at meiosis; and implicated precocious separation of sister chromatids [27]. This study demonstrated that single chromatid errors (SCE) were over 11 times more common than whole chromosome errors. At the commencement of this study less attention was given to SCE, which now needs to be considered for mechanistic analysis in all data.
The largest cohort study published, using 5 chromosome FISH to investigate aneuploidy, demonstrated a strong correlation in the overall frequency of oocyte aneuploidy in relation to maternal age from 45% at 34 years to 80% at age 43+ [21]. However, clinical comparison of aneuploidy data remains complex. Voullair et al. [15], using CGH demonstrated that the incidence of complex aneuploid anomalies is independent of maternal age - which itself is related to aneuploidy in "one or two" chromosomes - but increased in patients with a history of recurrent implantation failure; implying that major differences probably reflect variance in underlying pathology. The data observed in this study evidenced a higher chromosome segregation error rate in the older the female. Furthermore, we show that across all age bands the smaller chromosomes were more likely to be aneuploid than the larger ones, consistent with the findings of Fragouli et al. [3,10] who demonstrated that chromosomes equal to or smaller than 13 are involved most frequently in aneuploid events; further highlighting the problems and potential error rates using 5- probe FISH technology, with 34% of oocytes being wrongly diagnosed as normal. The use of a 12-probe FISH panel, however, still resulted in 19% of oocytes incorrectly classified [10]. Age-related aneuploidy may reflect recombination frequency [28] and/or spindle formation errors [29].
The data presented also shows that after controlling for chromosome length, segregation error rates are correlated to percentage G/C base content. In 200 Gerton et al. [30] reported a non-random association between GC content and recombination in yeast; and Fullerton et al. [31] studying the human genome on a per-chromosome analysis found that GC content, which varies widely across the genome between 30-60%, and recombination were significantly correlated within chromosomes; confirming that GC content is higher in chromosomal regions with higher recombination rates and suggesting that local recombination rate is an important indicator of compositional heterogeneity in the human genome. Furthermore, the findings in this study and that of Fragouli et al. [32] are consistent with the observation that GC-rich regions have much lower intron size compared with GC-poor regions of the mammalian genome, a major feature of isochore organization [33]. Recombination is purported to be the primary determinant of isochores in mammalian genomes [34].
Importantly for IVF, some studies implied a correlation between increased response to stimulation and aneuploidy, but this remains to be proven. An relevant more recent study by Labarta et al. [35] using the same patient as an internal control, suggested that ovarian stimulation does not change the nature of oocyte aneuploidy, compared to oocytes obtained in the natural cycle.
In addition to using polar body full chromosome copy number assessment for embryo selection, it can also be successfully combined with blastomere biopsy in patients having a familial monogenic disease and at risk of aneuploidy [36], or successfully extended to multiple inherited genetic disorders, and we have recently screened successfully chromosome copy number, single gene mutation for Fanconi anaemia, HLA and a translocation [37]. The importance of this multi-test approach is apparent for those patients requiring PGD but especially at risk of age-related aneuploidy.
In summary, this study provides information about PB1 chromosome status from a large cohort of patients undergoing IVF, and the first large study of clinical outcome data using polar body array CGH. The data was sufficiently encouraging to support a large randomised controlled trial; not only for patients with multiple failures and miscarriages, but arguably for all categories, including patients undergoing IVF for the first time. Although still to be determined, on a cost-benefit analysis, is whether PB1 and PB2 data combined will prove more efficacious than PB1 alone. Eliminating aneuploid embryos should improve implantation rates whilst minimising the risks of multiple pregnancies, as well as providing couples information as to why they have endured many cycles of IVF failure and help them move forward. Whether PB1 and/or PB2, a Day 3 blastomere or trophoblast cells will ultimately be the target cell(s) of choice, array CGH is a robust technology able to provide an accurate evaluation of full chromosome copy number.