Journal of Geography & Natural Disasters
Open Access
ISSN: 2167-0587
ISSN: 2167-0587
Research Article - (2018) Volume 8, Issue 2
Keywords: Lagos state; Nigeria; Sustainable development; Personal ecological footprint; Human development status
Recent trend in urbanization, industrialization, and population increase around the world have necessitated the need for constant evaluation of human impact on his ecosystem. In most of the developing countries, especially in Africa, there has been a high level of demand for resources leading to waste generation [1,2]. These resources (renewable and non-renewable) are often used in great volumes to maintain man’s lifestyle [3,4]. The levels of used resources and waste produced accounts for the global ecological change [4-6]. Studies have however shown that the earth’s ecosystem cannot sustain the current levels of man’s demand for these resources, [7-10], hence the introduction of sustainable development.
Sustainable development is a contested concept, with theories shaped by people's and organizations' different world-views, which in turn influence how issues are formulated and actions proposed. It is usually presented as the intersection between environment, society and economy, which are conceived of as separate although connected entities. Environmental sustainability is measured in quantitative basis and most of the metrics used for the measurement are still evolving [11]. Ecological footprint, one of the commonly used indicator of sustainable development, is often defined as the measurement of the extent of human impact on the biosphere, also, it is the total area of ecologically productive land and water anywhere in the world used for the production of all the resources consumed and assimilation of all the wastes generated by that population, using prevailing technology [10]. It is also seen as a model that estimates humanities demand on nature (especially in the biosphere) and communicates it tangibly in terms of hectares per person; thereby giving an understanding of how much a population have, how much they use, and who uses what. Ecological footprint is closely linked to such other indicators as biocapacity (or ecological carrying capacity), ecological deficit environmental space, total material requirement, natural capita, sustainability gap. The major components of ecological footprint are food, shelter, mobility and good [12]. Other components may include use of energy (electricity), natural gas and water. Some of these component upon consumption are ejected as municipal solid waste which also serves as a proxy for determining human developmental status. Studies have shown that ecological footprint is a unique indicator of human development on the biosphere and extent of humans ecological demand on his environment is a function of the carrying capacity of such environment [1,13].
Problem statement
The attempt by a large population to live a decent and comfortable lifestyle in the world today is of great concern as every aspect of human development depend largely on diverse interaction between social, economic and physical components of the environment [14,15]. These interactions often time result in noticeable impacts on the ecosystem [16,17]. Lagos state is the most populated and urbanized state in Nigeria [18], characterized by the smallest landmass (1171.28 km2), and highest annual in-migration of about a million persons. The high influx of people into the small land area has been reported in several studies to be a major cause of environmental degradation due to accelerated over-exploitation of the limited earth resources [19], and increased ecological stress. A settlement of this status is often associated with urban sprawl, slums, and a wide range of deviation in human development among its populace leading to varying lifestyles. This study therefore sought to evaluate the impact of these diverse human lifestyles on the ecosystem.
Objectives
The specific objectives of this study are to;
i. Examine the human developmental status (HDS) and personal ecological footprint across the study area, and
ii. Examine the relationship between Human development status and personal ecological footprint in the study area.
Study area
The study area is Lagos State, Nigeria. Lagos State lies approximately between 6° 22ʹ and 6° 52ʹ North of the Equator and 2° 42ʹ and 3° 42ʹ East of the Greenwich Meridian, with a land extent of about 3577 km2 (Figure 1). It is bounded in the East and West by Ogun state and in the South and West by Gulf of Guinea and Benin republic respectively. Lagos is regarded as the smallest state in the country with a population of over 9.1 million people [20].

Figure 1: The study area, Lagos State.
Methodology
The study employed survey research design. A structured and well calibrated ecological footprint model was adopted for the evaluation of personal ecological footprint of Lagos state. This model was retrieved from the Global Footprint Network and thus modified to suit the local environment. Individuals’ PEF were assessed in terms of food consumption pattern, transportation, energy consumption, waste generation, clothing, water use and shelter. The personal ecological footprint of each sampled individuals were derived using eqn. (1). Also, respondents’ level of education and income provided the basis for the determination of their human development status.
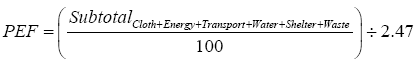 (1)
(1)
Studies [21,22] have reported that there are 1.2 million houses in Lagos State, this was therefore considered as the population size. The targeted population for this study are selected adults (head of the family) in purposively selected residential areas across Lagos State. People in perceived high (Lekki and Ikoyi), medium (Ogudu and Ikeja) and low (Makoko and Ajegunle) human development areas provided the sample frame for this study. These areas were selected because they are easily accessible to the researchers. Simple random sampling technique was used to determine the respondents (Table 1) for the 385 sample size derived using eqn. (2).
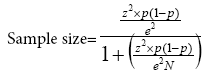 (2)
(2)
Where: N: Population size [1,200,000]
e: Margin of error [5%]
z: z - score [1.96 (95% confidence interval)]
p: Distribution [50% normal distribution].
| Settlement HD Status | Settlement | No of Administered Questionnaire | No of Returned Questionnaire | No of Analysed Questionnaire |
|---|---|---|---|---|
| Low | Ajegunle | 69 | 68 | 128 |
| Makoko | 64 | 60 | ||
| Medium | Ogudu | 70 | 66 | 128 |
| Ikeja | 70 | 62 | ||
| High | Ikoyi | 68 | 64 | 129 |
| Lekki | 70 | 65 |
Table 1: Distribution of administered and analysed questionnaire.
The well administered questionnaires were subjected to descriptive (mean, minimum, maximum and standard deviation) and inferential (ANOVA, Pearson correlation) statistics to evaluate the variations and strength of relationships between PEF across the HDS identified in the study area.
Table 2 shows the socio-economic characteristics of the respondents in the sampled (high, medium and low income earning) residential areas in Lagos state. Three hundred and eighty-five respondents were sampled in this study. The result showed that all age groups were represented, majority of whom were Married (more than 70%) and Female (at least 53.9%). Across the study area, Lagos State, more than 50% of all the sampled respondents claim to have a household size of at least 4 people. Highest education attainment was Postgraduate level, which was attained by 2.3%, 7.0% and 20.2% respondents in the sampled low, medium and high income earning residential areas respectively. The lowest educational attainment was Primary education. This is an indication that all the sampled respondents could understand the content and purpose of the questionnaire and were also in a good position to give a cogent response to each of the questions. Furthermore, the result on income give credence to the researchers choice of residence classification (see section 3) as over 70% of the respondent in the sampled high income earning areas earn at least 200,001 Naira monthly unlike in the low (1.6%) and medium (33.6%) income earning areas.
| Variable | Option | Low | Medium | High | |||
|---|---|---|---|---|---|---|---|
| f | % | f | % | f | f | ||
| Age (Years) | <25 | 3 | 2.3 | 25 | 19.5 | 12 | 9.3 |
| 25-40 | 73 | 57 | 65 | 50.8 | 58 | 45 | |
| 41-60 | 17 | 13.3 | 34 | 26.6 | 21 | 16.3 | |
| >60 | 35 | 27.4 | 4 | 3.1 | 38 | 29.5 | |
| Sex | Female | 69 | 53.9 | 82 | 64.1 | 78 | 60.5 |
| Male | 59 | 46.1 | 46 | 35.9 | 51 | 39.5 | |
| Marital Status | Married | 93 | 72.7 | 98 | 76.6 | 104 | 80.6 |
| Single | 35 | 27.3 | 30 | 23.4 | 25 | 19.4 | |
| Level of Education | No formal | 0 | 0 | 0 | 0 | 0 | 0 |
| Primary | 45 | 35.2 | 15 | 11.7 | 4 | 3.1 | |
| Secondary | 46 | 35.9 | 30 | 23.4 | 9 | 7 | |
| Tertiary | 34 | 26.6 | 74 | 57.8 | 90 | 69.8 | |
| Postgraduate | 3 | 2.3 | 9 | 7 | 26 | 20.2 | |
| Family Size | <2 | 30 | 23.4 | 15 | 11.7 | 13 | 10.1 |
| 02-Apr | 32 | 25 | 12 | 9.4 | 18 | 14 | |
| 04-Jul | 32 | 25 | 60 | 46.9 | 51 | 39.5 | |
| >7 | 34 | 26.6 | 41 | 32 | 47 | 36.4 | |
| Occupation | Farmer | 2 | 1.6 | 7 | 5.5 | 1 | 0.8 |
| Trader | 25 | 19.5 | 17 | 13.3 | 15 | 11.6 | |
| Teacher | 2 | 1.6 | 1 | 0.8 | 9 | 7 | |
| Civil servant | 34 | 26.6 | 47 | 36.7 | 40 | 31 | |
| Others | 65 | 50.8 | 56 | 43.8 | 64 | 49.6 | |
| Monthly Income (Naira) | <20,000 | 42 | 32.8 | 21 | 16.4 | 6 | 3.9 |
| 20000-50000 | 54 | 42.2 | 23 | 18 | 4 | 3.1 | |
| 50001-100000 | 20 | 15.6 | 20 | 15.6 | 16 | 12.4 | |
| 100001-200000 | 10 | 7.8 | 21 | 16.4 | 13 | 10.1 | |
| 200001-400000 | 1 | 0.8 | 33 | 25.8 | 52 | 40.3 | |
| >400000 | 1 | 0.8 | 10 | 7.8 | 38 | 30.2 | |
Low: Low Income Earning Residential Area
Medium: Medium Income Earning Residential Area
High: High Income Earning Residential Area.
Table 2: Social and economic status of the sampled respondents.
Transportation in the context of this study does not just involve the movement of vehicular device, but also the amount of time spent on transportation, and the type and efficiency of the vehicle involved. Transportation subcategory in this study, as indicated in Table 3, showed that high income earning areas recorded highest value (555.1 ± 201.44) in transportation than the low (3444.3 ± 180.17) and medium (477.4 ± 200.54) income earning areas. While the minimum transportation is 25 in Medium and Low income earning areas, it was 50 in high income earning areas. The result of analysis of variance, ANOVA, however showed that there is significant difference in the pattern of transportation among the sampled respondents in the sampled three categories of residential areas (F=38.674, P<0.05).
| Variable | Status | Mean ± Std Dev | Min-Max | F | P0.05 |
|---|---|---|---|---|---|
| Transportation | Low | 344.2 ± 180.17 | 25-800 | 38.674 | 0 |
| Medium | 477.4 ± 200.54 | 25-910 | |||
| High | 555.1 ± 201.44 | 50-910 | |||
| Food | Low | 403.9 ± 164.07 | 180-870 | 17.554 | 0 |
| Medium | 468.8 ± 181.51 | 190-870 | |||
| High | 543.5 ± 217.28 | 190-1120 | |||
| Energy use | Low | -12.5 ± 117.41 | -460 | 18.586 | 0 |
| Medium | 18.1 ± 102.44 | -440 | |||
| High | 70.4 ± 110.40 | -410 | |||
| Waste management | Low | 18.4 ± 90.14 | -330 | 1.53 | 0.218 |
| Medium | 36.4 ± 87.46 | -354 | |||
| High | 28.9 ± 68.57 | -358 | |||
| Clothing | Low | 260.1 ± 96.37 | 25-460 | 6.722 | 0.001 |
| Medium | 302.7 ± 83.43 | 85-460 | |||
| High | 279.1 ± 99.16 | 25-435 | |||
| Water use | Low | 187.2 ± 51.47 | 80-300 | 0.266 | 0.767 |
| Medium | 187.7 ± 55.26 | 80-300 | |||
| High | 183.3 ± 51.50 | 80-260 | |||
| Shelter | Low | 71.7 ± 113.85 | -390 | 23.204 | 0 |
| Medium | 141.8 ± 154.66 | -470 | |||
| High | 207.8 ± 199.70 | -570 | |||
| PEF (ha) | Low | 12.7 ± 3.42 | 6.33-20.01 | 51.999 | 0 |
| Medium | 16.3 ± 4.57 | 7.02-23.22 | |||
| High | 18.7 ± 5.81 | 6.01-29.29 |
Table 3: Personal ecological footprint across the sampled residential areas.
The food consumption pattern, energy use, clothing, and shelter are however similar to Transportation as the high income earning residential areas consume more than the other areas and there is statistical significant difference in the variables (P<0.05) across the sampled residential areas. However, waste generation and water use indicated a different pattern. While the high income earning areas consume the least water (183 ± 51.50), due to the use of water efficiency devices, Medium income earners consumed the most (187.7 ± 55.26). Waste generation, just like water use, is highest in the medium earning residential areas (36.4 ± 87.46) and lowest in the low earning residential areas (18.4 ± 90.14). The result of analysis of variation, however, showed a statistical similarity (p>0.05) in the pattern of waste generation and water use across the sampled residential areas.
The Personal Ecological Footprint of individuals sampled across the selected residential areas varied between 6.01 ha and 29.29 ha, both occurring in the income earning residential areas. This is an indication of heterogeneity of living standard across the study area. While the Maximum PEF ranged between 20.01 and 29.29, the minimum had a range of 6.01 ha and 7.02 ha. The result further indicated that while the highest mean PEF was recorded in High income earning residential area (18.7 ± 5.81 ha), the lowest occurred in Low income earning residential areas (12.7 ± 3.42 ha). This is an indication that high income residential areas consume more than the medium and low income earning areas and thus will require the highest land to sustain her lifestyle. The results were however compared across the selected residential areas and it indicated that the difference in personal ecological footprint, as measured by analysis of Variance, of across the residential areas was statistically significant (P<0.05).
Personal ecological footprint and human development status
The human development status of the sampled respondents, as depicted by income and level of education, showed a diverse strength of relationship with the personal ecological footprint and its subcategories. The result (Table 4) indicates that a positive correlation exists between income level and food consumption (r=0.935; p<0.05), shelter (r=0.475; p<0.05), transportation (r=0.507; p<0.05), energy use (r=0.425; p<0.05) and clothing (r=0.457; p<0.05) while it showed a very weak positive correlation with water use (r=0.201; p<0.05). On the other hand, the result indicated that there was no relationship between waste generation and income (r=0.042; p<0.05).
| Variable | rincome | reducation |
|---|---|---|
| LSM | 0.042 | 0.35 |
| Water | 0.201 | 0.128 |
| Food | 0.935 | 0.613 |
| Transportation | 0.507 | 0.355 |
| Shelter | 0.475 | 0.663 |
| Energy use | 0.425 | 0.24 |
| Clothing | 0.457 | 0.18 |
| PEF | 0.651 | 0.544 |
rincome: Pearson correlation coefficient of Income.
reducation: Pearson correlation coefficient of level of education.
Table 4: Strength of relationship between PEF and HDS.
Furthermore, the assessment of strength of relationship between level of education and personal ecological footprint showed a strong positive correlation (r=0.544; p<0.05) while all the subcategories except water use (r=0.128; p<0.05), Clothing (r=0.180; p<0.05), Energy use (r=0.240; p<0.05), Transportation (r=0.355; p<0.05) and waste generation (r=0.350; p<0.05), indicated a strong positive correlation (r<0.6).
This study have examined the human development status (HDS) in selected residential areas of Lagos state; evaluated the personal ecological footprint across the residential areas; and examined the relationship between personal ecological footprint and human development status in the study area. The choice of residential areas selected for this study was based on accessibility and proximity to the researchers. The research instruments used for this study were administered to a sample population across selected residential areas. Household heads were the targeted respondents. The research instruments (structured Questionnaire) were used to capture information on the respondents human development status, in terms of level of education and income level. Also, the personal ecological footprints of the individual respondents were captured with this instrument.
The results have shown that human developmental status, in terms of income and level of education, was highest in the high income earning residential areas (Ikoyi and Lekki) and lowest in the Low income earning areas (Makoko and Ajegunle). The difference in HDS across these areas may be as a result of difference in employment status, occupation, level of education and exposure, and other demographic and social reasons. Based on the differences in the human development status across the residential areas, disparities were recorded in all the subcategories of PEF. High income residential areas tend to consume more food, use more energy, spend more on transportation and shelter. However, they use least water and generate less waste. Consequently, personal ecological footprint across the residential areas, as indicated in the result of this study, showed that PEF varied across the residential areas with high income earners having the highest PEF and the low income earning residential areas having the least PEF. The study also indicated that the human development status has a strong influence on the ecological footprint of the sampled residential areas.
The result of this study did not state the personal ecological footprint in terms of per acre contribution to available land, rather, it measured the contribution of high, low and medium income earners, as measured by their footprint. This study therefore concluded that the pattern and relationship that exists between the personal ecological footprint and human development status of respondents across the study area was significantly different (P<0.05) and there exist a strong positive relationship between human development status and personal ecological footprint in the study area. Although, little variations were noticed as high income earning residential areas tend to consume use less water, and generate less waste, which however have minimal effect on the overall footprint.