Forest Research: Open Access
Open Access
ISSN: 2168-9776
ISSN: 2168-9776
Research Article - (2022)Volume 11, Issue 6
Background: Natural forest degradation for coffee management and intensification in natural forest has been substantially affecting forest Carbon (C) stock potential in western and southwestern Ethiopia which is not studied well. By considering this issue, the current study was conducted with the aim to assess the soil C stock changes as a result of conversion of natural forest to coffee-based forest at Anfilo District, western Ethiopia. The District is 642 km west of Finfinne (The country’s capital city). For the present study, two adjacent land uses, Protected Natural Forest (PNF) (1,576 ha) and Forest with Coffee (FWC) (2,364 ha) were considered. In light of this, soil samples were collected for the analysis of C content and Bulk Density (BD). Soil samples were taken by using ‘‘X’’ design from land size of 1 m × 1 m (four at corners for C content and one in the center for BD analysis) at two levels of soil depths (0 cm-20 cm and 20 cm-40 cm) separately. Accordingly, a total of 120 soil samples (60 for C content and 60 for bulk density) were collected and taken to laboratory for the determination of C content and BD. Walkley-Black method was used to estimate soil C stock. Independent t-test was used to test for differences in soil C stocks at significant level of 0.05.
Results: The findings of the present study revealed that significantly higher soil C stock was recorded for PNF (136.2+8.42 t C ha-1) than FWC (90.76+4.97 t C ha-1) (p<0.05). This implies that conversion of natural forest to coffee-based forest leads to a reduction of SOC by 33.4%, which is equivalent to the emission of about 166.613 t CO2 ha-1 to the atmosphere.
Conclusion: The study concluded that conversion from original natural forest to coffee-based forest significantly affected SOC of the study area. Thus, maintaining and enhancing the soil carbon sequestration potential of this forest soil should be required through implementation of different conservation mechanisms.
Coffee-based forest; Conversion; Soil carbon stock; Protected natural forest
AGB: Aboveground Biomass; BD: Bulk Density; C: Carbon; CO2: Carbon Dioxide; EFCCA: Environment, Forest and Climate Change Authority; FWC: Forest with Coffee; GHGs: Greenhouse Gases; GPS: Geographical Positioning System; IPCC: Intergovernmental Panel on Climate Change; MEFCC: Ministry of Environment, Forest and Climate Change; PNF: Protected Natural Forest; QGIS: Quantum Geographical Information System; REDD+: Reducing Emissions from Deforestation and Forest Degradation (+ represents forest conservation, sustainable management of forest and Enhancement of forest carbon stock); SOC: Soil Organic Carbon; SOM: Soil Organic Matter
Soil is a Carbon (C) reservoir of the terrestrial C cycle next to biomass C. The soil C stock denotes the balance between inputs of organic matter to soils and the C loss through decomposition, leaching, and erosion of organic matter. About 50% of the soil C is stored in forests [1], which includes dead organic matter and Soil Organic Matter (SOM) [2]. Compared to other land uses, soil under natural forest and protected forestland could store high Soil Organic Carbon (SOC) [3]. Thus, conversion of forest land to other land uses can contribute to disturbance of the natural ecosystem and decline of SOM, which may results in the loss of soil carbon and its emissions to the atmosphere [4-5]. Land use dynamics and management have profound influences on the quantity and changes of SOM and in turn, it governs the fate of SOC storage potential on global basis there by determining the state of climate change [6-7]. It has contributed to soil degradation and soil loss, leading to a decrease in soil C storage [8]. C stocks in tropical forests are susceptible to land use changes [9]. Forestland conversion to other land-uses in the tropics is among the major factors leading to losses in C stocks. This contributes to global warming; which occurs from increased concentrations of Green House Gases (GHGs) in the atmosphere leading to the net increase of the global mean temperature [10]. The proximate and underlying causes of forest conversion include pressures from increased demand for forest resources; selective exploitation or destruction of tree species [11]. Removal of vegetation cover reduces recycling of organic C to the soil [12-14]. Thus, there is a need for developing sustainable systems to maintain and improve soil C content while mitigating GHG emissions. Ethiopia is the cradle of worldwide Arabica coffee and named as the birthplace of Coffea arabica [15]. In this country, coffee (Coffea arabica L.) occurs in the undergrowth of moist afromontane forests [16]. Because of the expansion and management of this coffee plant, moist afromontane forest of the country, particularly that of south west and western parts has been currently under constant threat. In these areas, farmers grow annual crops in fields and collect coffee from semi-forested coffee systems, which are forests that are managed for coffee production by selective removal of trees and shrubs. Most of these stands have a spectral signature similar to undisturbed forests in low-resolution satellite imagery and are likely to be mapped as forests. Even though Ethiopia has an estimated SOC stock of 6459 × 106 tons (0 cm-100 cm) and in East Africa next to Tanzania and Zambia the third largest SOC stocks in the country specially in the south west and western parts of the country the above mentioned situation is eventually leading to forest degradation which may result in forest and soil carbon loss and its emissions to the atmosphere [17,18] show that semi-forest coffee management system decreases the forest basal area, tree regeneration, reduces tree density and eventually leads to the disappearance of the forest tree species. On the other hand, this may affect the carbon stock of forest ecosystem.
The study area, Anfilo district is one of the top 18 coffee producers’ districts from Oromia regional state [19] and characterized by a broad gradient of coffee forest management. Therefore, coffee is one means and source of livelihood of the district’s community. From the districts of Kellem Wollega Zone, Anfilo is also predominantly known by a potential natural forest area, which is one of the remnants moist evergreen Afromontane forests in western Ethiopia and the forest has been playing a crucial role in mitigating climate change. Despite this importance, this natural forest has been subjected to degradation in the past few decades for coffee expansion and its management. Cutting trees for timber extraction, fuel wood collection and house construction are also common in the study area. For sustainable utilization of natural resources, assessment of human made landscape modification is therefore very important. Even though, there are very few studies conducted in the district on forest C stock estimation, no scientific information was available in the district about changes in soil C stock resulted from such conversion of natural forest to coffeebased forest. Therefore, a more refined C accounting system is clearly needed in the area to clarify changes in soil C storage following land use dynamics, and preferably the one that includes different land cover types, whether natural or manmade. Hence, this study was aimed to assess soil C stock changes as a result of conversion of natural forest to coffee-based forest in the Anfilo district in order to generate important information for the conservation, management and sustainable utilization of this forest to enhance the forest’s soil C stock by reducing deforestation and forest degradation.
Anfilo District is located in the Kellem Wollega Zone of Oromia Regional State, western Ethiopia. The district extends from 8°30′0′′to 8°48′0′′N and 34°40′0′′ to 34°59.99′0′′E. Anfilo district is 642 km from Finfinne (country’s capital city) to the west and covers an area of 167,053 ha. Its elevation ranges from 500 to 2600 m.a.s.l (Figure 1).

Figure 1: Geographical location of the study area
Note:


It shares borders with Gambella Region on the south and southwest, Gidami on the north and northwest, Yemalogi Welel on the northeast and Seyo District on the east and southeast [20-22]. The study forest is about 26 km from Mugi town to the northeast (Figure 1). The District is divided into three agroclimatic zones from which 28% is highland, 8% is mid altitude and 64% is lowland [20]. The mean minimum and maximum temperature of the area is 12ÃÃÂ???C and 27ÃÃÂ???C respectively. It has a bimodal rainy season with annual rainfall ranging from 1200 mm-2320 mm. The main rain season is from June up to September. It is in this season that the major agricultural activities such as ploughing, sowing/planting and weeding are carried out in the nearby study area. April, May and October are short rain months [20]. The district also gets a little rainfall in November and December. District is a potential natural forest area designated as part of the Gergeda Forest, one of state forests proposed in 1975 as a National Forest Priority Area of Ethiopia [23] and covers about an area of 39,718.85 ha [22].
Data sources
The primary and secondary data sources were used in order to collect the relevant data to meet the objectives of this study. Primary data used to estimate soil carbon stock was obtained through field data collection in the study sites and the secondary data was collected from different sources like published and unpublished materials, books, journals, articles, reports, and electronic websites.
Samples and sampling procedures
Selection of the study area: Preliminary reconnaissance survey was carried out in order to obtain the general overview of the study area and to identify the appropriate sampling sites, sampling design methods and to determine representative soil samples. During the visit, the researcher discussed with working staff of Anfilo District Coffee and Natural Resource Office, EFCCA and some people about the purpose of the study.
For this study, two land uses, protected natural forest (forest without coffee) and forest with coffee were considered. The study sites encompass three adjacent forest kebeles namely Ashi, Duli and Sudi and cover an area of about 3,940 ha. These kebeles were selected because of the availability of the two forest types (PNF and FWC) in these kebeles and both sites are nearly under similar biophysical conditions except their differences in land management practices.
Delineation of the forest boundary: On the first step study kebeles Ashi, Duli and Sudi were delineated from Oromia kebeles shapefile. Then, the boundary of the study sites (study forests) found in these kebeles were digitized inseparately using high resolution satellite imagery (Google satellite). Since it was difficult to separately delineate study sites due to the spatial boundaries of the study sites were not separated and properly recognized, activities like observing the study sites area (reconnaissance survey) of the general area in order to get the ways and to record Geographical Positioning System (GPS) points for boundary delineation of these sites was done. After GPS points were recorded the two forests were separately delineated and then mapped. The above activities were made with the help of Quantum Geographical Information System (QGIS) Software version 3.2.3.
Sampling design and soil data collection: A systematic sampling scheme was used for soil sampling in both land uses Protected Natural Forest (PNF) and Forest with Coffee (FWC).
Accordingly, sampling sites were identified in the PNF of 1,576 ha and FWC of 2,364 ha for data collection. The soil samples were collected for the Bulk Density (BD) and soil carbon content analysis. Following [24,25], soil for organic carbon was sampled by using ‘‘X’’ design within 1 m × 1 m area (four at corners and one in the center) at two levels of soil depths (0 cm-20 cm and 20 cm-40 cm) separately. 40 cm soil depth was considered because carbon loss in the ground is intense in the top layer of soil profile (0 cm-20 cm) and no significant SOC change below 20 cm depth. It indicates stability between all land uses due to the low level of addition of biomass to lower depths [26]. IPPC also reported the strongest response of soil carbon stock to land cover change occurs in the top 20 cm-30 cm. Therefore, for this study sampling was considered on this section of the soil profile accumulation and twice of this depth is significantly enough to assess soil carbon stock variation across different land uses. The soil samples for the determination of both carbon percentage (C %) and BD were collected from the same quadrats and depth intervals for each plot [27].
The soil samples for carbon analysis were collected manually from four corners and one center by digging using hoe, while soil samples for BD were collected from near to the center of the design with soil core sampler of (6 cm diameter × 20 cm tall, 565.5 cm3) by carefully driving into the soil to avoid compaction. A total number of 120 soil samples, 60 for the determination of soil carbon content (24 from PNF (12 sampling points*2) and 36 from FWC (18 sampling points*2) and 60 for the BD were collected. An equal weight of each sample of the corresponding depth were pooled and mixed together. Then, from each plot, 500 g composite samples were taken as a representative sample for C% analysis and the entire soil taken by core sampler for BD analysis which were packed in plastic bags, labeled, sealed and transported to the soil laboratory. During soil samples collection, gravel materials, dead plants, old manures and areas near trees were excluded. Then at soil laboratory, the collected samples were air-dried and again passed through a 2 mm sieve to separate debris and gravel left in the collected samples followed with oven dried at 105ÃÃÂ???C for 24 hours. Finally, the BD and SOC were quantified after getting C% determined in the laboratory according to the Wakley and Black method [28].
Data analysis
Estimation of Soil Organic Carbon (SOC): SOC stock (t C ha-1) was calculated by multiplying the concentrations (%) of soil carbon, the Bulk density (g cm-3) and depth of the sampled soil [29],
SOC=BD* %C * Soil depth (cm)*100
Where, SOC: Soil Organic Carbon (t C ha-1), BD: Bulk Density (g cm-3) and % C: Carbon Concentration ((amount of solute) ⁄ (amount of solution)). Then, after the weight of the gravel above 2 mm diameter was subtracted, the BD was calculated as [30].
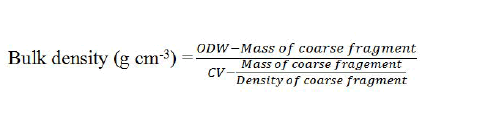
Where: ODW: Oven dried weight (g), CV: Core volume (volume of the soil in the core sampler in cm3). Note that, bulk density is for the <2 mm fraction, coarse fragments are >2 mm and the density of coarse fragments is often given as 2.65 g cm-3.
CV = h*πr2
Where: r: radius of core sampler in cm. The SOC stock of 0 cm-40 cm was calculated based on summing up the C stock in 0 cm-20 cm and 20 cm-40 cm soil layers.
Statistical analysis: The data collected were quantified and analyzed using quantitative research data analysis technique. The data collected from field survey was organized by excel 2010 and analyzed and interpreted using quantitative statistics. The size and variation in the soil Carbon (C) stocks for the two sites were described by the mean and standard error. Independent t-tests were applied to test whether there was significant difference in soil carbon stocks of the two forests by using Minitab 17 version statistical software. Statistical mean differences were considered significant when P<0.05. Simple statistical techniques (percentage, charts, and tables) were employed to summarize the results and supported by a concise discussion.
Effect of natural forest conversion to coffee forest on soil bulk density and C stock
Changes from natural forest to coffee-based forest and soil depth affected the soil BD (the physical soil property) and C content (chemical property of soil). The soil BD ranged from 0.22 g cm-3 to 0.75 g cm-3 in PNF and 0.29 g cm-3 to 0.97 g cm-3 in FWC, with the higher average soil bulk density for the full depth was recorded for FWC (0.7 g cm-3) than PNF (0.525 g cm-3). This variation was statistically significant (p<0.05). The average bulk density for the soil depth of 0-20 cm and 20-40 cm was 0.51 g cmp and 0.54 g cm-3 in PNF, while 0.65 g cm-3 and 0.75 g cm-3 in FWC respectively. This indicated that soil BD increases with soil depth and it shows the presence of higher Soil Organic Matter (SOM) in mineral soil of PNF than FWC.
Laboratory analysis of soil for soil organic carbon of the present study was done for the two soil layers (0-20 and 20-40 cm). The analysis showed that, the mean soil organic carbon percentage of the study forests was ranged from 2.65% to 13.1% in PNF and 0.94 to 6.55% in FWC, with the mean value of 6.82% and 3.34% in PNF and FWC respectively for the full soil depth. The average SOC percentage for the soil depth of 0 cm-20 cm and 20 cm-40 cm was 9.1 and 4.54% in PNF, whereas 4.3 and 2.38% in FWC respectively.
The total soil carbon density was ranged from 67.75-177.8 t C ha-1 in PNF and 48.2-148.35 t C ha-1 in FWC, with the average value of 136.2+8.42 t C ha-1 and 90.76+4.97 t C ha-1 in PNF and FWC respectively (Table 1). 67.5% and 61% of the total soil carbon were held within 0-20 cm soil layer, with the value of 91.9+8.27 and 55+7.62 t C ha-1 in PNF and FWC respectively (Table 2), while 32.5 and 38.2%, with value of 44.3+6.51 and 35.6+6.53 t C ha-1 are held within 20-40 cm soil layer in PNF and FWC respectively (Table 3).
| Forest types | 0 cm-20 cm soil layer | 20 cm-40 cm soil layer | ||||
|---|---|---|---|---|---|---|
| Mean | SE | P-Value | Mean | SE | P-Value | |
| Protected natural forest | 91.9 | 8.27 | - | 44.3 | 6.51 | - |
| Forest with coffee | 55 | 7.62 | 0.006 | 35.6 | 6.53 | 0.249 |
| Difference | 36.9 | - | 8.7 | - | ||
Table 1: SOC (0 cm-20 and 20 cm-40 cm depth) (t C ha-1) of protected natural forest Vs forest with coffee in Anfilo District, western Ethiopia.
| Forest types | Min | Max | Mean | SE | P-Value |
|---|---|---|---|---|---|
| Protected natural forest | 67.75 | 177.8 | 136.2 | 8.42 | - |
| Forest with coffee | 64.3 | 197.8 | 90.76 | 4.97 | 0.001 |
| Difference | - | - | 45.44 | - | - |
Table 2: SOC (0 cm-40 cm depth) (t C ha-1) of protected natural forest Vs forest with coffee in Anfilo District, Western Ethiopia.
| Study Area | AGC | BGC | LC | DWC | SOC | Author |
|---|---|---|---|---|---|---|
| Egdu forest | 278.08 | 55.62 | 3.47 | 277.6 | 32 | |
| Aba minch riverine forest | 414.7 | 83.48 | 1.28 | 83.8 | 33 | |
| Tera Gedam forest | 306.37 | 61.52 | 0.9 | 274.3 | 34 | |
| Gera forest | 108.86 | 21.77 | 7.28 | 172.6 | 35 | |
| Gendo forest | 128.6 | 26.52 | 3.12 | 4.64 | 94.96 | 36 |
| Gerba Dima forest | 243.85 | 45.97 | 0.153 | 23.2 | 162.6 | 37 |
| Gesha and saylem | 174.95 | 34.3 | 1.95 | 128 | 38 | |
| Anfilo district PNF | 136.2 | Present study | ||||
| Anfilo district FWC | 90.76 | Present study |
Table 3: Comparison of the present study (t C ha-1) with other studies in Ethiopia.
Statistical analysis showed that there was significant difference between the SOC within the full depth (0 cm-40 cm) and soil depth of (0 cm-20 cm) in PNF and FWC (P=0.002 and 0.01 respectively), while it showed insignificant variation for 20 cm-40 cm soil layer (P=0.249) (Tables 1 and 2). Overall, the result indicated that SOC in the PNF was significantly higher than SOC in the FWC (p=0.001) [31-34].
Soil carbon stock variability found in this study has important implications for Anfilo district natural forest carbon monitoring and emissions estimates for REDD+ (Reducing Emissions from Deforestation and Forest Degradation) and helpful for providing relevant information and understanding the changes of soil carbon stocks due to conversion of natural forest to coffee-based forest of a representative tropical moist Afromontane forests. This soil carbon stock change study was done taking into consideration the two forests are under similar biophysical conditions and the difference was only on their management level [35-37].
The soil C pool is known to undergo significant change after tropical forest conversion into other land uses [38], but little is known about its response to disturbances in standing forests. The results from this study revealed that the first 20 cm of the soil pool had the largest C stock and showed significant variation between the two forests, while the second 40 cm of the soil pool contain the smallest and a comparable value between the two forests. This was supported by several previous literatures elsewhere in the world [26,39-40] who reported the decreasing and no/little change of SOC with increasing soil depth for all land uses (especially conversion from forest to others) because of the decrease in the effects of AGB accumulation and subsequent decomposition processes. The loss of SOC from the surface layer (0 cm-20 cm) following conversion from natural forest to coffee-based forest was also agreed with the finding of who found that 77.79 and 53.59 Mg ha-1 for natural forest and coffee agroforestry respectively and finding that investigated higher SOC in dense forest than open forest.
Overall, the maximum soil C value recorded at PNF than FWC could be attributed to the presence of organic horizon that encompasses humus layers in the upper soil depths of the PNF than FWC. Moreover, PNF is not affected by human interventions in terms of removing and slashing under growth vegetation and selective removal of large trees which were common in FWC due to coffee management coupled with reduced soil organic matter inputs. Even local farmers, who collect the wood remains in the forest for fire wood, don’t touch it so the dry leaves decompose and be changed into minerals.
On the other hand, other related studies were reported the increment of soil C stocks in the ecosystem as the AGB increases. It was also reported that, more biomass production increased the aboveground litter and the belowground root activity and these make trees are an important factor for SOC. Therefore, trees having more above and belowground biomass contribute more to the soil C sequestration. Again, also reported that above ground vegetation properties are common predictors to estimate SOC stock in complex mountainous forests across different spatial scales and found the strongest correlation between soil carbon and large tree above ground carbon stocks with 24% of soil carbon variability explained by AGC stock.
Soil C is also highly influenced by soil chemistry and physical soil characteristics through disturbances also argued that disturbances control the soil quality mainly due to the biomass removal that is limiting the amount of organic matter inputs into the soil. Evidently, the degree of soil fertility was reflected in the aboveground carbon density.
In addition, this could be related to soil bulk density as it was lower in the PNF than FWC which indicates the presence of higher SOM content in PNF than FWC. In line to this, also reported higher SOM content improves soil texture and this resulted in a decreasing of BD in natural forests. And it is possible to suggest that erosion could perhaps be the case, a major factor affecting SOC stocks through altering soil microbial dynamics that is directly related to land use change and forest disturbance.
When the present study was compared to other studies, it was nearly similar with that of for the average SOC in Ethiopia (94 to 133 t C ha-1). Similarly, the C value recorded for FWC was similar with for semi-forest coffee (89 t C ha-1) and for home garden agroforestry (94.2+15 t C ha-1). It was also showed similarity with Gendo and Arba Minch riverine forest and that of PNF is similar with Gesha and Sayilem forest, while it is varied from Egdu, Tara Gedam, Gera and Gerba-Dima forest (Table 3). This difference could be due to the variation from depth to which C is accounted, soil type, different management practices and climate.
This study shows the result of soil carbon stock changes as a result of conversion from natural forest to coffee-based forest. The results from the present study mirrored that, even though soil carbon stock within 20 cm-40 cm soil layer statistically showed insignificant variation between the two land uses, protected natural forest and forest with coffee showed large and persistent variations in total soil carbon density. It was also observed that as the soil depth increases the soil bulk density increased while SOC decreased and the variation was statistically significant between the two land uses as it was also reported before by many researchers. The persistence of lower soil carbon stocks in forest with coffee may be linked to changes in forest structure and composition resulted from selective tree removals for coffee management and intensification that influences soil carbon stock potential of the forest.
Overall, patterns that emerged from this work suggest that conversion of natural forest to coffee-based forest had great impact on soil carbon stocks. Hence, compared to its adjacent protected natural forest, the role of forest with coffee found in Anfilo district in mitigating climate change is low since it has been contributing for the emission of about 166.613 t CO2 ha-1 to the atmosphere. Finally, the research recommended that since coffee is one means and source of livelihood of the district’s community, planting of new garden coffee on land previously without trees (unproductive croplands and grasslands) should be preferable to enhance the forest’s soil carbon stock and as mitigation against carbon emissions, whilst it also improve the farmer’s livelihood. Therefore, in order to minimize the impact better management option must be established.
The manuscript does not contain data or information from any person or individual apart from field and laboratory investigation. All data and information are generated, synthesized and approved by author.
“Not applicable”
The datasets used and/or analyzed during the current study are available from the corresponding author on reasonable request.”
"The authors declare that there are no competing interests".
“Not applicable”
The author mentioned above (Y.Sh.D) has made a substantial, direct, and intellectual contribution to the work, and approved it for publication.
I acknowledge daily workers for their unconditional support in the process of field data collection and as well as soil laboratory technicians who kindly spared their time and effort for determining soil bulk density and soil carbon content.
Qualification: BSc. in Natural Resource Management; MSc. in Forest Resource Assessment and Monitoring.
Position: Expert of Forestry, Expert of Climate Change Resilience and Reduction, Department Head of Forestry and Climate Change Resilience and Reduction department head and additionally I have been Focal Person of REDD+ Program at Gidami District Environment, Forest and Climate Change Authority, Oromia (2017-21).
• Lecturer at Dambi Dollo University, Forestry Department, Dambi Dollo, Oromia, Ethiopia (from January 1, 2021).
Citation: Daka YS (2022) Assessing the Effect of Natural Forest Conversion to Coffee-Based Forest on Soil Carbon Stock at Anfilo District, West Ethiopia. J For Res. 11: 333.
Received: 28-Nov-2022, Manuscript No. JFOR-22-18287; Editor assigned: 02-Dec-2022, Pre QC No. JFOR-22-18287(PQ); Reviewed: 16-Dec-2022, QC No. JFOR-22-18287; Revised: 23-Dec-2022, Manuscript No. JFOR-22-18287(R); Published: 30-Dec-2022 , DOI: 10.35248/2168-9776.22.11.333
Copyright: © 2022 Daka YS. This is an open-access article distributed under the terms of the Creative Commons Attribution License, which permits unrestricted use, distribution, and reproduction in any medium, provided the original author and source are credited.