Forest Research: Open Access
Open Access
ISSN: 2168-9776
ISSN: 2168-9776
Research Article - (2016) Volume 5, Issue 4
Spatial pattern is a key attribute of forest ecosystems. Spatial distribution pattern of woody plants, especially trees, has gained many interest by plant ecologists which leads to introducing a large number of different methods for quantifying spatial patterns. The purpose of the present study was the investigation of effects physiographic factors on spatial distribution patterns of oak trees (Quercus brantii var. persica) in western forests of Iran. So, based on systematic-random sampling methods with 400 m × 700 m dimensions, 82 plots (1000 m2) were selected and measured. In each plot, distance of two nearest neighbors to central of plot and physiographic factors including of altitude, slope gradient and aspect were measured. Hopkins, Hinez, Eberhart and C indexes were used to analyze the spatial distribution pattern. All indexes showed a clumped pattern for oak trees in study area without considering effects of physiographic factors. The results of this study showed that in different physiographic condition changes spatial distribution pattern of oak trees. So, physiographic factors have a key role in the determination of spatial distribution pattern.
<Keywords: Distance index; Open forest; Oak forest; Physiographic factors
One of a critical determinant of habitat structure is spatial pattern [1-3]. In order to have a better recognition of plant communities, studying the spatial pattern of them is necessary to understand many of the issues in forest ecology and management. Spatial distribution pattern of woody plants, especially trees, has gained many interest by plant ecologists which leads to introducing a large number of different methods for quantifying spatial patterns. Also quantitative assessment of the trees distribution in a forest stand is an initial step towards understanding the forest community dynamics [4]. The spatial structure of a forest is largely determined by the relationships within neighborhood groups of trees [5]. Also the spatial structure of a forest stand is of fundamental importance for forest dynamics, because the local environment determines competition among the trees, growth, death and regeneration. There are three main spatial patterns as following: uniform, random and clumped [6-8]. Also for quantifying spatial pattern of trees based on indices there are different sampling methods but distance sampling techniques had better results comparing to quadrat sampling [6]. Quantitative evaluation of tree distribution in a forest stand is the first step towards understanding the forest community dynamics. Most of the previous studies of spatial distribution patterns in tree stands have been on similar condition or without considering of effects physiographic factors on position of trees in forests stands.
Affecting factors on distribution of Amygdalus orientalis in Zagros forests of Iran were investigated that above sea level and soil texture are limiting factors of spices distribution [9]. Performance of three indices including uniform angle index, L-function based on K-function and with the pair correlation function were compared in analysis of the tree spatial distribution pattern and the results concluded that the uniform angle index is a suitable alternative for practical field assessment and it is more effective and feasible than other indices [10]. In other study Green, Morisita, Standardized Morisita, Johnson and Zimmer, TF, TN, Hopkins and C indices were used to analyze the spatial distribution pattern of oak trees that all of the applied indices showed a clumped pattern for oak trees and among the distance indices, TF, TN and C presented better results than the other indices [11]. Investigation role of physiographic factors in distribution of Abies pindrow along an altitudinal gradient in Himalayan temperate forests showed that there is positive correlation between of altitude with stem density (0.557) and of slope with total basal cover (TBC) in distribution of A. pindrow individuals [12]. Hopkins, Johnson and Zimmer indices were used to investigate of spatial pattern of three oak species (Q. libani , Q. brantii and Q. infectoria ) in Zagros forests of Iran and all of the indices showed a random pattern for oak species [13]. In order to investigate of spatial pattern of oak trees in Zagros forests of Iran were used uniform angle index and the results concluded that trees spatial pattern of oak trees were random [14]. The objective of the present study was to determine spatial distribution patterns of oak trees in related to physiographic factors including altitude, slope gradient and slope aspect in western forests of Iran.
Study area
The Zagros forests in west of Iran covered 5 million hectares with low density. The natural regeneration was virtually non-existent in these forests. Soil erosion was severe, with source rock being exposed. This study was carried out in the Zagros forests of Iran that known as Manesht and Ghelarang protected forests. The total of study area was 2300 hectares. The area is situated at 46°26'57" E and 46°31'31" E longitude and 33°40'28" N and 33°43'31" N latitude (Figure 1). Main spices of these forests are Q. brantii var. persica . The altitudes of the area is between 1250 and 2250 m a.s.l. and geographical direction occurs in the east aspect. Average annual precipitation is about 483 mm and annual air temperature in the region ranges from 8 to 38°C. The climate is semi-humid cold and cold based on the De Martonne’s climate classification [15].

Figure 1: Location of study area.
Methods
In order to determine of spatial distribution pattern of oak trees were used distance methods in this study. After selection of study area, 82 samples were measured based on systematic-random sampling pattern with 400 m × 700 m dimensions.
The grid intersections were applied as the center of sample plots and the beginning of distance sampling techniques. In addition to measure of distance indices, physiographic factors including of slope gradient classes (0-20, 20-40, 40-60 and 60-80%), slope aspect (north, east, south and west) and altitude (1250-1450, 1450-1650, 1650-1850, 1850-2050 and 2050-2250 m) were measured in each plot. Hopkins, Hinez, Eberhart and C indices were used to analyze spatial distribution pattern of oak trees in the study area (Table 1) [16,17].
| Index | Equation |
|---|---|
| Eberhart | 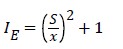 |
| Hinez | 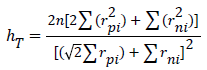 |
| Hopkins | 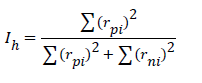 |
| C | 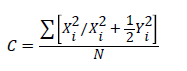 |
Note: S is standard deviation of observed distances, is average distances of central plots to nearest tree, rpi and Xi are distance of plot’s central to nearest tree, rpi and Yi are distance between of two nearest trees to plot’s central.
Table 1: Distance indices to analyze the spatial distribution pattern.
For determining of spatial distribution pattern by Hopkins, Hinez, Eberhart and C indices were used in Table 2 [6,18]. Using the following Table 2, can to determine the arrangement of trees in the study area.
| Spatial pattern | Hopkins | Hinez | Eberhart | C |
|---|---|---|---|---|
| Clumped | Ih>0.5 | hT>1.27 | IE>1.27 | C>0.5 |
| Random | Ih=0.5 | hT=1.27 | IE=1.27 | C=0.5 |
| Uniform | Ih<0.5 | hT<1.27 | IE<1.27 | C<0.5 |
Table 2: Determination of spatial distribution pattern using distance indices.
The results of Hopkins, Hinez, Eberhart and C indices showed that a clumped pattern for oak trees without considering effects of physiographic factors on spatial distribution pattern in the Manesht and Ghelarang protected forests (Table 3).
| Hopkins | Hinez | Eberhart | C |
|---|---|---|---|
| Ih=0.57 | hT=1.34 | IE=1.39 | C=0.51 |
| 0.57>0.5 | 1.34>1.27 | 1.39>1.27 | 0.51>0.5 |
| Clumped | Clumped | Clumped | Clumped |
Table 3: Results of spatial distribution pattern in study area.
Effects of altitude factor on spatial distribution pattern of oak trees showed that oak trees have a clumped pattern in altitude classes of 1450-1650, 1650-1850 and 1850-2050 m based on all distance indices. Also Hienz and Eberhart indices showed that oak trees have a uniform pattern in altitude classes of 1250-1450 and 2050-2250 m. Hopkins and C indices showed that oak trees have a random pattern in altitude classes of 1250-1450 m and 2050-2250 m (Table 4).
| Altitude classes | Hopkins | Hinez | Eberhart | C |
|---|---|---|---|---|
| 1250-1450 m | 0.5 | 1.13 | 1.12 | 0.5 |
| 1450-1650 m | 0.55 | 1.34 | 1.37 | 0.51 |
| 1650-1850 m | 0.51 | 1.46 | 1.53 | 0.53 |
| 1850-2050 m | 0.52 | 1.36 | 1.42 | 0.51 |
| 2050-2250 m | 0.5 | 1.13 | 1.16 | 0.5 |
Table 4 : Results of spatial distribution pattern based on altitude factor.
Effects of slope gradient classes on spatial distribution pattern are shown in Table 5. All indices showed that oak trees have a clumped pattern in slope gradient classes. Only Hopkins and C indices showed a random pattern for oak trees in 0-20% slope class (Table 5).
| Slope gradient classes | Hopkins | Hinez | Eberhart | C |
|---|---|---|---|---|
| 0-20% | 0.5 | 1.29 | 1.36 | 0.5 |
| 20-40% | 0.56 | 1.41 | 1.47 | 0.51 |
| 40-60% | 0.58 | 1.32 | 1.28 | 0.52 |
| 60-80% | 0.58 | 1.29 | 1.53 | 0.58 |
Table 5: Results of spatial distribution pattern based on slope gradient classes.
According to Heinz and Eberhart indices, oak trees have a clumped pattern in four slope aspects of north, east, south and west (Table 6). Hopkins and C indices showed that a random pattern for oak trees in south aspect, while oak trees have a clumped pattern in north, east and west aspects (Table 6).
| Slope aspect | Hopkins | Hinez | Eberhart | C |
|---|---|---|---|---|
| North | 0.53 | 1.29 | 1.35 | 0.52 |
| East | 0.58 | 1.36 | 1.47 | 0.53 |
| South | 0.5 | 1.36 | 1.41 | 0.5 |
| West | 0.51 | 1.33 | 1.33 | 0.58 |
Table 6: Results of spatial distribution pattern based on four slope aspect.
Physiographic is abbreviation of Physical Geography that has many effects on spatial distribution pattern of plants and their variance. Different researches have considered the spatial distribution pattern of plant without considering to physiographic factors (altitude, slope gradient and slope aspect). The physiographic factors including altitude, slope gradient and slope aspect are among the most important factors affecting spatial distribution pattern of plant. Results of Hopkins, Hinez, Eberhart and C indices showed that a clumped pattern for oak trees in the study area (Table 3). Also the results of present study showed that changes of spatial distribution pattern is depended on physiographic factors. In altitude classes of 1450-1650 m, 1650-1850 m and 1850-2050 m, oak trees have clumped pattern based on Hopkins, Heinz, Eberhart and C indices. But in lowest (1250-1450 m) and highest (2050-2250 m) altitude class, all distance indices showed a random pattern for oak trees in study area (Table 4). The results of distance indices showed that a clumped pattern for oak trees in 20-40, 40-60 and 60-80% slope classes. Only Hopkins and C indices showed that a random pattern for oak trees in 0-20% slope class (Table 5). Oak stands located in 1250-1450 m altitude class and 0-20% slope class had been destroyed, because these stands are available to livestock and local people. Also with increasing altitude and slope, density of trees was reduced and temperature and rainfall was changed that these reasons can be changed the spatial distribution pattern of oak trees. Also the results of distance indices showed that a clumped pattern for oak trees in north, east and west aspects. In south aspect, Hopkins and C indices showed that a random pattern and Heinz and Eberhart indices showed that a clumped pattern for oak trees in study area (Table 6). The cutting of trees for different uses, collecting seeds by local people and non-regeneration of oak trees can change the spatial distribution pattern from clumped pattern to random pattern. So, Hopkins and C indices showed a random pattern for oak trees in the south aspect. K-Function were used to determinate spatial pattern of oak trees in Marivan forests of Iran and the results showed that a clumped pattern that correspond with the results of present study [19]. Also C index were used to determinate the spatial pattern of oak trees on the aerial photographs and showed a uniform pattern for oak trees [20]. But in the present study, the results of C index showed a random or clumped pattern for oak trees (Tables 3-6). In other study uniform angle index showed a random pattern for oak trees in Zagros forest [14] that correspond with the results of Hopkins and C indices in altitude classes of 1250-1450 m and 2050-2250 m, 0-20% slope class and south aspect. But the results of present study showed that a clumped pattern for oak trees without considering of physiographic factors (Table 3). Due to use of different indices for determination of spatial distribution pattern, the results of two studies are different. Hopkins, Heinz, Eberhart and C indices were used to determinate of spatial pattern of oak trees and showed a clumped pattern for oak trees [17] that correspond with the results of present study. So, physiographic factors including of altitude, slope gradient and aspect are the most effective factors on plant dispersal [21].
Spatial structure is important in describing forest stand structure and change. Based on relative tree position, some spatial distribution methods have been proposed to describe forest stands. Stands spatial distribution patterns are measured and mapped by measuring tree locations in the stand and entering each coordinates into analytical frameworks. In the present study, impacts of physiographic factors on spatial distribution patterns of oak trees in Iran were assessed. In total, the results of present study showed that the physiographic factors have a key role in the determination of spatial distribution pattern and distance indices (Hopkins, Hinez, Eberhart and C) showed that a clumped pattern for oak trees in this study.