Journal of Aeronautics & Aerospace Engineering
Open Access
ISSN: 2168-9792
ISSN: 2168-9792
Research Article - (2023)Volume 12, Issue 2
Developing Air Traffic Management (ATM) and avionics human-machine framework ideas need real-time surveillance of the human operator to enable unique job assessment and system adaptability characteristics. To implement these advanced notions, a set of sensors capable of consistently and correctly capturing neurophysiological data is required. The scientific verification and performance evaluation of a cardio-respiratory sensor with ATM and avionics applications are presented in this research. The processed physiological measures from the specified commercial device are validated against clinical-grade equipment. Unlike previous studies that just looked at physical effort, this characterization looked at cognitive workload as well, which provides some extra hurdles to cardiorespiratory monitoring. The paper also discusses how to quantify ambiguity in the cognitive and somatic estimation process based on the ambiguity in the supplied cardio-respiratory measures. The sensor validation and uncertainty propagation findings confirm the commercialized cardiorespiratory sensor's fundamental compatibility for the planned aircraft application but emphasize the comparatively low performance within respiratory measures throughout a purely mental task.
Air traffic management; Cardiorespiratory; ECG; Cognitive ergonomics; Fuzzy systems; Mental workload; Heart rate
To increase operational efficiency in complicated missions involving vast volumes of data in time-critical scenarios, such as Air Traffic Management, human operators must collaborate with high degrees of automated assistance. Human-Machine Interfaces and Interactions (HMI2) that are dynamically adaptable have the ability to adjust cognitive burden, allowing for improved autonomy within decision support system. Several studies postulated that HMI2 adaptation be driven by neurophysiological monitoring. The major physiological observables that may be monitored are brain, cardiorespiratory, and ocular [1] activity, but research is also focusing on facial expression [2,3] and speech pattern analysis [4-7] to assess the cognitive states of the human operator. Every physiological observable gives a unique view on the monitored human’s physical and mental condition, as well as a variable amount of intrusiveness and ergonomic influence [8]. Some sensors are quicker but more prone with Electro-Magnetic Interference (EMI), whereas others are extremely slow but more impervious to noise and disturbances. For these vital reasons, there is a lot of interest in different neurophysiological observables and related sensor technologies for the aircraft industry.
Recent studies [9] have assessed the performance of gaze tracking sensors that have shown considerable potential for avionics and ATM implementations. Cardiorespiratory sensors have become less complicated and have a longer clinical history than Electroencephalogram (EEG) and eye tracking. These are also less vulnerable to interference, and certain cardiorespiratory monitors are far less invasive (and obtrusive) than EEG. As a result, the emphasis of this study is on the use of cardio -respiratory sensors to provide flexible HMI2 in aerospace. Whereas technology of cardiorespiratory sensor has been extensively investigated, important publications have solely addressed physical activity [10- 20]. A number of researchers have looked at using cardiorespiratory observables to estimate cognitive state in the context of air traffic control [21,22]. However, the data quality, which is dependent on the actual functioning of the sensors, must be evaluated to provide reproducible and compelling results [23]. As a result, for increasingly complicated aviation activities, characterizing the efficiency of Electrocardiographic sensors by examining the connection of cardiorespiratory properties to objective measurements such as work performance is critical. ECG sensors were employed in flight apps to evaluate the pilot’s mental workload [24-26], however the surgical instruments used in these investigations are often not suited for real-time applications owing to their invasive nature and insufficient support for real-time data exchange. The development of new consumer-grade devices on the market, on the other hand, holds considerable potential for adaptive HMI2 applications since they can monitor cardiorespiratory observables with reasonably high precision while overcoming the drawbacks.
Significant aeronautical research focuses on consumer-grade known as wearable sensors, whereby a number of studies have been published. None of this research included a mental assessment regimen, as well as the wearable cardiorespiratory tracking technology used in these studies was not used to measure mental Workload (MWL) or for aeronautical human factors. This absence of pre-experiment characterization and performance analysis is especially concerning given the substantial body of research involving these sensors within aviation [21-27]. Due to the increasing usage of cardiorespiratory tracking in aviation human factors analysis, it is critical to study their efficiency in cognitively challenging activities.
The purpose of this paper is to discuss the validation and performance characterization of commercialized cardiorespiratory sensors through monitoring cognitive activities, with an emphasis on aerospace applications. The study is a significantly expanded version of the preliminary work given in [28]. This research offers a way to apply the standard transmission of uncertainty theory using a machine learning algorithm, enabling to quantify the ambiguity inside the concluding cognitive state estimations, in addition to expanding the characterization beyond the solitary cardiac data. Because there is a scarcity of experimental literature data, this study doesn’t really guarantee to perform a statistically relevant analysis, but rather to accomplish a preliminary validation in a mental workload configuration and also to propose and illustrate a new methodology to risk propagation via neuro-fuzzy inference systems. Both of these characteristics are innovative and significant for ATM studies across the globe.
Cardiorespiratory sensing in the Cognitive Human- Machine Interface (CHMI) framework
Several active human factors engineering research [29] are addressing the problem of WL spikes within human pilot and ATM operator positions, since they are especially dangerous. A fundamental aim of these investigations is the creation of HMI2 that not only enables the operator to keep a greater awareness of the system’s operations, but also avoids cognitive overload and dangerous situations, such as attention tunneling or being “out of the loop.” Cognitive HMI2 (CHMI2) is a new idea with great potential to improve operational efficiency and safety optimization, in which a system detects the cognitive process of the single operator as well as dynamically adjusts HMI2 forms to give real-time assistance [30-31].
The CHMI2 cognitive case estimation methods obtain input data out of a pair of wearable and stand-off biosensors as well as other aviation systems and information sources and convert these operational, physiological, and environmental factors into cognitive states utilizing a ML-based classifier that was trained on the single operator using a specifically developed pattern. Figure 1 depicts the top-level CHMI2 system design customized for Human– Machine Interface (HMI) format, Level of Autonomy (LOA), adaptability, and ATM job scheduling that provides a full overview of the CHMI2 systems with an emphasis on the recently deployed neurophysiological sensor network [8].

Figure 1: The CHMI2 systems' top-level structure.
Real-time detection of cardiorespiratory indicators is crucial for the CHMI2 technology because, among many other reasons, these parameters have been found to offer an accurate estimation of the subject’s physical or mental exertion level. In addition, they have been researched for a long amount of time, thus there is a substantial body of literature and the sensing novel innovation is established. Both cardiovascular and pulmonary interactions have a low temporal responsiveness (slowing around 4 to 6 secs) [32] especially in comparison to different physiological signals (eye-based variables have a comparatively high temporal responsiveness on the order of just milliseconds [33]), leading to inaccuracies throughout fusion of the different physiological characteristics, thus a careful geometry of stimulation time with physiological changes is also required.
The investigated consumer-grade sensors is the Zephyr Bio Harness (BH) seen in Figure 2, that is broadly commercially accessible and often used for activity tracking (especially of the physical type). This gadget, hereafter referred to as a commercial device, therefore serves as a useful reference point for comparable wearable consumer-grade devices. The BH has become a tiny chest-mounted sensor having a 71 g chest strap and an 18 g processing module that collects and sends data in real time. It is capable of concurrently measuring heart rate, breathing rate, body temperature, posture, and tri-axial accelerometry. BH reported 250 Hz frequencies of ECG waveform and 18 Hz frequencies of breathing waveform. These raw readings are converted into heart rate, and breathing rate indicators, which are recorded or streamed based on recognized fluctuations or specified intervals, with 1 or 2 Hz being the most prevalent options. Literature shows that these sample frequencies are appropriate for heart rate, breathing rate, and Heart Rate Variability (HRV) indicators, since these are solely characterized as a ratio of the peak-to-peak intervals (for example, R to R) inside the raw signal, that for adult non-athletic individuals ranges from 0.3-4 Hz [34-35]. In low usage or static mode, the manufacturer's technical literature states that these values may vary by 2 bpm overall heart rate and 3 bpm overall breathing rate. The cardiorespiratory data collected from BH contains the unprocessed ECG signal (electric potential), the unprocessed respiratory waveform, and the processed Heart Rate (HR) and Breathing Rate (BR). The BH detects HR by catching heart electric signals for electronic filtering and analysis using silver-coated nylon skin sensors, which are then sent to the transmitter. For BR, an external load is used so that the resistance of the conductor grows in accordance to the height of the flexible Mylar, conductive fabric, and foam. This fluctuation in resistance is monitored using a sensor array with a patent-pending design. The expansion and contraction of the chest causes size differences that generate capacitance variations as a result of impedance changes. The frequency of such fluctuations is documented. For processed HR data, low and high filters with 15 Hertz and 78 Hertz cut-off frequency, are implemented to the raw ECG [36]analyzes and records a variety of physiological parameters including ECG, respiration, posture, and acceleration. The BioHarness operates in RF (Radio Frequency. These cutoff frequencies permit HR monitoring during strenuous exercise.

Figure 2: Commercial gadget used in ATM CHMI2 study.
The readings from commercial gadget are compared to the data from clinically verified and medical-grade ECG apparatus. Under resting settings, both sensors are employed concurrently to obtain baseline readings and greater mental workload (MWL) situations, allowing for a direct one-to-one comparison. The data recording process for both sensors is synchronized algorithmically to achieve optimum accuracy between the BR frequencies of both devices. Figure 3 depicts the Analog Device Instrument (ADI) Power Lab 8/30 like Dual Bio Amp DB066 unit, which is commonly utilized in medical research [37]. As the efficiency of this device has been thoroughly validated, the information from this
sensor may be utilized as the reference data for validating the commercial product. The sampling frequency for every Analog Device Instrument (ADI) ECG signals band is 1000 Hertz, and the Lab Chart program is used to capture and save various ECG channels.

Figure 3: Dual bio amp DB066 device in power lab 8/30 (image by AD Instrument and reproduced with permission).
The electrodes for the medical ECG are positioned in accordance with the conventional 5-lead configuration, where the 1st electrode is positioned on the shoulder’s right side, the 2nd electrode is positioned on the shoulder’s left side, and the 3rd electrode is positioned on the side’s lower left. According to Figure 4, an earth electrode is already on the right hand side of the bottom of the sternum and the 4th electrode is located within lower right abdominal region.

Figure 4: Design of a typical 5-lead ECG location.
AD Instrument spirometer, a medical-grade and clinically proven respiratory sensing instrument was applied to define the BR. The spirometer is among the differential pressure measurements that measures the volume and velocity of inhaled and exhaled air, as well as the respiration flow rate. The sampling frequency for the respiratory waveform is 100 hertz.
Efficiency categorization of cardiorespiratory measurements
Root Mean Square Error denoted by RMSE, standard deviation depicted by σ, correlation coefficient represented by CC, and mean bias MB throughout the whole dataset are the primary metrics used to evaluate the profitability of an organization device. These metrics were chosen as the most suggestive of measurement validity, and their definitions are as follows
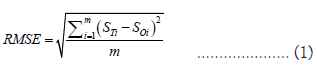
Where m represents a number of the data points; ST is a data measured from the commercial device at (1/min); so the data recorded from a healthcare device at (1/min); D is just a difference among ST and SO so in (1/min); and μD is an average difference among ST and SO in (1/min).
Figure 5 depicts the high-level technique implemented throughout this performance analysis of the commercial and the clinical devices directly linked to the Personal Computer (PC). As depicted, three distinct stages of cardiorespiratory information processing are evaluated: the accuracy and the precision of the offline-logged metrics, of the real-time streamed data, and of cognitive forecasts from neuro-fuzzy inference system, as the cardio-respiratory data is used to determine the operator’s cognitive states within estimation module. The HR is generated directly from the R to R interval, while the BR is obtained from the raw respiratory amplitude. Consequently, Department of Mechatronics, Hebei University of Technology Hongqiao, Tianjin, China óHR and óBR in the figure represent the uncertainties in recorded commercial device data relative to the medical device (results presented in materials and methods), while óRT is the standard deviation determined by correlating real-time data to post processing data (explained in Cardiorespiratory sensing in the chmi framework). Since the goal of actual HR and BR measures is just to estimate mental effort and other cognitive aspects by means of a neuro fuzzy inference system, the uncertainty in predicted workload is determined by óWL (results showed in Efficiency categorization of cardiorespiratory measurements). The inferred task of human operator has been used in CHMI2. Consequently, the measurement errors of HR and BR impact the workload’s dependability.

Figure 5: Validity of an approach for analyzing performance of wearable cardiorespiratory sensors.
Note: ( ) Comparison.
Real data streaming and time processing protocols
The incorporation of cardiorespiratory sensing into an adaptive system like the CHMI2 necessitates the streaming and processing of measurement data in real time. To meet this key need, the real-time measurement data transfer capability of the commercial sensor was also evaluated. For this feature, the sensor enables realtime data exchange over Bluetooth with any desktop device likewise equipped with Bluetooth and capable of running a required setup and data processing program [38]. Bluetooth is a very well wireless communication technology that exchanges data across short distances between smart phones, computers, and components using ultra-high frequency radio waves. Bluetooth was standardized by IEEE 802.15.1 [39]. Bluetooth (SIG) Special Interest Group, the worldwide standards body for Bluetooth technology, supervises hardware specifications and standardizes market-sold devices to guarantee that they comply with the standard and may be sent with associated licenses.
Comparing actual data to post-processing (offline) data, the same testing procedure as described in Efficiency Categorization of Cardiorespiratory Measurements is carried out in this instance. This test revealed that the two-sample data are in perfect agreement with 1 CC, mean bias, 0 RMS error, and. Thus, RT for both HR and BR is equal to zero. Note, however, that the Bluetooth signal is susceptible to packet losses and connection drops, especially in the presence of substantial Electro-Magnetic Interference, when substantial solid impediments lie in the line-of-sight path between both the sensor as well as the computing unit, or if the distance between the sensor and the computing unit has been excessive, leading to highly attenuated signals. These concerns are often researched by telecommunications professionals, and there are a number of studies in the relevant literature. A specific characteristic of Bluetooth link between both the BH and the computing unit just wouldn›t yield substantially different results in comparison to the literature, with the possible exception of a well-designed linkage «watchdog» functionality that restores dropped connections more consistently and promptly. The introduction of an appropriate interface for connection management, such as Lab Streaming Layer, helps alleviate the impact of transient connection drops without stopping the data stream [40].
Uncertainty propagation all over a process of neuro-fuzzy inference
A neurofuzzy inference system, that is built as part of the Cognitive HMI2 (CHMI2) to analyze real-time cardiorespiratory readings, is used to estimate the ambiguity in the operator’s WL from the cardiorespiratory and other physiological data. Fuzzy systems give some adaptability in adjusting system settings to individual users, such that the correlations utilized by the CHMI2 are unique to each person’s daily neurophysiological/mental state.
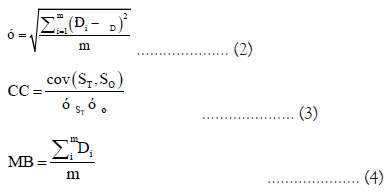
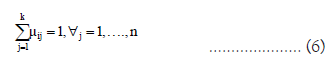
The approach for deriving the uncertainty in the categorized cognitive process as a function of neurophysiological inputs is based on our earlier findings [9]. In contrast to the previous research, this part focuses on pre-clustering and training findings based on experimental datasets, as well as their influence on uncertainty. In this work, the supposed inputs to the neurofuzzy inference system are HR and BR, and the estimated output is WL. A group of fuzzy rules and membership functions describe the fuzzy set. There are several versions of the fuzzy membership functions, each with its pros and downsides. The next section describes fundamental kinds including trapezoidal, Gaussian, triangular, sigmoidal, and bell functions. Our version of the Gaussian membership function is specified by parameters (µ, σ) as:
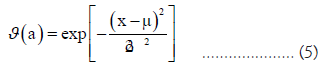
Where ϑ is a degree of the membership, µ is a center of a membership function, and is the cluster point difference, which is connected with the breadth of membership function. The procedure of preclustering is the initial stage in neuro-fuzzy system calibration. Fuzzy C-Means FCM is selected as the first clustering technique owing to its constant precision. The clusters must be specified up front. It is determined if the data point belong to group j by generating the membership matrix U. The total membership of each data piece must be harmonized across all groupings [41]:
Then, a cost function is supplied by
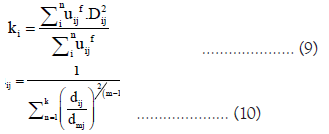
where ki is the cluster group j center, uij is the degree of membership of data point i in group j, f is the weighting exponent, which would be a parameter that has a significant effect on the FCM’s performance, and Dij is described by qai−kjq, which is the Euclidean distance between both the i-th data point and the j-th cluster centre. The degree of fuzzy overlap is enhanced by raising the value of f. The following are the required requirements for minimizing:
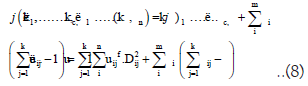
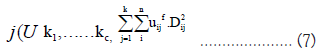
It is possible to calculate the least value of J (U, c1,... cc, 1,... n) by distinguishing it with the respect to all input parameters. The essential requirements are specified by:
The cluster centres k and membership degrees m are randomly initialized and then improved using equation (7, 8), respectively, before calculating an improved J from equation (5,6). Iteration of degree of membership and cluster centre computation is maintained until J meets a specified condition or mU(m+1) U(m) m meets a termination criterion. The second step is calibrating the created fuzzy cluster parameters, so optimizing them to optimize the correlations among inputs and outputs (s). We emphasize that (ANFIS) Adaptive Neuro Fuzzy Inference System architecture provided via the MATLAB library and utilized for the bulk of the work reported in this research only permits the inclusion of a single individual output. Due to its higher performance, the hybrid training approach is used to alter its (cluster) input membership function parameters, while the output membership function parameters are employed in the training phase. The selected ANFIS type [42] is the m Takagi Sugeno, having input-to-output mapping rules expressed as
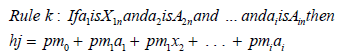
Where nth input is Ain, membership function ai, node output function hj of j output and pmj represents the rule k and input I coefficients for this node function.
The WL is believed to have a linear relationship with difficulty level. Low BR and HR indicate light exertion, while high BR and HR indicate heavy effort [43-44]. Consequently, the rule-base is composed of with 2 fuzzy rules:
If HR and BR are both low, then WL = 0.099 + 0.1167a1 − 9.8a2;
If HR and BR are both low, then WL = 0.124 − 0.016a1 − 9.8a2.
WL is a normalized number ranging from 0 to 1, with a minimum of 0.3 and a maximum of 0.7, since this math exercise’s Level of Detail (LOD) doesn’t demand 100 percent of participant’s cognitive capacity, as rated subjectively. The technique presented and assessed in [9] took into account the form and distribution of membership functions produced by the training procedure. It made no assumptions on the form or order of psychophysiological contour. As a result, no training data was supplied for the periods in physiological input data (and hence weren’t covered either by membership function) resulted in very stiff penalties such as higher uncertainty). As the human psychophysiological reaction from the reference is known to be very smooth and low-ordered [30], it is reasonable to assume that no peaks or troughs occur in the time during which no input training data is supplied. Therefore, we suggest a novel method based on the premise of a smooth low order psychophysiological frequency response. Despite the fact that training input data wasn’t even available for all the intervals, based on literature we can fairly conclude that such a smooth surface without major leap approximates the actual human reaction [45]. With this supposition, we can calculate the uncertainty in WL using the propagation of the uncertainty approach. The general formulation of uncertainty propagation is obtained from this multivariate expansion for every nonlinear differentiable function f:
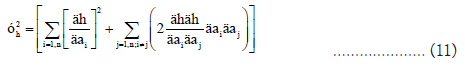
ai represent independent variables. Consequently, uncertainty propagation for WL estimations as a function of uncertainty in physiological inputs uncertainties has the following form:
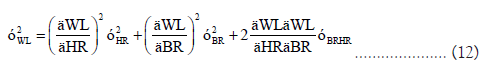
where σWL2 is the variation in the workload estimate, σHR is the variance in HR, σBR is the variance in BR, σHRBR is the covariance term of HR and BR (demonstrated the measurement population). The procedure of generating a polynomial surface from a FIS was mathematically explored in [46] and is now included in the MATLAB tool «gensurf».
Experiment design and raw measurement data processing
All study techniques and data collecting procedures were approved by RMIT’s University (ref: ASEHAPP 72-16) (CHEAN) College Human Ethics Advisory Network, and signed agreement was obtained from all participants. There are 10 participants in this study (eight men and two women, with a mean age of 28 ± 4.80 years). For all subjects, the trials were conducted in late morning hours. Each participant was forced to do three minutes of basic arithmetic calculations at each of three (LOD) Levels of Difficulty: easy, medium, and high. Every question at each level required subtraction, addition, division and multiplication. In the medium and advanced levels, adding more digits enhanced the challenge. In the addition, time restriction for each question changes by difficulty: 60 seconds for easy, 40 seconds for the medium, and 30 seconds for difficult. As shown in Figure 6, the one minute rest state was assessed before and after the test. Mathematical calculations were selected over more realistic ATM tasks because they have been found to elicit high levels of mental effort [46] without needing participants to have previous ATM experience.

Figure 6: The mental strain exercise experimental procedure.
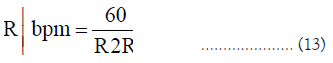
After the aforementioned testing processes were completed, raw ECG data were collected from the both commercial and clinical equipment. R peaks of signal were then detected in order to compute the instantaneous HR. After identifying each peak,(R to R) R to R interval may be determined by determining the time change between successive peaks. The (RtoR) interval is used to determine HR as:
For the purpose of comparing the clock, HR signal, and sample rates of both sensors were gathered and processed independently, since they might vary. The time was adjusted to synchronize the beginning and end of two datasets, and ECG signal from clinical device was the down sampled from 1k Hz to 0.25k Hz. In addition, the data-sets have indeed been resized to make sure data from the both sensors are in sync. Although there are several sources of electromagnetic interference in the surroundings of the intended application, our trials were done in a very realistic setting, and no substantial electromagnetic interference was identified. Furthermore, there is still a significant amount of noise in data such as movement artifacts, which might impact the system’s reliability. Therefore, the HR signal was filtered prior to system performance analysis, as is typical in cardiorespiratory monitoring applications. The selected method for reducing high frequency noise is the low pass filtering of Second order Butter-worth type that is undoubtedly the most reliable and reproducible raw signal processing approach. This filter allows signals below a specified cut-off frequency to pass while reducing frequencies above the cut-off frequency. This lowpass filtering smoothes the data and is particularly calibrated to improve the measurement’s precision, taking into account the physical and physiological characteristics of monitored bio signal. For example, HRV is a key component of CHMI2 framework [8] and may be separated into two different bands: one is the (LF HRV) Low Frequency, which ranges from 0 to 0.15 Hz, and the second is the (HF HRV) High Frequency, which extends from 0.15 to 0.4 or 0.45 Hz [47]. Both physical and mental WL are mostly connected with LF HRV, the cut-off frequency for our application may have been as low as 0.15 Hz; however, this would have needlessly constrained sensor characterization for the LF HR/HRV monitoring. At enable a cautious characterisation of sensor for all the HRV components and restrict the quantity of filtered the data, the cut off frequency was limited to 1 Hz with a curvature of 0.85, that is more than double the maximal physiological HF HRV element. Since HRV is obtained directly from same R to R as HR, a selected performance characterization relevant to both cardiac signals is provided. HR records lower than 50 bpm and more than 180 bpm, as well as BR records lower than the 5 bpm and greater than 30 bpm, were rejected per a data rejection policy.
The breathing waveforms from commercial and clinical devices were extracted, and the corresponding BR was computed. Specifically, the waveform was time-differentiated, the positive and the negative peaks in BR derivative were found to represent inhalation and exhalation, respectively. The BR was then computed for both the datum and measured breathing in same way as Equation (1), with R to R substituted by the time change between the onsets of inhaling episodes (peaks in first derivative that is the signal of chest expansion magnitude). The findings were upsampled to the common time reference, and then a low-pass filter with a cutoff frequency of the 1 Hz and a slope of 0.95 was applied. As human respiration has the lower frequency as compared to cardiac signal, this screening is atleast as conservative as of the HRV screening outlined above.
After applying the data rejection criteria outlined in Experiment design and raw measurement data processing, Table 1 displays the aggregated validity findings of commercial device in comparison with relevant clinical sensor values. Across all individuals, the average RMSE for HR is 4.85 bpm, and average CC is 0.66. Examining merely aggregated correlations among two datasets has certain limitations: the discrepancy indicator is not provided, and the degree of agreement is not thoroughly evaluated. Hence, Bland Altman plot also used to examine the outcomes of the characterisation. This figure displays the dispersion of values, the range of values, the amount of systematic difference, random mistakes, the relationship between two procedures, and most significantly, the outcome variations [48]. Figure 7 displays Bland Altman plots for full dataset, broken down by HR (left) and BR (right). Each blue dot calculates the mean sampling errors (difference between both the commercial and clinical sensors), and each black line represents the confidence interval or boundaries of agreement at a confidence level of 95%. From these boundaries of agreement lines, the range of values, whether they are little or huge, can be clearly observed.
| RMSE[1/min] | s[1/min] | CC | Mean Bias[1/min] | |
|---|---|---|---|---|
| HR | 4.851 | 4.11 | 0.662 | 1.9 |
| HR min error | 0.727 | 0.719 | 0.989 | -1.511 |
| HR max error | 14.86 | 10.55 | 0.319 | 10.48 |
| BR | -9.728 | 7.393 | 0.086 | -6.002 |
| BR min error | -7.957 | 6.533 | 0.187 | -2.77 |
| BR max error | -12.94 | 8.024 | 0.028 | -15.79 |
Table 1: The commercial device's HR and BR validation findings.

Figure 7: HR (on the left) and BR (right) Total population Bland-Altman plots Mean differences (red lines) and 95% confidence intervals (black
lines) are shown.
Note: ( ) Average data, (
 ) 95% CI, (
 ) Mean difference.
In the last phase of sensor characterisation, the complete analysis of measurement errors were examined. Figure 8 depicts the BR and HR measurement error estimates for all subjects as histograms.

Figure 8: HR (left) and BR (right) error statistical distributions (histograms) for the total population For reference, the normal (Gaussian) fit curve is also displayed.
In addition, the picture depicts the normality test (Gaussian) fits. Compared to HR, the mean bias () and standard deviation () are greater for BR, making BR a right skewed distribution.Uncertainty in the inference system
Using polynomial coefficients from psychophysiological response function (shown in Figure 9 on the left), the variance in WL estimations for every value of HR and BR may be computed. Given the sensor uncertainties determined in the preceding section as σBR = 6.534, σHR = 0.720, and σHRBR = 0.560, the findings for a single individual are shown in Figure 9 (right).

Figure 9: (Left) psychophysiological response surface for one of the participants. (Right) Uncertainty in WL as propagated through the psychophysiological response surface.
According to the classification of raw cardiorespiratory measures (Table 1), the CC in HR was more than 0.50 in the overwhelming majority of instances, indicating a moderate (or better) correlation. The minimal mean HR bias is a relatively low 1.511 bpm, while the highest is 10.48 bpm. The majority of HR’s mistakes were committed by a single participant who looked to be wearing a loose strap. Specifically, it was found that the HR data of one person and the BR data of the same participant and then another participation were not accurately recognized by the industrial monitor, most likely due to the improperly tightened strap. As this is a restriction of the sensor that is noted in the handbook, the information from these individuals should have been discarded; instead, it was included for the sake of completeness. The performance of BR was continuously inferior to that of HR. As shown by the CC, the connection between BR readings was very weak. In addition, the BR data demonstrated a significant RMSE, and average bias with corresponding values of 9.729, 7.394, and 6.003 bpm. Visible in the Bland–Altman plots (Figure 7) are quite considerable changes in HR and BR. Specifically, Figure 7 (left) demonstrated that the mean difference grew in both the positive and negative directions when HR values climbed. The average difference between individuals was 3,021. According to [12], the greatest difference between the commercial and clinical devices was 25. Figure 7 (right) likewise demonstrated an increasing tendency of negative difference with rising BR values. Lastly, the Bland–Altman plots revealed that there have been no significant differences between individuals, verifying that the low CC values for BR were accurate. The average BR difference between participants is 5,466 bpm, which exceeds the value specified in the technical criteria. We were forced to examine the basic BR time-series data (Figure 10) and the pulmonary amplitude plots for all subjects as part of our study of these unsatisfactory findings. These further experiments led us to the conclusion that the commercialized device consistently missed breaths with a lesser amplitude and greater frequency.

Figure 10: Filtered BR sequence from clinical (blue line) and
commercial devices are compared (red line).
Note: ( ) Datum;
(
) Datum;
( ) Measured.
Considering the uncertainties in the projected cognitive workload (Segment 3.1), the prime target of WL was 45%. Even though this level appears to be high, it is reasonable given that the cardiorespiratory response is much slower than the cognitive processes we are assuming [49] and that the operations we prescribed to the people involved were likely less than the cognitive load they could withstand at their maximum capacity. Attempting to assess the whole cognitive spectrum would have necessitated an adaptive exam, which will be investigated in future studies. From Figure 9 (right), it is obvious that the uncertainty is very low (below 25 percent) across a large range of HR and BR inputs, but grows significantly in a narrow area of high HR and low BR. The best uncertainty associated with estimated workload WL is 37.64 percent (Table 2). The worst-case maximum uncertainty regarding inferred WL is 222 percent, because of BR’s very high level of uncertainty. Before beginning real-time measurements, the calibration procedure of the cardiorespiratory equipment should be repeated until an acceptable error is attained when such substantial uncertainties are identified. Table 3 displays the uncertainty within estimated workload simply using HR as an input variable, since we have shown that the substantial uncertainty in BR also contributes to considerable estimate mistakes. The average WL reduces by 38.95% from 1,328 to 0.82. The worst-case scenario exhibits increased performance but remains useless. The average WL without the worst-case scenario is reduced from 0.811 to 0.356, which is within the allowed range of less than 0.45.
| σHR | σBR | σHRBR | σWL | |
|---|---|---|---|---|
| Best | 0.721 | 6.535 | -0.561 | 0.377 |
| Worst | 2.492 | 7.434 | 17.49 | 2.221 |
| Average | 4.111 | 7.395 | 0.851 | 1.331 |
Table 2: The neuro-fuzzy inference system's σHR, σBR, σHRBR, and σWL.
| σWL | % Decrease | |
|---|---|---|
| Best | 0.124 | 33.38 |
| Worst | 1.212 | 45.46 |
| Average | 0.812 | 38.95 |
Table 3: σHR and σWL from the system of neuro-fuzzy inference.
The overall result of the validation would be that the assessment validity of breathing rate is insufficient for detecting mental activity, wherein more frequent and smaller and breaths are typical. However, it should be emphasized that BH had been created primarily for athletics and sport medical applications, therefore these results do not contradict expectations. Alternative respiratory sensors must be examined for the CHMI2 deployment in light of the findings of this characterization. Hemodynamic sensors, which detect factors linked with blood flow, have the potential to be less invasive and perhaps more accurate in measuring mental activity. In the context of future study, their assessment validity will be examined.
This research focused on the experimental characterization of a commercialized cardio-respiratory sensor for potential applications in ATM and aeronautical Human–Machine Systems (HMS). This sort of cognitively challenging activities is linked with an increased mental workload, but no prior study has examined the verification and performance assessment of commercial sensors that are routinely employed in such mental workload investigations. This research examines a commercially available sensor of sport and sport medicine applications that is able of both offline recording and real-time data broadcasting of raw and processed cardio- respiratory data. During realistic mental demanding tasks, the measurement validity and precision of both Heart Rate and Breathing Rate measures from wearable commercial gadget were evaluated by comparative evaluation with a clinically useful device.
Extending the standard propagation of uncertainty theory, the research also established and implemented a unique way to quantify the uncertainty in cognitive state estimations relying on the variability within input physiological signals. Particularly, the cardio-respiratory data were used to quantify the variation in WL as well as other cognitive state estimations, which were then propagated across the physiologic response surface established by a neuro-fuzzy inference model. The investigation revealed that the commercialized device obtained high accuracy in measuring heart rate but performed badly in measuring Breathing Rate (BR) during mental demanding activities. Therefore, the error in cognitive state estimations was only acceptable if restricted to cardiac measures. The chosen device is sufficient for monitoring of cardiac as part of the intended aviation HMS application; however different devices will be required for respiratory tracking. The leading choices for measuring mental activity are circulatory sensors, which are often less obtrusive and perhaps more accurate. This study adds to the larger investigation on CHMI2 for ATM and avionics systems, one of the primary areas of innovation in aerospace systems. To correctly monitor cognitive processes throughout complicated activities, researchers will investigate the best integration and fusion of diverse neurophysiological sensors.
Availability of data and materials
The datasets used or analyzed during the current study are available from the corresponding author on reasonable request.
Competing interests
The authors declare that there are not any competing interests.
Funding
Not applicable.
Author's contributions
Chandan Sheikder Writing – Original Draft Preparation, Methodology, performed, Software, Writing – Review and Editing; Md Musa Haque Formal Analysis, Data Curation, Visualization.
Acknowledgements
Not applicable.
[Crossref] [Google scholar] [PubMed]
[Crossref] [Google scholar] [PubMed]
[Crossref] [Google scholar] [PubMed]
[Crossref] [Google scholar] [PubMed]
[Google scholar] [PubMed]
[Crossref] [Google scholar] [PubMed]
[Crossref] [Google scholar] [PubMed]
[Crossref] [Google scholar] [PubMed]
[Crossref] [Google scholar] [PubMed]
[Crossref] [Google scholar] [PubMed]
[Crossref] [Google scholar] [PubMed]
[Crossref] [Google scholar] [PubMed]
[Crossref] [Google scholar] [PubMed]
[Google scholar] [PubMed]
[Google scholar] [PubMed]
[Crossref] [Google scholar] [PubMed]
[Crossref] [Google scholar] [PubMed]
[Crossref] [Google scholar] [PubMed]
[Crossref] [Google scholar] [PubMed]
[Crossref] [Google scholar] [PubMed]
[Crossref] [Google scholar] [PubMed]
[Crossref] [Google scholar] [PubMed]
[Crossref] [Google scholar] [PubMed]
Citation: Sheikder C (2023) Assessing Cognitive Workload in Air Traffic Management using Cardio-Respiratory Sensor: A Performance Evaluation. J Aeronaut Aerospace Eng. 11: 316
Received: 06-Jan-2023, Manuscript No. JAAE-23-21278; Editor assigned: 09-Jan-2023, Pre QC No. JAAE-23-21278 (PQ); Reviewed: 24-Jan-2023, QC No. JAAE-23-21278; Revised: 31-Jan-2023, Manuscript No. JAAE-23-21278 (R); Published: 07-Feb-2023 , DOI: 10.35248/2168-9792.23.12.316
Copyright: © 2023 Sheikder C. This is an open-access article distributed under the terms of the Creative Commons Attribution License, which permits unrestricted use, distribution, and reproduction in any medium, provided the original author and source are credited.