Journal of Geography & Natural Disasters
Open Access
ISSN: 2167-0587
ISSN: 2167-0587
Research Article - (2025)Volume 15, Issue 2
This study aims to assess urbanization in Tizi-Ouzou, Algeria, employing two methodologies. The first involves creating a BAEMOLI map to extract built-up areas using indices such as NDBI OLI, NDVI OLI and MNDWI OLI. The second utilizes supervised classification to analyze urban growth across three time periods: 2009, 2015 and 2021. Initially, we apply the first method to gain a broad visual perspective of urban expansion within the wilaya’s regions. Recognizing its limitations in differentiating between bare land and urban areas, we complement it with the second method, offering a more granular analysis through quantification. This approach enables a precise examination of urbanization trends, supplemented by a future projection via the cellular automata Markov model. Our findings provide detailed insights and interpretations of urban sprawl across six regions in Tizi-Ouzou.
Urban sprawl; BAEMOLI; TIRS; NDBI; NDVI; MNDWI; Tizi-Ouzou; Sebaou valley
Post-independence, Tizi-Ouzou, Algeria, has experienced rapid, unstructured urbanization, primarily driven by demographic pressures, especially in the Sebaou Valley and Draa El Mizan depression. The 2018 RGPH Census, detailed in the DPSB’s statistical yearbook and corroborated by geomorphological studies published in the Mediterranean House of Human Sciences journal, identifies six distinct zones of homogeneity. This urbanization is exacerbated by natural population growth and migration from neighboring wilayas, with Tizi-Ouzou serving as a hinterland to Algiers due to its proximity. Significant infrastructure projects, such as the east-west highway and the Algiers-Tizi-Ouzou railway, have further consolidated TiziOuzou’s role as a residential hub for Algiers’ workforce. The region boasts significant facilities, including the Tamda university campus and the Tizi Ouzou hospital. To comprehensively analyze this rampant urbanization, remote sensing is employed, utilizing two distinct methods for an indepth study [1].
Study area
The Wilaya of Tizi-Ouzou, situated in greater Kabylia at the Djurdjura massif’s core, spans an area of 2,992.96 km² and is administratively segmented into 67 communes and 21 Dairas. As per the 2018 census, it boasts a population of 1,191,753, resulting in a density of 403 inhabitants/km². Geographically, Tizi-Ouzou lies in northern Algeria, bordered by Boumerdes to the east, Bejaia to the west and southwest, the Mediterranean Sea to the north and Bouira to the south like Figure 2. The detailed area distribution for each region is outlined in Table 1 and Figure 1.
|
Name of region |
Vocation |
Area |
% |
1 |
Coastal massif of azeffoun |
|
353.31 |
11.9 |
2 |
Hill of Grande Kabylie |
(Pastoral forestry agriculture) |
660.95 |
22.26 |
3 |
Massif of Grande Kabylie |
(Agriculture-Pastoral) |
934.39 |
31.47 |
4 |
Oued Sebaou Valley |
Polyculture |
496.51 |
16.72 |
5 |
Depression of Drâa el Mizane |
Polyculture |
144.65 |
4.87 |
6 |
Chain of Djurdjura |
|
379.22 |
12.77 |
|
|
Surface of wilaya T-O |
2969.03 |
100 |
Table 1: Area of homogenous region.

Figure 1: Homogenous zones of the wilaya of Tizi Ouzou.

Figure 2: Location of the study area.
Previous study on urban sprawl in Tizi Ouzou
Prior research on Tizi-Ouzou’s urbanization includes Said Doumane’s 2011 study, which focuses exclusively on the town of Tizi-Ouzou and an article by Mohamed Laiche and Mouloud Sadoudi discussing the city’s expansion to its eastern and western flanks. These works trace the historical urban growth and predict future expansion throughout the Oued-Sebaou valley. Another significant contribution is the “Cahiers Des CERAD” 2011 study, highlighting the role of large villages within the urban framework of Tizi-Ouzou, some with populations exceeding 6,000, contributing to the region’s urban classification. Furthermore, RAHMOUN Naima’s 2013 doctoral thesis delves into urban planning and the interplay between cities and villages in Algeria, with a specific focus on Tizi-Ouzou [2]. Our current study distinguishes itself by incorporating remote sensing a methodology not previously applied to Greater Kabylia thus offering new technological insights into the region’s urbanization.
This study investigates urban sprawl in Kabylia, employing remote sensing to map and analyze the expansion of built areas. The process begins with preprocessing spectral bands sourced from the USGS, tailored to the study’s geographical scope. Subsequently, a BAEMOLI map is generated to delineate builtup regions. The study then assesses the spatio-temporal dynamics of urbanization, contrasting it against natural and agricultural land changes. Finally, it employs the CA-Markov model to forecast Tizi-Ouzou’s future urban trajectory as illustrated in Figure 3.

Figure 3: Methodological framework of the study.
BAEMOLI: Built-up area extraction using OLI sensor
The methodology for extracting built-up areas from landsat-8 OLI imagery encompasses four primary steps:
Processing and examination: Implementing radiometric correction to the satellite data.
Image enhancement: Applying resolution fusion for improved image quality.
Extraction method development: Establishing a procedure to accurately delineate built-up regions.
Accuracy and evaluation: Assessing the precision of the extraction method.
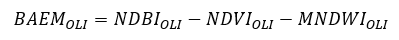
Post-processing spectral bands with ArcMap 10.8’s raster calculator, as referenced by the U.S. geological survey (2016, pp. 54-55), we proceed to calculate indices such as NDVIOLI, NDBIOLI and MNDWIOLI. These indices are integral to the creation of the BAEMOLI map, tailored to the study area.
The formula for calculating BAEMOLI, as per Bhatti and Tripathi, is given by:
Equation 1: Built-up area extraction map
Land use mapping via supervised classification
Utilizing ArcMap, we apply supervised classification to the multispectral image, tailored to our study area. We identify four primary classes: Urban areas, vegetation, bare soil (including seasonal crops) and water bodies. This classification process is systematically applied to satellite images from various periods to analyze land use changes over time as illustrated in Table 2 [3].
| Satellite image | Sensors | Date of acquisition | Date of downloads | Resolution |
| 1987 | ÃÂÂ (TM) | 31958 | 44407 | 60 m |
| 2000 | ETM+ | 36638 | 44408 | 14,25 m |
| 2009 | ETM+ | 39886 | 44408 | 30 m |
| 2019 | OLI/TIRS | 43686 | 44408 | 30 m |
| 2021 | OLI/TIRS | 44246 | 44397 | 30 m |
Table 2: Satellite imagery attributes for land cover mapping.
Land-use change simulation with cellular automata Markov model
The Markov Chain model is utilized to estimate land-use transitions from an observed period to a future period, providing a probabilistic forecast of changes. This model is recognized for its reliable prediction capabilities in land-use dynamics. The predictive equation for land-use changes is as follows:
Equation 2: Predictive land-use change equation
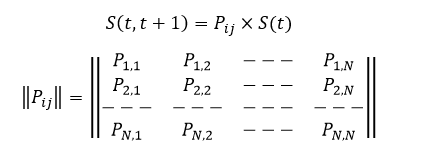
S (t): State of the system at time t
S (t, t+1): State of the system at time t+1 i.e., the consecutive state after S (t).
Pij: This is a transition probability matrix.
Pij: This is a transition probability matrix.
Numerical value of Pij can vary between 0 and 1 (0 ≤ Pij ≤ 1)
If the transition probability of a given Land Use/Land Cover (LULC) over a specified time frame is low, it approaches 0. Conversely, a high transition probability approaches 1.
CA-Markov model
The CA-Markov model integrates the Markov chain’s ability to manage temporal dynamics of land use/cover categories with cellular automata’s control over spatial dynamics through local rules or transition potential maps. This synergy is pivotal in geospatial sciences for predicting Land Use/Land Cover (LU/LC) trends and spatio-temporal patterns. The CA-Markov model accounts for the impact of land-use changes on natural, social and economic factors, providing a comprehensive view of regional development [4].
Validate model
The VALIDATE method enables the comparison of two maps sharing a common categorical variable, supporting up to 32,000 categories. Developed at Clark University by Gil Pontius, VALIDATE calculates seven critical values that form the foundation for measuring agreement and disagreement: N(n), N(m), H(m), M(m), K(m), P(m) and P(p). These statistics are computed for each resolution level, with mathematical definitions provided in Figure 3 as illustrated in Figure 4.

Figure 4: Mathematical formulas for validation metrics.
Generation of BAEMOLI
In the BAEMOLI analysis as illustrated in Figure 5, higher Digital Number (DN) values suggest a greater likelihood of pixels representing built-up areas, whereas lower values indicate non-built-up land cover classes. Visually, built-up areas are depicted as white, bright gray and light gray, contrasting with dark gray and black tones that signify other land cover types. Brighter tones correlate with denser built-up regions, while dimmer tones indicate sparser development.
A notable limitation of this method is its inability to differentiate between bare ground and built-up areas, leading to potential misclassification, especially in regions with significant fallow agricultural land. For instance, the Coastal Massif of Azeffoun, the Hill of Great Kabylie and the Djurdjura Chain predominantly display dark gray, suggesting minimal urban presence. Conversely, the Sebaou Valley and Dra El Mizan Depression exhibit lighter gray tones, which could erroneously imply extensive built-up areas due to the method’s inability to distinguish between bare soil and urban structures [5].
This visual analysis provides an overarching perspective of urban sprawl but lacks the detail and precision that figures and statistics could offer. The results are subject to the limitations of human visual interpretation and the method’s inherent inability to provide quantitative precision, unlike supervised classification. Nevertheless, this approach affords a broad understanding of the territorial dynamics within the Wilaya of Tizi-Ouzou.

Figure 5: BAEMOLI -Built-up area extraction map.
SPATIO-Temporal analysis via supervised classification
Land use and cover mapping for Tizi-Ouzou, 2019: Utilizing the Landsat 8 OLI sensor image from 09/08/2019, with a 30 m resolution, we selected representative sample points for four land cover classes: Urban Areas, Vegetation, Bare Soil and Water. Through supervised classification, we generated a land use map, which is depicted in Figure 6.

Figure 6: 2019 Land use map of Tizi-Ouzou Wilaya.
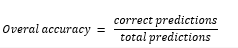
Accuracy assessment of supervised classification: For the accuracy assessment, we selected 21 points for urban areas and 20 points for other land use types, including vegetation, water, bare soil and seasonal crops. The classification achieved an accuracy of 91.36%, indicating high reliability (ESRI; GeoDev YouTube channel). This process will be replicated for other years, with results detailed in the confusion matrix presented in Table 3.
| Truth ground | |||||
| Predicted | Urban area | Vegetation | Bare soil and seasonal cultivation | W | ∑ |
| Urban area | 21 | 1 | 2 | 2 | 26 |
| Vegetation | 19 | 2 | 21 | ||
| Bare soil and seasonal cultivation | 16 | 16 | |||
| W | 18 | 18 | |||
| ∑ | 21 | 20 | 20 | 20 | 81 |
Table 3: Accuracy assessment confusion matrix for four land use classes
Equation 3: Confusion matrix
Statistical and regional analysis of Urban Sprawl (1987-2021): Employing consistent methodology, we generated land use maps for Tizi-Ouzou, focusing on regional divisions. Despite the 60m resolution limitation of the 1987 Landsat 4 imagery, a discernible pattern of linear urbanization along National Road No. 12 was observed. Urban development in the Oued-Sebaou valley has been influenced by various government policies, including economic reforms and development programs initiated by presidents A. Ben Bella and Boumediene. These policies led to significant urban expansion, particularly in fertile agricultural plains along the Sebaou valley and the establishment of an industrial fabric in accessible locations [6].
Comparative analysis of land use from 2000 to 2021 reveals notable vegetation coverage in 2000, with subsequent periods showing the emergence of bare soil due to extreme drought conditions, especially in 2009 and 2021. The pronounced urban fabric in 2000 can be attributed to the land orientation law of November 18, 1990, which promoted industrial development in the Oued-Sebaou region. Over time, this spatial dynamic has been exacerbated by the prioritization of industrial and tertiary sectors over agriculture, leading to extensive urbanization that has transformed not only the agricultural plains but also previously depopulated mountainous areas as illustrated in Figure 7.

Figure 7: Evolution of land use and cover (1987-2021).
Projecting land use for 2040 with the CA Markov model: The CA Markov model forecasts land use transitions by employing a matrix that quantifies the likelihood of each land category evolving into another over a defined period. This transition probability matrix is a key tool for predicting spatial changes and informing future land use planning as illustrated in Table 4 and Table 5.
| 2022 | ||||
| 2015 | Urban area | Vegetation | Bare soil and seasonal cultivation | Water |
| Urban area | 0.6471 | 0.3441 | 0.0087 | 0 |
| Vegetation | 0.3189 | 0.6779 | 0.0032 | 0 |
| Bare soil and seasonal cultivation | 0.3161 | 0.6706 | 0.0133 | 0 |
| Water | 0.7834 | 0.0128 | 0.0014 | 0.2024 |
Table 4: Transition probability matrix (2015-2022) This table illustrates the probabilities of land category transitions within TiziOuzou.
| 2015 | ||||
| 2009 | Urban area | Vegetation | Bare soil and cultural seasonal | Water |
| Urban area | 0.479 | 0.4867 | 0.0342 | 0.0001 |
| Vegetation | 0.1697 | 0.733 | 0.0973 | 0.0001 |
| Bare soil and cultural seasonal | 0.4899 | 0.2982 | 0.2119 | 0 |
| Water | 0.1736 | 0.7658 | 0.0451 | 0.0156 |
Table 5: Land category transition probabilities (2009-2015) for Tizi-Ouzou.
In this step, the transition matrix was utilized to generate a series of conditional probability images, as depicted in Figure 8.

Figure 8: Conditional probability images: (a) Urban, (b) Vegetation, (c) Bare soil and seasonal cultivation, (d) Water.
Validation of the simulation map 2021 and the actual 2021 map
A simulation was conducted using the CA-Markov model through the Idrissi software, utilizing a 2015 Land Use and Land Cover (LULC) map to forecast its evolution by 2021. Subsequently, the simulated LULC map was compared with an actual LULC map from 2021 to assess precision levels. The focal point of interest in Table 6 is the Kappa standard value, which is calculated at 0.6795 in Table 7, indicating good precision. This level of accuracy enables the projection of land use patterns into 2040 [7].
| Information of quantity | |||
| Information of allocation | No (n) | Medium (m) | Perfect (p) |
| Perfect (P(x)) | P(n)=0.6227 | P (m)=0.9369 | P (p)=1.0000 |
| Perfect stratum (K(x)) | K(n)=0.6227 | K (m)=0.9369 | K (p)=1.0000 |
| Medium grid (M(x)) | M(n)=0.5213 | M (m)=0.7941 | M (p)=0.8177 |
| Medium stratum (H(x)) | H(n)=0.2000 | H(m)=0.3575 | H (p)=0.3440 |
| No (N(x)) | N(n)=0.2000 | N(m)=0.3575 | N (p)=0.3440 |
Table 6: Classification agreement/disagreement based on the ability to accurately specify quantity and allocation.
| Agreement chance=0.2000 | Disagree quantity=0.0631 |
| Agreement quantity=0.1575 | K no=0.7426 |
| Agreement strata=0.0000 | K location=0.7535 |
| Agreement gridcell=0.4366 | K location strata=0.7535 |
| Disagree gridcel=0.1428 | K standard=0.6795 |
| Disagree strata=0.0000 |
Table 7: Values of agreement-disagreement parameters.
After generating the simulated 2040 map and converting it to ASCII format in Idrissi software, we then reconverted the ASCII-formatted map back to a raster format in ArcMap to observe the resulting output displayed in Figure 9.

Figure 9: LCLU simulation for 2040 using the CA-Markov model.
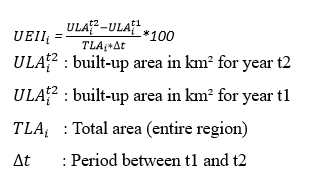
Calculation of the urban extension density index: To calculate this index, Equation 2 from Akubia and Bruns is employed. The urbanization density index serves to analyze the quantitative spatial extension variances within an area, known as the ‘preference for urban growth’ phenomenon. It aids in determining the urban growth preference for a specific period, potential future development directions and evaluating prospective urban expansions. Additionally, it facilitates the comparison of the rate or intensity of urban area changes across different periods.
Equation 4: Urban Sprawl intensity index
Urban growth rhythm analysis for each region and Wilaya
First, calculate urban growth by region using data from Table 8 to obtain Table 9. Then, apply equation 4 to the results from Table 9. We derived the results presented in Table 10 for each region and Table 11 for the Wilaya. Notably, an index value exceeding 1.29 signifies very rapid urban growth, values between 1.05 and 1.29 indicate rapid growth, values from 0.59 to 1.05 denote medium growth, values between 0.28 and 0.59 reflect slow growth and values below 0.28 represent very slow growth [8].
| Urban area km2 | ||||||
| Years | Coastal massif of azzefoun | Hill of great Kabylie | Massif of great Kabylie | Oued Sebaou valley | Depression of Draa el Mizane | Djurdjura mountain range |
| 2009 | 15.89 | 39.67 | 51.77 | 58.04 | 9.2 | 81.43 |
| 2015 | 26.22 | 139.3 | 143.82 | 114.02 | 39.89 | 131.63 |
| 2021 | 98.93 | 272.82 | 344.38 | 168.36 | 51.41 | 134.68 |
| 2040 | 100 | 239.1876 | 366.399 | 259.8687 | 79.1298 | 192.7755 |
Table 8: Urban area by region (km2).
|
|
Cm. Azzefoun |
Hill G. Kabylia |
M great Kabylia |
Oued Sebaou |
D.D Mizane |
Djurdjura |
|
2009-2015 |
10.3 |
99.6 |
92.1 |
56 |
30.7 |
50.2 |
|
2015-2021 |
72.7 |
133.5 |
200.5 |
54.3 |
12 |
3.1 |
|
2021-2040 |
1.07 |
27.37 |
22.02 |
91.51 |
27.72 |
58.1 |
Table 9: Observed urban growth by region (km2) between 2009, 2019 2021 and 2040.
| C.M azzefoun | Hill of great Kabylie | MG. Kabylie | O. Sebaou valley | D.D el mizane | Djurdjura | |
| 2009-2015 | 0,48 | 4,67 | 4,31 | 2,62 | 1,44 | 2,35 |
| 2015-2021 | 3,41 | 6,25 | 9,39 | 2,55 | 0,54 | 0,14 |
| 2021-2040 | 0,016 | 0,22 | 0,12 | 0,97 | 1,01 | 0,81 |
Table 10: Index of urban expansion intensity.
| UE intensity Index | Growth rate | |
| 2009-2015 | 1.91 | Fast growth |
| 2015-2021 | 2.68 | Very fast growth |
| 2021-2040 | 0.4 | Low growth |
Table 11: Urban growth rate for the wilaya.
In summary, the rapid urban growth observed during 2009-2015 can largely be attributed to state and private sector initiatives aimed at mitigating the housing shortage. This growth was further exacerbated by unauthorized constructions that flouted urban planning regulations, compounded by infrequent urban police interventions and a lack of penalties for violations. From 2015-2021, the growth rate intensified significantly due to demographic expansion, increased purchasing power and the emergence of the middle class. Although simulations predicted modest growth, the actual expansion in the fertile Oued Sebaou valley was substantial, posing a serious threat to agricultural lands due to unchecked urban development [9].
The initial method for mapping built-up areas provided valuable insights. It revealed the extent of urbanization's impact on fertile regions like the Oued-Sebaou Valley, Drâa El Mizan depression and Grand Kabylie. However, the method's inability to distinguish between urban areas and bare soil led to overestimation.
Therefore, supervised classification was employed for different periods. In 2019, urbanization percentages were similar across regions, with a maximum of 40.84% in Grand Kabylie and a minimum of 27.80% in the coastal Massif of Azeffoun.
For the space-time study (2009-2021), the urban extension density index revealed an acceleration in urbanization. The wilaya transitioned from rapid growth (2009-2015) to very rapid growth (2015-2021).
The predicted map for 2040 suggests low growth in most areas due to the mountainous terrain of Grand Kabylie. However, the Oued-Sebaou Valley is expected to experience average growth, which is concerning for this agricultural region housing Algeria's most fertile lands.
The raw data needed to reproduce the above results can be downloaded freely. The processed data necessary for the reproduction of the above results are available for download
I declare that I have received no funding for this research.
Citation: Belaid L, Amine N (2025) Assessing and Predicting Urban Sprawl in Tizi-Ouzou, Algeria: A GIS and Remote Sensing Approach with CA Markov Model. J Geogr Nat Disasters. 15:340.
Received: 08-Jul-2024, Manuscript No. jgnd-24-32706; Editor assigned: 11-Jul-2024, Pre QC No. jgnd-24-32706 (PQ); Reviewed: 25-Jul-2024, QC No. jgnd-24-32706; Revised: 12-Apr-2025, Manuscript No. jgnd-24-32706 (R); Published: 19-Apr-2025 , DOI: 10.35841/2167-0587.25.15.340
Copyright: © 2025 Belaid L, et al. This is an open-access article distributed under the terms of the Creative Commons Attribution License, which permits unrestricted use, distribution and reproduction in any medium, provided the original author and source are credited.