Advances in Automobile Engineering
Open Access
ISSN: 2167-7670
ISSN: 2167-7670
Research Article - (2018) Volume 7, Issue 2
The objective of the present research is twofold; first to assess the level of safety compliance practices among artisans and secondly, to measure the impacts of unplanned lost time emanating from accident on time performance of small-scale auto maintenance firms. Ninety different auto-maintenance jobs executed by automobile, heavy duty, generator and panel beater auto firms between, Januarys to December, 2016 were analyzed using direct observation. Furthermore, primary data collected were analyzed using MS Excel 2013 and Minitab 17 software. Results revealed the mean performance rating of workshops on the availability and usage of personal protective equipment as 143.9 and 154.7. While 224.2 and 302.7 constitutes respective poor usage rate and non-availability of personal protective equipment in the respective workshops. Results further revealed 58.2% as average productive lost time rate resulting from accident occurrence. Conversely, regression analysis revealed that a unit increase of 659.2, 63.5 and 82.8 in accident, severity and lost time index, caused a decreased of -150.8 in overall productivity lost factor. With a coefficient of determination (R2 ) of 72.01% at p-value less than 0.005. Hence, a positive and significant relationship between accident and auto mechanics time performance exist. Therefore, sensitization of stakeholders in this sector on the usage of personal protective equipment and the need to make safety their priority as well as regular inspection for safety compliance by regulatory bodies are recommended to build customers trust and improve productivity in this sector
Keywords: Automotive maintenance; Safety measures; Accident index; Severity index; Lost time index; Productivity
Aindex: Accident Index; Atime: Actual time; No: Number of Observation (90); P.time: Planned Time; Sindex: Severity Index; Tindex: Time Index; ɑ: Constant Expressing Weighting Given to Each Factor, at i = 1, … … …4; βo: Constant Estimated by Regression Model; β1,β2,β3: Coefficients of Explanatory Variable; b: Frequency of the Occurrence; OPLF: Overall Productivity Lost Factor; PLTR/LOP: Productive Lost Time Rate; N: Total Number of Occurrence; i: Recordable Accident within the Period; w: Number of Workers Performing Maintenance
Dhillon [1] described maintenance as an appropriate action made for retaining an item/part/equipment, or restoring it to a given condition. Concisely, maintenance is undertaken to restore broken equipment’s, preserve equipment conditions and prevent their failure, which ultimately reduces production loss and downtime as well as the associated safety hazards. In Nigeria, large proportion of auto maintenance firms are classified as “small scale”. This classification emanates from the low capital output ratio of the sector, which is the ratio of capital level relative to output [2]. SMS automotive maintenance firms are vital to human resources in the automobile industry in virtually every nation’s economy due to its significant contribution in terms of job creation. Kayemuddin and Kayumm [3] described the automotive maintenance workshop as a category of small scale industry that contributes about 8.8% to the GDP of a nation’s economy. In Nigeria, the industry records about 3billion as turnover annually, to the local economy according to the regulatory body of mechanics in Nigeria, National Automobile Technicians Association (NATA) in its report “Nigeria economy and the mechanic” of October 12, 2012. Auto mechanics are involved in the repairs and maintenance of automotive facilities such as vehicles and generating plants to enhanced optimum performance when they breakdown [4]. Other task includes replacement of worn mechanical parts that can cease transmission or prove unsafe for effective operation [5]. Small and medium scale auto maintenance firms are characterized by preventive and corrective maintenance. Preventive maintenance is defined as a series of pre-planned tasks performed on auto facility either according to manufacturer’s schedule to counteract the known causes of potential failures of the intended functions of an asset [6]. Preventive maintenance (PM) plays vital roles to mitigate if possible avoid potential stoppages and disruptions of equipment or machinery from occurring in daily operations. While corrective or breakdown maintenance, is performed when a system or machine fails. It includes repair and replacement of failed parts to create an optimal performance again. Corrective maintenance activities are, in contrast to preventive maintenance, not schedulable [7]. This makes them harder to plan and more costly to perform. However, hardly are these activities or maintenance by auto mechanics completed without hazards, thereby stimulates negative effects such as time delay, increased costs, and productivity loss. The imbalance relative to safety compliance among auto mechanics during maintenance has significantly impacted performance time and is a major concern [8,9]. Industrial safety, health and environmental management opined that in order to meet the different needs which are seen in the present day industrial environment which demands increased production, high efficiency, and cost control etc. The subject of safety, health and environment must come into play; otherwise any neglect in these aspects can prove very costly. Neglect of safety at any stage can result into disasters leading to loss of human life and production. Thus, it is imperative to evaluate the level of accident/ injuries and safety compliance in small scale auto maintenance firms and its impact on time performance.
An accident is defined as any unplanned event that result in the combination of the following consequences; physical injury, lost time case, loss of property and number of fatalities [10]. While safety measures are facilities and strategies that are put in a workplace placeto prevent or reduce accident during various stages of project [11]. Accordingly, Oisamoje, and Enaruna [12] defined health and safety management as an area that is concerned with ensuring the safety, health and welfare of people engaged in work or employment. Consequently, there are several risks which expose auto mechanics to workplace accidents/ injuries in the automotive maintenance workshops. Some of these risks include exposure to chemicals, strenuous work postures, and the use of improperly specified tools and lack of safety compliance [13,14,15], thus, affecting their performance. However, to efficiently regulate an issue, one should satisfactorily define the problem. Bozena [16], opined that the level of accident in a particular sector like the construction industry is estimated by the labor force in the analyzed sector, the number of victims of accidents at work and the number of days lost resulting from accident at work. The Statistical Office of the European Communities (Eurostat), established specific indicators that enables any company to report their number of accident and accident index (defined as the number of accidents per 100,000 working persons). Also, the Office of Environmental Health and Safety, established specific models that enable any firm to report their recordable incident rates, lost time rates, and severity rates, so that they can be compared with other industry or group. According to OEHS, the standard base rate for the calculations is based on a rate of 200,000 labor hours. This number (200,000) equates to 100 employees, who work 40 hours per week, and who work 50 weeks per year. Using this standardized base rate, any company can calculate their rate(s) and get a percentage per 100 employees. However, one of the limitations about this approach is that none of the above indicators provides any evidence about the achieved values of productivity indices. It is therefore proposed in the current study to take productivity indices, e.g. delivery efficiency into account in accident level assessments of automotive maintenance firms. This is because unplanned idle time resulting from industrial accidents reduces real time productivity and increases delay. Downtime or lost time refers to the variation between the estimated finish and the actual finish time of a task either resulting from ill health or injuries/ accident. Lost time is an imperative issue in industries because of its relation to productivity and business profitability [17]. Evaluating the causes and impacts of accident/injuries on productivity performance in automotive maintenance workshops, has become a necessity. Because productivity rises as the number of incident related cases reduces, and the use of properly designed tools increases [18]. Hence, the objective of this paper is to explore the implications of using improperly designed tools and lack of safety compliance as well as accident/injuries cases on lost time.
Primary data used in the current study were basically obtained through survey design approach with direct observation of two automotive maintenance workshops each sampled across forty- five different small scale auto firms, amounting to ninety observations. This comprises of heavy duty, automobile, generator and panel body auto firms caught across the seven layouts (Eight-Mile, Diamond Hill, Anantigha, Essien Town, Ikot Enobong, Big-Qua Town and Etta-Agbor) in Calabar metropolis where SMS auto firms are found in their large numbers. Each auto firms had a work force of at least four to six artisans performing different repairs at a duration of 8hours daily (i.e. the peak hours of industrial activities), for 6days per week, excluding Sundays, for a period of twelve months between January to December 2016. The data collected was tabulated and classified according to maintenance characteristic (i.e. initial and actual final time, actual performance, number of incident/injuries that resulted to lost days overrun cost and time, and the severity rate of incident). This was done to ensure that all variables considered were clearly defined. Furthermore, Microsoft Excel 2013 and Minitab 17 statistical tools was used for analyses of the data. Additionally, the analysis on proper usage and safe handling of tools were ranked by the measurement of the relative index ranging from (1= Excellent, 2= Very Good, 3= Poor, 4= none). Where 1 to 3 implies the level of usage or availability of tools impact (Ibrahim, 2012), to ascertain the mean rating of each response on safety compliance in SMS auto maintenance firms..
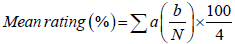 (1)
(1)
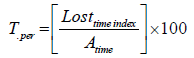
Equation [2-5] defines the magnitude of lost time index, time index, time performance achieved and productive lost time rate of each project at completion[19,20,21,22].
 (2)
(2)
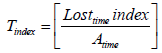 (3)
(3)
 (4)
(4)
 (5)
(5)
Also, equation [6] defines the overall productivity lost factor (OPLF) of each auto firm’s project executed.
 (6)
(6)
OPLF helps to break down the reasons for productivity losses into three main factors, which include; accident index, lost time index and severity. Ideally, one fundamental area that every organization can improve upon is productive efficiency/conformity and one of the best measures is OPLF. A possible explanation to this argument is that organizational efficiency has relevance for business profitability.
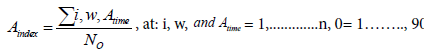
Accident index and severity for each sector was determined as expressed in [equation 7 and equation 8].
 (7)
(7)
Accident index measures the productive time losses resulting from accident from a predetermined sample. And is calculated by dividing the number of incident/injuries in each sector by the total number of observation,
 (8)
(8)
The severity index quantifies the average number of working days lost due to a worker’s involvement in minor and serious accidents. Furthermore, multivariate linear regression analysis in MS Excel and Minitab 7.1 statistical tools were used to establish the relation between overall productivity lost factor (OPLF) from accident index, lost time and severity index, and graphs plotted accordingly. The element of multivariate regression is expressed in equation [9].
 (9)
(9)
Figure 1 shows that superficial wounds, burns injuries, and was prevailing among panel body work auto mechanics with an average of 28.1% and 18.7%. Similarly, dislocation injuries/accident was common among heavy duty firms with an average of 44.4% been the highest. This group of auto technicians have to constantly lift heavy items which can strain their back, adopt awkward postures and may spend long hours bent over or lying on their back. Furthermore, cuts and bruises incident cases were found to be common with generator firms. A possible explanation to these findings is that most of this firms lack the basics personal protective equipment, and as such they fail to use them. For instance, auto mechanics in panel beater auto firms reported being aware of the hazards associated with their jobs when interviewed, but stated that awareness did not seem to help reduce the health problems they suffered.

Figure 1: Accumulated injuries/accident rating of automotive maintenance firms.
The analysis on proper usage and safe handling of tools, as depicted in Figure 2, shows that about 55.1% of automotive maintenance firms, lack the ability to handle hand tools before and after each maintenance tasks. While about 19.2% averagely practiced safe handling of hand tools. Also, averages of about 16.6% of these workshops do not even consider the handling of tools as a safety measure to be observed. Also, the proper usage of power tools was marginal with an average of 32.0%. While 28.2% didn’t make any attempt within the period under consideration. The proper usage of compressed air equipment was found to be 2.5% on the average, while 12.8% observed the safety rules of wearing safety glasses or face shield during operation to avoid metal particles into the eye. Also about 29.4% used this equipment poorly by not observing the safety rules, with unavailability of 55.1%. Also, from the result as depicted the proper usage of hydraulic/hoist equipment by auto mechanics was at an average 61.5% and 34.6% marginally applied the safety rules while using it, and 3.8% used it but never considered safety precaution at all level. Furthermore, Figure 2 reveals that only 18.5% auto mechanics appropriately used chain hoist and crane when lifting an automobile engine from the sitting. While 14.2% auto mechanics marginally used chain hoist well and unavailability of 67.1% on the average. This is basically found among un-standardized workshops, as they lift engine manually using their hands. It was obvious from that safety practice towards equipment maintenance was lacking in most of the repair firms as majority of these mechanics fail to ensure effective cleaning of equipment/tools before and after use. The unavailability of fire extinguisher among the auto repair firms was on the high side with an average value of 58.9%, while about 20.5% had it in their workshop, but weren’t in good condition. Except for few workshop which had in it good operational condition with an average of 6.4% and 14.1% respectively. According to survey the unavailability of goggles and face shield among auto technicians, especially panel bitters was on the high side with an average value of 70.59%, while about 22.06% had it in their workshop, but was in poor condition. From analysis the unavailability of hand gloves and safety boot among the auto firms was high with an average of 79.69% (approximately 80%). This implies that most local mechanics violate the rule of wearing safety personal protective (e.g. gloves and safety boot) equipment when working. This is because most of the local mechanics were of the opinion that protective equipment must be provided by their masters or owners of the workshops.

Figure 2: Analysis of Availability and Proper Usage of and safe handling of tools.
(Figures 3-6) reveal the need to maintain close link between time performance and lost time resulting from injuries/accident related cases. Obviously, as time performance (efficiency) reduces, lost time increases. This implies that the relationship between time performance and productivity is inversely proportional i.e. the higher the time efficiency rate, the lower the productive time losses and equally, the lower the time efficiency rates, the higher losses in productivity.

Figure 3: Summary of time performance and loss time in Automobile auto firms.

Figure 4: Summary of time performance and loss time rate in Generator auto firms.

Figure 5: Summary of time performance and loss time rate in Heavy duty auto firm.

Figure 6: Summary of time performance and loss time rate in Panel beater auto firms.
Table 1 presents the summary of comparative analyses of time performance and lost time rate inherent in each auto firms.
| Industry Name | No. of jobs executed | Planned time (cumulative ) (days) |
Actual time (cumulative) (days) |
Lost time index | Time index | Time performance factor |
Productive lost time rate % |
|---|---|---|---|---|---|---|---|
| Automobile | 20 | 32 | 65 | 33 | 0.507 | 50.7 | 49.3 |
| Generator | 35 | 68 | 124 | 56 | 0.451 | 45.1 | 54.9 |
| Heavy duty | 20 | 51 | 91 | 40 | 0.439 | 43.95 | 56.1 |
| Panel beaters | 15 | 114 | 176 | 62 | 0.352 | 35.2 | 64.8 |
| Total | 90 | 265 | 456 | 191 | 0.418 | 41.8 | 58.2 |
Table 1: Time analysis of time performance rating and productive lost time rate.
In order to determine the overall productivity lost factor (OPLF) of each auto firms, the index of accident, lost time index and severity index values were computed as depicted in Table 2. Within these auto maintenance sectors, the accident index range between 0.133, 0.111, 0.155, and 0.277 for automobile, generator, heavy duty and panel beater auto firm. This implies that panel beater autos firms recorded the highest number of injuries with an accident index of 0.277. Thus, recording lost time index of 62 and 2.48 as severity index and 42.69% as overall productivity lost factor. This is repeated for automobile, generator, and heavy duty auto firms respectively as presented in Table 2.
| Industry Name | Number accident/injuries | Accident index | Lost time index | Severity index | Overall productivity lost factor (OPLF) % |
|---|---|---|---|---|---|
| Automobile | 12 | 0.133 | 33 | 2.75 | 12.06% |
| Generator | 10 | 0.111 | 56 | 5.6 | 34.80% |
| Heavy duty | 14 | 0.155 | 40 | 2.85 | 17.67% |
| Panel beaters | 25 | 0.277 | 62 | 2.48 | 42.59% |
Table 2: Summary of overall productivity lost factor of auto firms.
An explanation to these findings is that artisans in panel beater auto maintenance firms constantly get in contact with hot surfaces, exhaust pipes, radiator and cooling system pipes, soldering and welding operations due to the nature of maintenance practices.
Furthermore, Table 3 shows the result of the multivariate liner regression model formulated to relate overall productivity lost factor with accident index, lost time and severity index as presented in equation (9). Table 3 indicates that the accident index has a beta coefficient (β0) of 659.2 at a probability value of 0.000 < 0.05. Hence, it is significant. This indicates that OPLF decrease by -150.8 when accident index increases by 659.2 when all other independent variable is held constant. For every unit rise in accident index, there was a unit decrease in overall productivity lost factor.
| Coefficient | Standard Error Coefficient | T-Value | P-Value | VIF | |
|---|---|---|---|---|---|
| Constant | -150.8 | 46.1 | -3.27 | 0.002 | |
| Accident index | 659.2 | 82.6 | 7.98 | 0.000 | 1.43 |
| Severity index | 63.5 | 29.7 | 2.14 | 0.036 | 1.76 |
| Lost time index | 82.8 | 22.3 | 3.71 | 0.000 | 1.95 |
Regression Analysis: OPLF versus Accident index, Severity index, and lost time index.
R2 = 72.01%, R2 (adj) = 71.03%, F-Value = 73.75, P-Value = 0.000
Table 3: Regression Analysis: OPLF versus Accident index, Severity index, and lost time index.
It can then be inferred that accident index has an impacts on overall productivity lost factor. The data further revealed that severity index has a coefficient of 63.5 at a probability value of 0.036 less than 0.05. Hence, it is significant, this indicates that, for each unit increase in severity index, there is a corresponding decrease of -150.8 in overall productivity lost factor when all other independent variables are held constant. Similarly, the data further reveals that lost time has a coefficient of 82.8 at p-value 0.000<0.05. This equally indicates that an increase of 82.8 in lost time caused a reduction of -150.8 in overall productivity lost factor when all other independent variables are held constant. Coefficient of determination (R2) = 72.01%. This indicates that all variations in the dependent variables are as a result of the independent variables. That is, 100% variation in overall productivity factor is as a result of changes in accident index, severity index and lost time.
The impacts of unplanned lost time emanating from accident/ injuries on time performance of small-scale automotive maintenance firms has been evaluated using descriptive analysis and multivariate linear regression technique. Descriptive analysis of ninety auto maintenance jobs executed across Automobile, Heavy duty, generator and panel beater auto firms between January to December, 2016 revealed the mean performance rating of workshops on the availability and usage of appropriate protective equipment were determined as 143.9 and 154.7 respectively while 224.2 and 302.7 constitutes respective poor usage rate and non-availability of appropriate safety equipment in the workshops. Results further revealed an average productive lost time of 58.2% resulting from accident/injuries. Conversely, regression model formulated revealed that a unit increase of 659.2, 63.5 and 82.8 in accident, severity and lost time index, caused a decreased of -150.8 in overall productivity lost factor. With a coefficient of determination (R2) of 72.01% at probability value less than 0.005. Hence, it is concluded that compliance to appropriate safety practice in this sector is very poor due to nonchalant attitude of the operators of these firms toward safety practices as well as inadequate diagnoses tools and supervision by regulatory agencies. Therefore, sensitization of stakeholders in these sectors on the need to make safety their priority and regular inspection of these firms for safety compliance by regulatory bodies is recommended to build customers trust and improve productivity in this sector.
This study could also be extended to other local artisans in the small scale industries such as auto electric technicians, etc.; in Nigeria to possibly identify the risks associated with non-safety compliance and the impacts of occupational accident on productivity performance.