Journal of Drug Metabolism & Toxicology
Open Access
ISSN: 2157-7609
ISSN: 2157-7609
Research Article - (2023)Volume 14, Issue 1
In this study, we developed various Quantitative Structure-Activity Relationship (QSAR) models for the 1,1-diphenyl-2-picrylhydrazyl (DPPH) and 2,2-azino-bis-3-ethylbenzthiazoline-6-sulphonic acid (ABTS) experimental values of 55 phenolic antioxidants based on Conceptual DFT descriptors calculated with the Density Functional Tight Binding (DFTB) GFN1-xľB. Machine learning algorithms were used for feature selection and regression analysis, and Leave-One-Out Cross-Validation was used for both multiple linear regression (MLR) and sequential minimal optimization regression (SMOreg). For ABTS activity, two models were obtained with a correlation coefficient of 0.94 (MLR) and 0.92 (SMOreg). For DPPH activity, two models were obtained with a Correlation Coefficient of 0.93 (MLR) and 0.91 (SMOreg). The number of phenolic groups in the molecule, Bond Dissociation Enthalpy and radical Fukui of the most active phenolic oxygen were enough to properly predict the Radical Scavenging Activity (RSA) of phenols. Both developed QSAR models were carried out following the Organisation for Economic Co-operation and Development (OECD) recommendations on QSAR models. Considering the importance of antioxidant activities in medicine, pharma, and food industries, this study proposes a highly valuable and cheap method. It is also extremely easy to understand as we need only three descriptors that are directly related to the known chemistry of the substances.
QSRA; DPPH; Oxidative Stress; Phenolic Structure
An imbalance between the production of Free Radicals (FR) and the ability of an organism to quench and eliminate those species leads to a series of, most often, unwanted effects (aging, cancer, peptic ulcers, and others). This process is called Oxidative Stress, which can be caused by a series of factors when endogenous and exogenous chemicals are the most recurrent ones. Most of the endogenous and exogenous FR humans are exposed to are Reactive Oxygen Species (ROS, mostly small inorganic or organic molecules derived from oxygen, very common examples are O2• − and H2O2 ) and Reactive Nitrogen Species (RNS, mostly small inorganic or organic molecules containing nitrogen). As is to be expected, ROS are much more reactive than other species; hence the study of Oxidative Stress and related topics is usually focused on those oxygen-containing species. Biological systems usually present Antioxidant (AOx) mechanisms to help them cope with these damaging species. Antioxidants can also be divided in endogenous and exogenous. Many endogenous antioxidants are enzymes (for example, superoxide dismutase); albumin and bilirubin are examples of non-enzymatic endogenous antioxidants. Organisms can use exogenous AOx obtained from nutrition to compensate for possible deficits in the ratio of AOx and FR, although today, we also have supplements and other pharmaceutical applications. The most common exogenous AOx are phenolic compounds [1,2]. Predicting the antioxidant activity is also extremely valuable for medicinal chemists and pharmaceutics, as many drugs have their therapeutic effects via antioxidant activity. This has been known for many years in the industry and the scientific community [3].
It is known that phenolic compounds tend to undergo one of two reaction mechanisms for quenching FR. Here ArOH corresponds to the phenolic AOx, and R• is the FR to eliminate. It is important to note that both mechanisms result in the same products. One mechanism will be preferred over the other depending on the structure of the AOx compound, pH, and polarity of the solvation media [4,5].
1. Hydrogen Atom Transfer (HAT): R• + ArOH RH + ArO•
2. Single Electron Transfer -Proton Transfer (SET-PT):
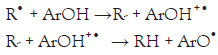
Please note that the Rate-Determining Step (RDS) of the HAT mechanism corresponds to the homolytic rupture of the O-H bond, while for the SET mechanism, the RDS is the single transfer of one electron from the ArOH to the R• . Hence, we will focus on these two RDSs for the in silico prediction of the Radical Scavenging Activity (RSA). 2, 2’-azino-bis-3-ethylbenzthiazoline-6- sulphonic acid (ABTS) and 1, 1-diphenyl-2-picrylhydrazyl (DPPH) are RSA tests very commonly used in the scientific community to assess the AOx activity. Even though both studied RSA tests were initially developed to test the HAT mechanism, it has been shown that both ABTS and DPPH may incur in HAT and SET mechanisms [6].
The present work presents a QSAR study to develop predictive models for the RSA of phenolic compounds. The QSAR endpoints of this study are the ABTS and DPPH tests results reported by [7] for 55 phenolic compounds isolated from a Chinese herb see (Table 1) for experimental data and (Supplementary Figure 1) for molecular structures. Density Functional Tight Binding (DFTB) approach was used to calculate physico-chemical properties of the compounds. Both global and local reactivity descriptors based on Conceptual DFT (CDFT) [8] and some reaction enthalpies were calculated. The number of phenolic groups in the structure was also considered as a structural descriptor (more details in Materials and Methods). Hydrogen Transfer for the HAT mechanism was approached by calculating the Bond Dissociation Enthalpy (BDE) of the compound’s phenolic hydrogens. The SET mechanism was approached by calculating the energies of the Frontier Molecular Orbitals and some CDFT descriptors described below related to electronic charge and movement. The energy of frontier molecular orbitales HOMO and LUMO, and some of their derivated descriptors, were also taken into consideration.
| N° | CAS | ABTS (mM) | DPPH (mM) | N° | CAS | ABTS (mM) | DPPH (mM) |
|---|---|---|---|---|---|---|---|
| 1 | 327-97-9 | 1.560 | 1.750 | 29 | 7770-78-7 | 0.104 | 0.085 |
| 2 | 583-17-5 | 0.930 | 0.840 | 30 | 528-43-8 | 0.209 | 0.197 |
| 3 | 588-30-7 | 0.820 | 0.750 | 31 | 81-54-9 | 1.930 | 2.000 |
| 4 | 69-72-7 | 0.037 | 0.052 | 32 | 72-48-0 | 1.070 | 1.050 |
| 5 | 99-06-9 | 0.025 | 0.069 | 33 | 81-64-1 | 0.548 | 0.035 |
| 6 | 99-96-7 | 0.028 | 0.059 | 34 | 478-43-3 | 0.076 | 0.056 |
| 7 | 121-34-6 | 0.092 | 0.056 | 35 | 481-74-3 | 0.069 | 0.042 |
| 8 | 1257-08-5 | 5.290 | 5.260 | 36 | 521-61-9 | 0.068 | 0.073 |
| 9 | 970-74-1 | 3.710 | 3.560 | 37 | 481-72-1 | 0.077 | 0.044 |
| 10 | 154-23-4 | 3.040 | 2.950 | 38 | 117-12-4 | 0.076 | 0.073 |
| 11 | 482-35-9 | 2.390 | 2.160 | 39 | 84-60-6 | 0.072 | 0.076 |
| 12 | 153-18-4 | 2.020 | 2.330 | 40 | 481-39-0 | 0.105 | 0.088 |
| 13 | 522-12-3 | 2.180 | 2.570 | 41 | 331-39-5 | 1.310 | 1.240 |
| 14 | 30311-61-6 | 1.560 | 1.630 | 42 | 99-50-3 | 1.150 | 1.290 |
| 15 | 487-52-5 | 2.420 | 2.270 | 43 | 989-51-5 | 5.950 | 6.090 |
| 16 | 94344-54-4 | 1.930 | 1.820 | 44 | 480-16-0 | 2.680 | 2.750 |
| 17 | 36338-96-2 | 1.430 | 1.360 | 45 | 520-18-3 | 1.590 | 1.320 |
| 18 | 491-70-3 | 2.180 | 2.240 | 46 | 548-83-4 | 1.120 | 0.705 |
| 19 | 480-40-0 | 0.081 | 0.053 | 47 | 60-82-2 | 1.790 | 1.240 |
| 20 | 5373-11-5 | 1.470 | 1.390 | 48 | 40957-83-3 | 0.097 | 0.020 |
| 21 | 578-74-5 | 0.083 | 0.050 | 49 | 529-59-9 | 0.077 | 0.026 |
| 22 | 10236-47-2 | 0.098 | 0.077 | 50 | 10083-24-6 | 2.530 | 2.350 |
| 23 | 520-26-3 | 0.104 | 0.075 | 51 | 92-61-5 | 0.383 | 0.210 |
| 24 | 486-66-8 | 0.101 | 0.033 | 52 | 29388-59-8 | 0.308 | 0.183 |
| 25 | 552-66-9 | 0.072 | 0.035 | 53 | 476-41-5 | 1.620 | 1.700 |
| 26 | 501-36-0 | 2.140 | 1.710 | 54 | 117-10-2 | 0.068 | 0.057 |
| 27 | 33171-05-0 | 1.180 | 1.020 | 55 | 152-84-1 | 0.073 | 0.070 |
| 28 | 580-72-3 | 0.253 | 0.207 |
Table 1: Experimental data for the phenolic antioxidant molecules studied. The DPPH and ABTS values are reported in relative TEAC (mM).
Theoretical calculations of descriptors
As it is reported in [6], all the experimental values obtained are in form of Trolox Equivalent Antioxidant Capacity (TEAC) units. All 3D structures used for calculations were obtained directly from Chemspider as SDF files. The 3D phenolic structure was then uploaded to EntosAI and optimized along with the DFTB calculations. Global reactivity descriptors were obtained from DFT calculations [9-11]. ELUMO and EHOMO corresponded to the energies of the Lowest Unoccupied Molecular Orbital and the Highest Occupied Molecular Orbital, respectively. Properties like the Hardness (η, the resistance of the system to a change of charge, Equation 1), the Softness (S, the inverse of the hardness, Equation 2), the Chemical Potential (μ, measurement of the intrinsic strength of a Lewis acid or base, Equation 3) and the Absolute Electrophilicity Index (ω, the energy stabilization for an electron transfer, Equation 4) were calculated [12,13]. We also included the BDE × f*(O) as the multiplication of the BDE times the Radical Fukui Value of the most active phenolic oxygen. All structures were singlets having two electrons on their HOMO orbital.
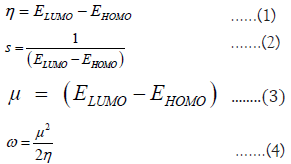
All theoretical results were calculated at the DFTB [14] level of theory with the GFN1-xľB method [15] available on the EntosAI software package at the default configuration. The BDE energy obtained from EntosAI is the lowest BDE [kJ/ mol] energy corresponding to an O-H bonding in the molecule. The oxygen atom corresponding to that bond was used as the basis for the f-(O), f+(O), and f*(O) descriptors, corresponding to electrophilic, nucleophilic, and radical Fukui reactivity values for that oxygen atom. The f-(M), f+(M), and f*(M) correspond to the highest absolute value of the electrophilic, nucleophilic, and radical Fukui values in the whole molecule. The absolute energy of the molecule was also calculated. The HOMO [eV] and LUMO [eV] values were extracted from the Orbital calculations in EntosAI. From those HOMO and LUMO values, the η [eV], μ [eV], ω [eV], and S [eV] were calculated using Equations 1-4. The total number of OH groups n(OH) in the molecule was also considered. We also included the multiplication of the BDE times the Radical Fukui Value of the most active phenolic oxygen (BDE x f*(O)) as a descriptor.
QSAR and machine learning
Since the pharmaceutical industry set the best practice standard for using predictive models, with companies like Pfizer investing heavily into predictive research and saving several billion dollars a year from virtual screening techniques, quantitative structure- property relationship has become valuable assets for both research and industrial use [16]. QSAR is a well-known computational approach for chemical data sciences. QSAR is used to develop predictive models for a vast array of chemical activities based on the study of empirical data coupled with computational calculations and data science techniques [17]. The present work is a QSAR study for the predictive calculation of the ABTS and DPPH RSA values of phenolic compounds, based on theoretical calculations performed and statistically treated with almost zero cost. In the past, many theoretical studies have tried to predict antioxidant activities, with various degrees of success [18,19].
Machine learning is a field of artificial Intelligence and data science, where computational algorithms and complex mathematical models are used for data classification, clustering, and regression. Supervised machine learning algorithms have to meet a balance between the error induced by bias present in the data, as well as the variance of the model. Proper statistical validation is required to maximize the derived models' trustworthiness. Cross-Validation is commonly recognized as a very efficient and reliable method for statistical validation of machine learning and QSAR models [20]. The WEKA software [21,22] is a suite dedicated to implementing various machine learning methods (and other data science applications) for predictive classification or regression problems. As the goal of this study is to predict a certain RSA value, we used the WEKA tool for Feature Selection (dimensionality reduction) and the regression implementation. For this, we used the methods: Multiple Linear Regression (Linear Regression) and Support Vector Machine (SMOreg), together with feature reduction attributes.
Feature selection was carried out using the Principal component analysis (PCA) and Correlation-based Feature Selection (CFS) Subset evaluator options in the WEKA software wrapped over each of the endpoints ABTS and DPPH values individually. All feature selections were carried with the default configuration. For the CFS reductions, the conservative forward selection was preferred.
The final QSAR regression models were obtained for each endpoint by applying the Linear Regression and the SMOreg methods available in WEKA. The regression equation results and the corresponding statistical metrics for validation are described in the results section. All Regression models were validated with Leave-One-Out Cross Validation (LOOCV).
In this work, we performed a theoretical approach to study the relationship between the RSA and the electronic and thermodynamic properties of the systems. Theoretical and computational chemistry is a way of approaching molecules and their reactivities through computerized calculation methods. Many advantages arise from using these methods for predictions, including their low costs, high efficiency, and remarkable precision when studying the properties of electronic or thermodynamic systems. Computational chemistry is broadly used in areas such as pharmacy, inorganic chemistry, material sciences, spectroscopy, and many others as an alternative or previous step to performing expensive lab experiments [23-25].
Feature Selection
Principal components analysis: The PCA feature selection for both ABTS and DPPH endpoints yielded the following descriptors as results: ω, f+(O), f*(O), f-(O), f+(M), BDE, f-(M), f*(M) and BDE × f*(O). The n(OH) descriptor was manually added based on our chemical knowledge of the reaction mechanisms discussed above.
Interestingly, the Electrophilicity Index followed by the Fukui values for the oxygen atom involved in the active OH bond were selected as the most important descriptors. The electrophilicity was also considered in this feature selection, which could be referring to an electron transfer process. This makes sense from a chemical perspective, as the flow of electrons is directly addressed by ω. The Fukui functions, associated with the oxygen of the most active phenolic moiety, described the reactivity of that part of the molecule towards electrophilic, nucleophilic, and radical attacks. Both CDFT descriptors explain the HAT and SET mechanism, while the BDE energy gives insights into the HAT mechanism.
CFS subset evaluator: The CFS Subset feature selection for both endpoints ABTS and DPPH yielded the following descriptors as results: n(OH), BDE, BDE × f*(O), f*(M), S, and f-(M). It is important to note that the n(OH) and the BDE were selected as the most important descriptors for the RSA. These descriptors are directly related to the phenol moiety in the AOx molecule. It is known from the literature that some correlation could exist between the number of phenolic OH bonds and the RSA of certain molecules. At the same time, the BDE has been widely studied and found to be correlated to the AOx activity of certain compounds, especially under vacuum or non-polar phase conditions [26], because of the HAT mechanism. The radical susceptibility to electron transfer in molecular active sites has been studied before via the radical Fukui function [27]. All the electronic descriptors obtained here seem to be related to the electron transfer process; hence they are related to the SET Aox mechanism. BDE, n(OH), and BDEb × f*(O) appear to be the most important descriptors across both feature selection procedures. This makes sense from a mechanistic perspective. It is important to note that the descriptors appearing to bear more information about the RSA of the compounds are all descriptors that can be directly linked to the HAT or SET action mechanism of antioxidants discussed in the introduction.
Both PCA and CFS data were manually mixed and successfully reduced further without losing information. A final universal pruned dataset consisting of n(OH) and BDE x f*(O), will be used for the model regression for both DPPH and ABTS experimental values.
Below are the regression equations obtained for the predictive calculation of the ABTS and DPPH values with their corresponding error metrics. Both algorithms were used with standard configuration, without normalizing data, and LOOCV was used for all models. Calculated and experimental comparisons were evaluated with regression through the origin.
As we can see from (Table 2), the ABTS endpoint was approached with effectiveness and accuracy. The Multiple Linear Regression approach seems slightly more reliable for this response and dataset with a Q2=0.94, even though SMOreg also provided a Q2=0.91. In (Figure 1) the graphical relationship between experimental and calculated ABTS values is provided for both MLR and SMOreg algorithms.
| ABTS | |
|---|---|
| LinearRegression | ABTS=0.8453 × n(OH)-0.0238∙BDE × f*(O) -1.5735 |
| Correlation Coefficient (Q2) | 0.9429 |
| Mean absolute error | 0.3673 |
| Root mean squared error | 0.433 |
| Relative absolute error | 35.64% |
| Root relative squared error | 32.70% |
| SMOreg | ABTS=0.8165 × n(OH)-0.0281∙BDE × f*(O)-1.6226 |
| Correlation Coefficient (Q2) | 0.9275 |
| Mean absolute error | 0.4181 |
| Root mean squared error | 0.492 |
| Relative absolute error | 40.57% |
| Root relative squared error | 37.16% |
Table 2: ABTS endpoint regression results of the LinearRegression and the SMOreg algorithms.

Figure 1: Flowchart of the modelling procedure.
As we can see, (Figure 2) the experimental and predicted values have a very high correlation with experimental data, presenting both models for the ABTS activity with a Q2 ≥ 0.91. Thus, these QSAR models are remarkably successful.

Figure 2: MLR and SMOreg results fitting between calculated and experimental ABTS values.
As we can take from (Table 3), the DPPH endpoint was approached with effectiveness and accuracy. The Multiple Linear Regression approach seems to be slightly more reliable for this type of response and dataset with a Q2=0.936, even though SMOreg algorithm proved to be extremely efficient too with a Q2=0.9273. In (Figure 3) the graphical relationship between experimental and calculated DPPH values is provided for both MLR and SMO algorithms.
| DPPH | |
|---|---|
| LinearRegression | DPPH=0.8508 × n(OH)-0.0265∙BDE × f*(O)-1.6973 |
| Correlation Coefficient (Q2) | 0.936 |
| Mean absolute error | 0.3827 |
| Root mean squared error | 0.4627 |
| Relative absolute error | 36.74% |
| Root relative squared error | 34.55% |
| SMOreg | DPPH=0.86 × n(OH)+0.0332∙BDE × f*(O)-1.8887 |
| Correlation Coefficient (Q2) | 0.9273 |
| Mean absolute error | 0.4217 |
| Root mean squared error | 0.4981 |
| Relative absolute error | 40.49% |
| Root relative squared error | 37.20% |
Table 3: DPPH endpoint regression results of the LinearRegression and the SMOreg algorithms.

Figure 3: MLR and SMOreg results fitting between calculated and experimental DPPH values.
The final equations for both algorithms, when targeting the ABTS and DPPH values, include n(OH), which is known from the literature to be related to the activity of certain compounds, as a major number of phenolic sites could potentially make the electronic and charge accommodation after a HAT or SET mechanism easier, by giving more means to the molecule to delocalize charge or an unpaired electron. Finally, the other key descriptor for describing our problem was [BDE × f*(O)], related to the reactivity and susceptibility of the phenolic oxygen atom in the molecule to radical attacks. It makes mechanistic sense to include this descriptor in the predictive regression equation, as we are literally studying the reaction between phenolic compounds and free radicals, which we also already know from literature undergoes via radical hydrogen atom transfers (HAT mechanism). It is important to note that all presented Q2 ≥ 0.90, making our models extremely efficient.
The Linear Regression algorithms in WEKA seem to be more effective for both endpoints, showing better correlation coefficients (Q2) and better error metrics than the SMOreg algorithm across all models.
Another important point to discuss is the fact that this QSAR work and its results all comply with the OECD principles for the validation, for regulatory purposes, of (quantitative) structure- activity relationship models [28] as it has a defined endpoint (ABTS and DPPH), applies an unambiguous algorithm (as described in the methodology of this work), has a defined domain of applicability (phenolic compounds), present appropriate measures of goodness-of-fit and robustness (Q2, R2 and error metrics, obtained with Leave-One-Out Cross Validation) and we have also presented a mechanistic interpretation for the obtained models (as it was made clear in the previous discussion) [29].
The obtained results have been satisfactory for achieving our goal of producing a regression QSAR of the RSA (measured by ABTS and DPPH separately) of phenolic compounds based on CDFT descriptors obtained via the Density-Functional Tight-Binding method. Two precise models were developed for the ABTS and the DPPH antioxidant capacity tests, with Q2 ≥ 90% and robust error metrics.
We have fulfilled all these work objectives, with highly potent, fast, and cheap models being developed for the RSA. Alongside this, we have proven that DFTB provides a very efficient and approachable calculation framework for this type of study. It would be interesting in future studies to compare models generated with traditional DFT and models generated via DFTB, comparing total time expended and other metrics.
The n(OH) and [BDE × f*(O)] have proven to be effective descriptors for theoretically approaching the RSA of phenols via the mechanisms of HAT expected to be involved in the ABTS and DPPH tests. Our QSAR model makes mechanistic sense and comes accompanied by a clear, reasonable, and logical mechanistic interpretation.
Lastly, this study poses extra value to the current body of knowledge in this area, as we were able to generate very effective and cheap models using only two descriptors directly related to a chemical behavior. In contrast, models in the literature use four or more descriptors and are not always directly linked to a chemical mechanism. Other issues found in current literature are the low number of instances in certain studies for statistical significance. We would recommend revising the studies in this area to try and keep the number of molecules over 40 and the number of descriptors as low as possible.
This study has successfully generated two extremely effective QSAR models at practically zero cost for predicting the DPPH and ABTS values of RSA. Furthermore, both works comply with all the strict 5 OECD QSAR validation principles for regulatory purposes.
[Crossref] [Google Scholar] [PubMed]
[Crossref] [Google Scholar] [PubMed]
[Crossref] [Google Scholar] [PubMed]
[Crossref] [Google Scholar] [PubMed]
[Crossref] [Google Scholar] [PubMed]
[Crossref] [Google Scholar] [PubMed]
[Cross ref] [Google Scholar] [PubMed]
[Cross ref] [Google Scholar] [PubMed]
[Crossref] [Google Scholar] [PubMed]
[Crossref] [Google Scholar] [PubMed]
[Crossref] [Google Scholar] [PubMed]
[Crossref]
[Cross ref] [Google scholar] [PubMed]
[Crossref] [Google Scholar] [PubMed]
[Cross ref] [Google Scholar] [PubMed]
[Crossref] [Google Scholar] [PubMed]
[Crossref] [Google Scholar] [PubMed]
[Crossref] [Google Scholar] [PubMed]
Citation: Halabi A, Hern�¡ndez M, Lenes H (2023) Accurate, Fast and Easy-To-Understand Density Functional Tight Binding and Machine Learning QSAR for the DPPH and ABTS Antioxidant Activity of Phenolic Compounds Based on No-Code Freeware J Drug Metab Toxicol. 14:286
Received: 04-Mar-2023, Manuscript No. JDMT-23-22028; Editor assigned: 07-Mar-2023, Pre QC No. JDMT-23-22028 (PQ); Reviewed: 24-Mar-2023, QC No. JDMT-23-22028; Revised: 28-Mar-2023, Manuscript No. JDMT-23-22028 (R); Published: 05-Apr-2023 , DOI: 10.35248/2157-7609.23.14.286
Copyright: © 2023 Halabi A, et al. This is an open-access article distributed under the terms of the Creative Commons Attribution License, which permits unrestricted use, distribution, and reproduction in any medium, provided the original author and source are credited.