Fisheries and Aquaculture Journal
Open Access
ISSN: 2150-3508
ISSN: 2150-3508
Research Article - (2016) Volume 7, Issue 1
Heavy metals in mud surface sediments have been determined to assess environmental pollution of the selected fish farms in Mymensingh, Bangladesh. Surface sediment samples (0-15 cm) from 20 ponds of a fish farm were collected in February 2014 with a single core sampler and were analysed to measure the concentrations (mg/Kg DW) of Zinc (Zn), Lead (Pb), Cadmium (Cd), Nickel (Ni) and Chromium (Cr) by atomic absorption spectrometry using a VARIAN model AA2407 in Bangladesh Agricultural Research Institute’s laboratory. The measured concentration of heavy metals in the present study was in order of, Zn > Cr > Ni > Pb > Cd which are quite similar to the findings of other sediment of pond mud. The mean concentrations of Zn, Pb, Cd, Cr, Ni observed in the present study were 208, 14.845, 0.009, 63.054 and 58.665 mg/kg respectively. The ranges of the measured concentrations (mg/kg) in the total sediments were 11.5-18.5 for Pb, 0.007-0.011 for Cd, 53.5-77.3 for Cr, 50.8-66.4 for Ni and 100-250 for Zn. The concentrations of Zn and Ni in all sediment samples were above the US Environmental Protection Agency’s (USEPA) guideline for severely polluted sediment and the concentration of Cr falls under the moderately polluted range. The metal Pb and Cd concentrations are well below the regulated level as per USEPA. Therefore, the study results revealed that the pond mud sediment quality in Mymensingh region might be considered as highly and moderately polluted for Zn, Ni and Cr respectively.
Keywords: Heavy metals; Sediment; Sediment quality guidelines; Mymensingh; Bangladesh
Heavy metals are intrinsic, natural constituents of our environment and the term “heavy metals” refers to any metallic elements that have relatively high density and are toxic or poisonous even at low concentration [1]. Heavy metals include Lead (Pb), Cadmium (Cd), Zinc (Zn), Mercury (Hg), Arsenic (As), Silver (Ag), Chromium (Cr), Copper (Cu), Iron (Fe) and the platinum group elements. Moreover they are also known as trace elements because they occur in minute concentrations in biological systems. Sediments may become contaminated by the accumulation of heavy metals through various sources such as disposal of high metal wastes, land application of fertilizers, animal manures, sewage sludge, pesticides, wastewater irrigation [2,3]. The agricultural drainage water containing pesticides and fertilizers and effluents of industrial activities and runoff in addition to sewage effluents enter into the water bodies and sediment with huge quantities of inorganic anions and heavy metals [4]. Some animal wastes like livestock, poultry and pig manures created in agriculture and it also used as food in aquaculture pond and usually supplied to fish either in the form of solids or semi solids. The manures that are created from animals as a result of these diets possess greater amounts of Cu, As and Zn and if continually supplied as fish feed in pond, can result in reasonable accumulation of these metals in the longer period of time in these sediment [5].
Intensification of fresh water aquaculture is very high in the district of Mymensingh (Figure 1) and Jessore where fish farmers follow improved traditional techniques. Carp ployculture and/mixed culture for 120 days (Thai koi, Anabus testudineus) to 300 days (Indian major carps, Pangus, Pangasius pangasius) with stocking density of 40-45/ decimal fish fingerlings in Mymensingh region are common practices. Usually 150-250 kg/decimal fish feed are applied following very occasional water exchange during culture period. In Bangladesh fish and bone meal are added to the supplementary fish feed as a source of protein that are costly. To minimize cost or make the fish production cost effective farmers of this area uses tannery and poultry wastes that is believed as a cheaper protein source of fish feed. These sources caries high load of heavy metals. Therefore there might have a good chance to have high contamination of heavy metals on fish feed. As fish feed is directly consumed by the fish that ultimately accumulates on the sediment through deposition of fish excreta and excess feed waste as well. Theoretically these lead to the accumulation of toxic contaminants in cultured fish and present a food safety risk [6]. Also the heavy metal pollution of aquatic ecosystems is often most obvious in sediments despite there is scanty scientific works on river sediment and on fish in Bangladesh but unfortunately no work has yet been published particularly on heavy metal contamination of fresh water fish farm sediment. Therefore the present study is designed to conduct the present study in the district of Mymensingh, Bangladesh with a view to know the heavy metal concentration in sediments and to assess the sediment quality regarding the different status of pollution [7-12].
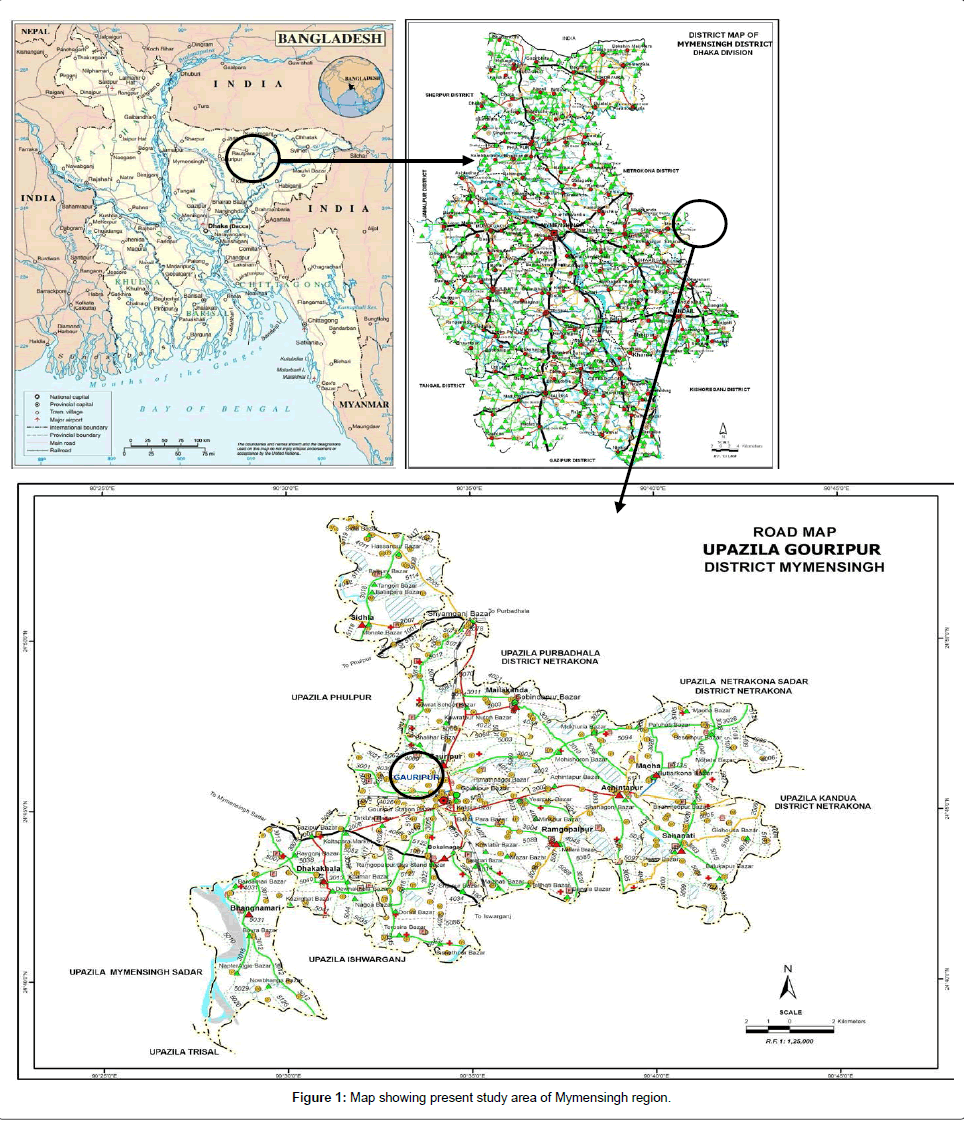
Figure 1: Map showing present study area of Mymensingh region.
The research work was conducted in 20 different fresh water aquaculture ponds of Talukdar fish farm located at Shambhuganj Gouripur upazila of Mymensingh district in Bangladesh (Figure 1) during February, 2014. Different fish species such as Koi (Anabas testudineus), Shing (Heteropneustes fossilis), Magur (Clarius batrachus), Silver carp (Hypothalmicthys molitrix); Tilapia (Tilapia mossumbica), Rui (Labeo rohita) and Pangus (Pangasius pangasius) are cultured in the fish farm for 120 days to 300 days depending on the prices and demand of fish market. Total 60 sediment samples were taken from 20 ponds (3 replicates from each pond) by a single core sampler of (0- 15) cm depth. The samples were then brought back to laboratory and were dried immediately at room temperature in a well aerated room and then grounded and screened to pass throw a 2.00 mm sieve and kept into plastic bags for further analysis.
In laboratory 1 g of dried sediment was weighed into 50 ml beakers, followed by the addition of 10 ml mixture of analytical grade acids HNO3:HCIO4 in the ratio 5:1. The digestion was performed at a temperature of about 190ºC for 1.5 h. After cooling, the solution was made up to a final volume (30 ml) with distilled water in a volumetric flask. The metal concentrations were determined by atomic absorption spectrometry (AAS) using a VARIAN model (AA2407) in the laboratory of Bangladesh Agricultural Research Institute. Analysis of each sample was carried out 4 times to obtain representative results and the data reported in mg/kg (on a dry matter basis). Baker and Amacher method for Cd, Cr, Ni, Zn and Burau method for Pb determination were followed [13,14].
The mean concentration of Zn, Pb , Cd, Cr, Ni of 20 different pond sediment samples are shown in Table 1 where the concentration levels of Cr, Ni and Zn are found higher than the concentration levels of Cd and Pb from same sampling pond. Metal contents were ranging over following intervals: Zn: (100-250) mg/kg, Pb: (11.5-18.5) mg/kg, Cd: (0.007-0.011) mg/kg, Cr: (53.5-77.3) mg/kg and Ni: (50.8-66.4) mg/kg. Mean concentrations of the metals were: Zn: (208 ± 31.388) mg/kg, Pb: (14.845 ± 1.995) mg/kg, Cd: (0.009 ± 0.001) mg/kg, Cr: (63.054 ± 6.922) mg/kg, Ni: (58.665 ± 4.617) mg/kg. On the basis of mean value, sediments were enriched with metals in following order:
| Pond No: | Zn | Pb | Cd | Cr | Ni |
|---|---|---|---|---|---|
| P-1 | 210 ± 5 | 14.5 ± 0.2 | 0.008 ± 0.001 | 77.30 ± 0.22 | 50.80 ± 0.36 |
| P-2 | 220 ± 4 | 18.2 ± 0.1 | 0.011 ± 0.003 | 67.11 ± 0.26 | 60.00 ± 1.64 |
| P-3 | 100 ± 2 | 14.2 ± 0.1 | 0.007 ± 0.001 | 69.14 ± 0.34 | 55.30 ± 0.62 |
| P-4 | 220 ± 4 | 13.5 ± 0.3 | 0.010 ± 0.002 | 57.21 ± 0.33 | 55.60 ± 0.51 |
| P-5 | 200 ± 2 | 14.3 ± 0.3 | 0.008 ± 0.001 | 66.13 ± 0.36 | 54.60 ± 0.29 |
| P-6 | 250 ± 4 | 13.6 ± 0.2 | 0.011 ± 0.002 | 64.04 ± 0.20 | 65.30 ± 0.37 |
| P-7 | 220 ± 2 | 11.5 ± 0.2 | 0.011 ± 0.001 | 58.01 ± 0.16 | 56.30 ± 0.37 |
| P-8 | 200 ± 4 | 12.3 ± 0.2 | 0.010 ± 0.002 | 55.02 ± 0.29 | 53.40 ± 0.41 |
| P-9 | 210 ± 2 | 12.6 ± 0.2 | 0.008 ± 0.002 | 57.24 ± 0.28 | 57.80 ± 0.22 |
| P-10 | 200 ± 5 | 12.8 ± 0.4 | 0.008 ± 0.002 | 54.09 ± 0.25 | 51.10 ± 0.22 |
| P-11 | 200 ± 2 | 15.6 ± 0.2 | 0.010 ± 0.003 | 68.00 ± 0.40 | 62.50 ± 0.46 |
| P-12 | 190 ± 4 | 14.3 ± 0.2 | 0.009 ± 0.003 | 54.60 ± 0.28 | 58.20 ± 0.29 |
| P-13 | 180 ± 4 | 17.2 ± 0.3 | 0.008 ± 0.001 | 53.50 ± 0.28 | 60.50 ± 0.36 |
| P-14 | 210 ± 5 | 18.5 ± 0.4 | 0.009 ± 0.002 | 75.60 ± 0.51 | 66.40 ± 0.37 |
| P-15 | 220 ± 2 | 15.5 ± 0.2 | 0.010 ± 0.001 | 65.20 ± 0.37 | 59.80 ± 0.28 |
| P-16 | 250 ± 5 | 16.2 ± 0.2 | 0.011 ± 0.002 | 60.50 ± 0.36 | 63.70 ± 0.43 |
| P-17 | 230 ± 5 | 18.1 ± 0.2 | 0.008 ± 0.002 | 67.80 ± 0.36 | 56.50 ± 0.36 |
| P-18 | 210 ± 3 | 14.5 ± 0.3 | 0.009 ± 0.002 | 59.40 ± 0.24 | 65.40 ± 0.43 |
| P-19 | 200 ± 2 | 13.8 ± 0.5 | 0.010 ± 0.002 | 65.00 ± 0.43 | 57.80 ± 0.83 |
| P-20 | 240 ± 5 | 15.5 ± 0.3 | 0.011 ± 0.002 | 66.20 ± 0.32 | 62.30 ± 0.37 |
| Mean | 208 ± 31.388 | 14.845 ± 1.995 | 0.009 ± 0.001 | 63.054 ± 6.922 | 58.665 ± 4.617 |
| Range | 100-250 | 11.5-18.5 | .007-.011 | 53.5-77.3 | 50.8-66.4 |
Table 1: Parametric presentation of heavy metal (mg/kg) in 20 sediment samples collected from a fish farm, Bangladesh.
Zn > Cr > Ni > Pb > Cd
The metal concentrations in the sediments were evaluated by comparison with the sediment quality guideline proposed by USEPA [15] (Table 2). According to these criteria our present study showed that all the ponds were heavily polluted for Zn and moderately polluted for Cr. The relatively high content of Cr and Zn may be due to use of CuSO4, Hg (NO3)2, K2Cr2O7 and ZnSO4 especially that was not properly regulated. Fish culture in the present study area was completely dependent on the application of fish feed which are enriched with the concentration of Zn [16]. Therefore fish feed might lead the high concentration of Zn accumulated in the sediment of the present study area. High content of Cr in the present study area might be due to the fish feed as poultry and/tannery wastes are thought to add in fish feed where K2Cr2O7 play key role in cleaning. Another source of heavy metal is the pellet feed that did not eaten by fish and settled in the sediment [17]. Where the mean levels of Pb (14.845 ± 1.995 mg/ kg) of 20 samples (Table 1) was below the lowest effect level, threshold effect level, probable effect concentration and severe effect level (Figure 2) according to Sediment Quality Guideline [18] did not lie under the category of polluted area. In case of Cd (mg/Kg) which was below the lowest effect level, threshold effect level, probable effect concentration and severe effect level according to Sediment Quality Guideline (Figure 3) might be categorized the study area under non polluted state according to CBSQG SQG. The mean concentration of Cr recorded at the study area was 63.054 mg/kg (Table 1) which was below the severe effect level and probable effect concentration but the value exceeded the lowest effect level and threshold effect level according to Sediment Quality Guideline shown in (Figure 4). Moreover the mean concentration of Ni which was below the severe effect level but the value exceeded the lowest effect level, threshold effect level and probable effect concentration according to Sediment Quality Guideline (NOOA, 2009) shown in (Figure 5) [18,19].
| Elements/Sediment Quality standard | Zn | Pb | Cd | Cr | Ni |
|---|---|---|---|---|---|
| (USEPA, 1991) Guidelines* | |||||
| Non-Polluted | < 90 | < 40 | - | < 25 | < 20 |
| Moderately Polluted | 90 – 200 | 40 - 60 | - | 25 – 75 | 20 - 50 |
| Heavily Polluted | > 200 | > 60 | > 6 | > 75 | >50 |
| Present Study | 208 ± 31.388 | 14.845 ± 1.995 | 0.009 ± 0.001 | 63.054 ± 6.922 | 58.665 ± 4.617 |
| CBSOG SQG(2003)** | |||||
| Non-Polluted | < 90 | < 40 | < 0.99 | < 43 | < 23 |
| Moderately Polluted | 90-200 | 40-70 | 0.993 | 43-76 | 23-36 |
| Heavily Polluted | > 200 | >70 | > 3 | >76 | > 36 |
| Present Study | 208 ± 31.388 | 14.845 ± 1.995 | 0.009 ± 0.001 | 63.054 ± 6.922 | 58.665 ± 4.617 |
Table 2: Different sediment quality guidelines of heavy metals (mg/kg).
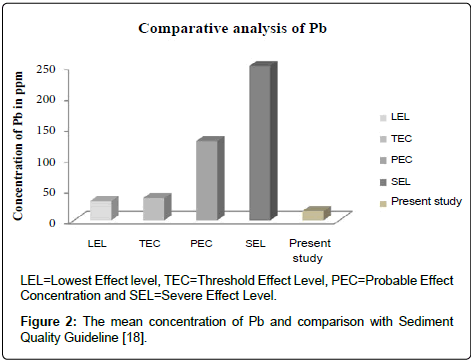
Figure 2: The mean concentration of Pb and comparison with Sediment Quality Guideline [18].
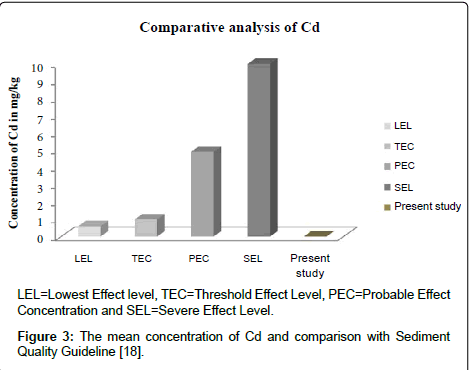
Figure 3: The mean concentration of Cd and comparison with Sediment Quality Guideline [18].
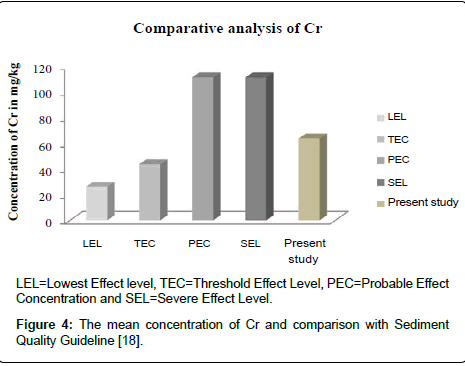
Figure 4: The mean concentration of Cr and comparison with Sediment Quality Guideline [18].
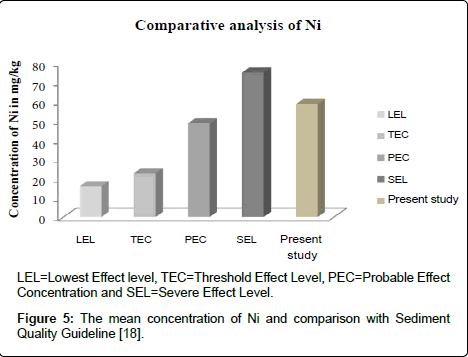
Figure 5: The mean concentration of Ni and comparison with Sediment Quality Guideline [18].
The main goal of this research work was to assess the concentration of some toxic heavy metals of sediment from several ponds of Mymensingh. A total of 20 fresh water aquaculture ponds sediment samples were collected and analyzed for five heavy metals namely Zn, Pd, Cd, Cr and Ni. The concentration of heavy metals was in order of, Zn > Cr > Ni > Pb > Cd. According to the present study, sediment can be categorized as heavily polluted for Zn and Ni whereas the areas can be categorized as moderately polluted for Cr according to USEPA. The concentrations of Pb and Cd in sediment were within the EPA sediment quality proposed and Consensus–Cased Sediment Quality Guidelines.