
Immunotherapy: Open Access
Open Access
ISSN: 2471-9552

ISSN: 2471-9552
Research Article - (2023)Volume 9, Issue 4
Background: Breast cancer is now the most prevalent malignant among female population worldwide. Anoikis is a key progress during genesis and metastasis of malignant cells. Pyroptosis is a newly defined type of programmed cell death reported to have a dual effect on the development of carcinomas and had been reported to have the potential to affect anti-tumor immunity. However, few studies investigated the connections between anoikis, pyroptosis and prognosis in breast cancer.
Methods: Anoikis and Pyroptosis related Genes (APGs) were achieved from GeneCards and Harmonizome portals database. Based on expression profiles of APGs of patients from TCGA-BRCA cohort, differentiated expressed APGs between normal and tumoral tissues are identified. Next, by univariate Cox regression analysis of combined data of TCGA and GSE cohorts, prognostic APGs was defined. Then patients from both TCGA and GEO cohort were classified into three clusters by consensus clustering algorithm. Overlapped APGs between three clusters were identified as intersecting genes, based on expression of which, individuals are again assigned to two different gene clusters. Eventually, we successfully developed a PCA scoring signature and a nomogram system to accurately predict the prognosis and immunotherapy efficacy of breast cancer patients.
Results: Patients were classified into three clusters based on APGs’ expression. Cluster A was featured by longest OS. According to the expression profile of 300 intersecting genes, patients were again divided into two different gene clusters. Subtype B is characterized with poorer diagnosis. Meanwhile, by means of principal component analysis, we successfully predicted clinical outcomes and treatment response to immunotherapy. Finally, we constructed an APG score-associated nomogram model to predict prognosis.
Conclusion: We successfully established a scoring system based on anoikis and pyroptosis-related genes, as well as combined with clinicopathological features, to serve as a biomarker for prediction of clinical outcomes and immunotherapy efficacy in breast cancer.
Breast cancer; Anoikis; Pyroptosis; Signature; Immunotherapy
ARGs: Anoikis-Related Genes; ABC: Advanced Breast Cancer; ECM: Extracellular Matrix; TME: Tumor Microenvironment; TCGA: The Cancer Genome Atlas; CNV: Copy Number Variation; GEO: Gene Expression Omnibus; PCA: Principal Component Analysis; UMAP: Uniform Manifold Approximation and Projection; t-SNE: t-Distributed Stochastic Neighbor Embedding; DEGs: Differentially Expressed Genes; GSEA: Gene Set Enrichment Analysis; ssGSEA: single sample Gene Set Enrichment Analysis; GSVA: Gene Set Variation Analysis; ROC ICTA: Cancer Immunome Atlas; HPA: The Human Protein Atlas; ROC: Receiver Operating Characteristic; AUC: Areas Under Curve; EMT: Epithelial-to-Mesenchymal Transition; TAM: Tumor-Associated Macrophages; ICIs: Immune Checkpoint Inhibitors; TNBC: Triple-Negative Breast Cancer; OS: Overall Survival
Breast cancer has been now the most common malignancy amongst females, resulting in a mortality second only to lung and bronchus cancer [1-3]. Although new strategies have greatly improved life expectancy and quality of life in patients with Advanced Breast Cancer (ABC), the prognosis of such population is still unsatisfactory, with a median overall survival less than five years [4]. Metastatic tumors resistant to current therapy has comprised the major cause of death for cancer. Therefore, a novel diagnostic biomarker is urgently needed to predict clinical outcomes and optimize clinical management of ABC patients.
Metastasis is a sequential and interrelated multi-steps progress involving Epithelial-Mesenchymal Transition (EMT), intravasation, survival in the circulatory system, extravasation, response to microenvironment and finally colonization in distant positions, contributing to a poor clinical outcome for ABC patients [5]. Anoikis is a distinguished form of apoptosis triggered in cells lost in contact with native Extracellular Matrix (ECM) and plays a vital role in prevention of malignancy metastasis [6]. Anoikis prevents epithelial cells from shedding from their original location and colonizing elsewhere. Tumor cells resistant to anoikis reject apoptosis, sustain proliferative signals, activate invasion and metastasis, separate from each other and finally migrate and proliferate in remote areas [7]. Naturally, malignant cells develop into several mechanisms to counteract anoikis. It is reported that several risk factors, for example, pH, ROS, growth proteins, transcriptional signaling pathways were capable of promoting anoikis resistance, facilitating tumor invasion and metastasis [8]. This truth enlightened us that a thorough understanding of mechanisms behind anoikis was of great value in the systemic management of breast cancer patients. Former research investigated that lncRNA APOC1P1-3 suppressed early apoptosis of breast cancer cell lines (MCF-7 and MDA-MB-231) and promoted anoikis resistance via reducing activated-Caspase 3, 8, 9 and PARP [9]. In addition, Bone Morphogenetic Proteins (BMPs) were reported to regulate cell fate during development and mediate cancer progression. Inhibition of BMP receptors has an inhibitory effect on anoikis resistance in triple-negative breast cancer cells [10]. MicroRNA-6744-5p was also proven to have therapeutic value in enhancing anoikis sensitivity [11]. Former clues all indicated that the process of anoikis would be a promising target.
Pyroptosis was also a newly defined form of PCD, distinguished by the consequence of the formation of cell membrane perforations, the loss of ion homeostasis, the release of inflammatory mediators and finally the emergence of huge bubbles from the plasma membrane [12]. As an inflammatory form of PCD, pyroptosis was speculated to play an important role in modulation of tumor formation, progression including tumor growth, invasion, metastasis and treatment response to Immune Checkpoint Inhibitors (ICIs) across a variety category of solid carcinoma [13]. However, cross talk between anoikis and pyroptosis was scarcely studies so far.
In this study, we developed and validated a score signature based on Anoikis and Pyroptosis related Genes (APGs) to estimate survival, TME, treatment response among breast cancer populations. Our research revealed the value of anoikis and pyroptosis in the progress of breast cancer development and we hope corresponding intervention could provide a novel insight into breast cancer management.
Data collection and processing
Based on The Cancer Genome Atlas (TCGA) (https://portal.gdc.cancer.gov/), we retrieved the mRNA expression profiles, Copy Number Variation (CNV) files, Tumor Mutation Burden (TMB) and clinical information of 1085 female breast cancer patients from project TCGA-BRCA. Clinical information, for instance, age, TNM stage and overall survival information were extracted and compiled by Perl scripts. Gene expression files and clinical information of 327 individuals from GSE20685 from Gene Expression Omnibus (GEO) (https://www.ncbi.nlm.nih.gov/geo/) database were also used for signature construction. Samples lack of complete clinical survival information were excluded from further investigation.
Identification of anoikis and pyroptosis-related genes
A number of 640 anoikis-related genes and 1515 pyroptosis-related genes were downloaded from the GeneCard database (https://www.genecards.org/, accessed on 3 July 2023) and Harmonizome portals (https://maayanlab.cloud/Harmonizome/, accessed on 3 July 2023) [14,15]. Differential expression analysis was then performed and 467 APGs were identified to have expressed with difference among normal and tumor samples. The analysis was performed by R software limma package and FDR<0.05 was considered significant.
Prognostic analysis based on APGs
According to univariate Cox regression analysis, we found 48 genes were significantly related to individual’s clinical outcomes (Cox p value<0.01 was considered significant). The analysis was performed by R software survival package.
Consensus clustering based on APG expression
R package ConsensusClusterPlus was applied to classify patients into different subtypes according to the expression profile of 369 significantly differentially expressed APGs identified by univariate Cox regression model [16]. Thereafter, we utilized R "survival" package to analyze clinical survival between subtypes and visualize by method of Kaplan-Meier survival curvem [17]. Principal Component Analysis (PCA), Uniform Manifold Approximation and Projection (UMAP) and t-distributed Stochastic Neighbor Embedding (t-SNE) were used to examine the accuracy and reliability of clustering [18- 20]. R packages limma and VennDiagram were then applied to determine and visualize 300 intersecting genes across three APG clusters.
Gene Set Enrichment Analysis (GSEA) and Gene Set Variation Analysis (GSVA)
We retrieved “c2.cp.kegg.v2023.1.Hs.symbols.gmt” and “c5. go.v2023.1.Hs.symbols.gmt” profiles from the MSigDB database. Next, we used “org.Hs.eg.db” and “GSVA” packages to perform GSEA and GSVA between three APG clusters [21]. Abundance and proportions of immune cell infiltration was also estimated by R “GSEABase” and “GSVA” packages.
Gene Ontology (GO) analysis of intersecting genes
R software package “org.Hs.eg.db” was adopted to carry out GO analysis to investigate Molecular Function (MF), Biological Process (BP) and Cellular Component (CC) with regards to intersecting genes.
Construction of PCA score prognostic signature
Univariate Cox regression model was utilized and 121 Differentially Expressed Intersecting Genes (DEGs) were identified. “ConsensusClusterPlus” algorithm was used to divide the individuals into two different intersecting gene clusters (gene clusters). According to the expression profiles of DEGs, we next performed PCA to calculate the APG score for each sample. The APG score could be calculated by a sum of values of two principal components and followed the formulation: APG score=value of principal component one (PC1)+value of principal component two (PC2). Next, we used R function “surv_cutpoint” from package “survminer” to estimate optimal cutoff value of APG score. Patients with a APG score higher than cutoff value was assigned to “Highrisk” group while the others would be labelled “Low- risk”.
Independent analysis of prognostic signature
R package “survival” and “survminer” were utilized to evaluate the independence of APG score signature. ROC curves further evaluated signature's value in prediction of prognosis in the future 1,3,5 years by “timeROC” package [22]. In addition, Nomogram was developed to associate clinicopathological characteristics with risk score [23]. Cumulative curve and Calibration diagram validated its efficiency in reflecting clinical outcomes. Additionally, Decision Curve Analysis (DCA) was applied to evaluate accuracy of the Nomogram [24].
Analysis of Tumor Microenvironment (TME) and prediction of immunotherapy treatment response across gene clusters
R algorithm “CIBERSORT” was used to estimate immune cell infiltration of every sample [25]. Package “tidyverse” was further used to systematically investigate the relationship between every subtype of immune cells and APG score. TME score was assessed by R algorithm “estimate” [26]. Tumor Immune Dysfunction and Exclusion (TIDE) (http://tide.dfci.harvard.edu/) and Cancer Immunome Atlas (ICTA) databases (https://tcia.at/home) were used to assess the relationship between APG score and immunotherapy treatment response.
Identification of protein interactions and hub genes
Interactions between proteins were performed by string database (version 11.5) [27]. Hub genes were identified by cytoscape software (version 3.8.2, app “cytohubba”) [28].
Drug sensitivity prediction
Therapeutic sensitivity prediction was performed via R package “pRRophetic” [29]. Drugs with significant treatment response were illustrated in boxplots by “ggplot2” and “ggpubr” packages.
Statistical analysis
In this study, all statistical analysis were performed using Perl scripts, R software (version 4.3.1) and its support packages. Univariate Cox analysis was performed to identify prognostic APGs with significance. Kaplan–Meier survival analysis and the log-rank test was used to compare survival between two groups. Correlation coefficients were examined using spearman correlation analysis. Statistical p value<0.05 is considered significant unless specially declared.
Identification of prognostic Anoikis-Related Genes (ARG)
Firstly, we retrieved 640 anoikis-related genes and 1515 pyroptosis-related genes from the GeneCard database and Harmonizome portals database. By means of Wilcox test, we identified 467 genes expressed varied with significance between normal and tumor tissues. Top 50 significantly differentially expressed genes was shown in Figure 1A. The volcano graph depicted genes upregulated and downregulated with significance in tumor tissues than in normal tissues (Figure 1B). Then we merged the survival information of individuals from TCGA and GEO cohorts. According to univariate Cox regression analysis, 48 genes were significantly related to individual’s clinical outcomes. Top 10 genes whose expression patterns significantly relating to clinical survival were thus visualized (Figure 1C). Based on the 48 genes, hub genes were identified by “String” online database and software “cytoscape” (Figures 1D-1F). The correlation network of anoikis- and pyroptosis-related genes and their regulatory relationships in breast patients are shown in Figure 2A. According to an examination of Copy Number Variations (CNV), a total of 44 genes exhibited marked CNV alterations (Figure 2B). Furthermore, we located CNVs of ARGs in 23 chromosomes (Figure 2C). 14.75% of 976 samples carried mutations of APG regulators from TCGA-BRCA cohort (Figure 2D).
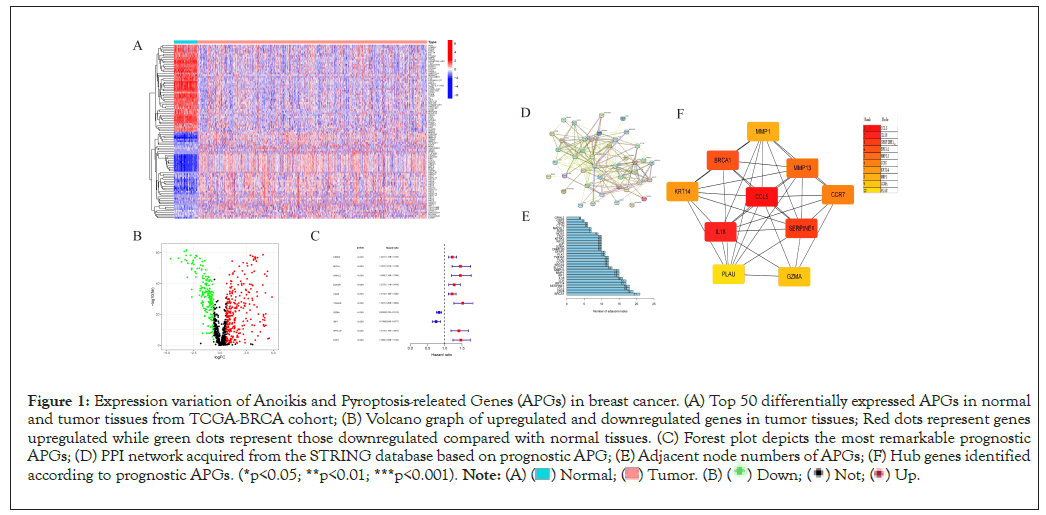
Figure 1: Expression variation of Anoikis and Pyroptosis-releated Genes (APGs) in breast cancer. (A) Top 50 differentially expressed APGs in normal
and tumor tissues from TCGA-BRCA cohort; (B) Volcano graph of upregulated and downregulated genes in tumor tissues; Red dots represent genes
upregulated while green dots represent those downregulated compared with normal tissues. (C) Forest plot depicts the most remarkable prognostic
APGs; (D) PPI network acquired from the STRING database based on prognostic APG; (E) Adjacent node numbers of APGs; (F) Hub genes identified
according to prognostic APGs. (*p<0.05; **p<0.01; ***p<0.001). 
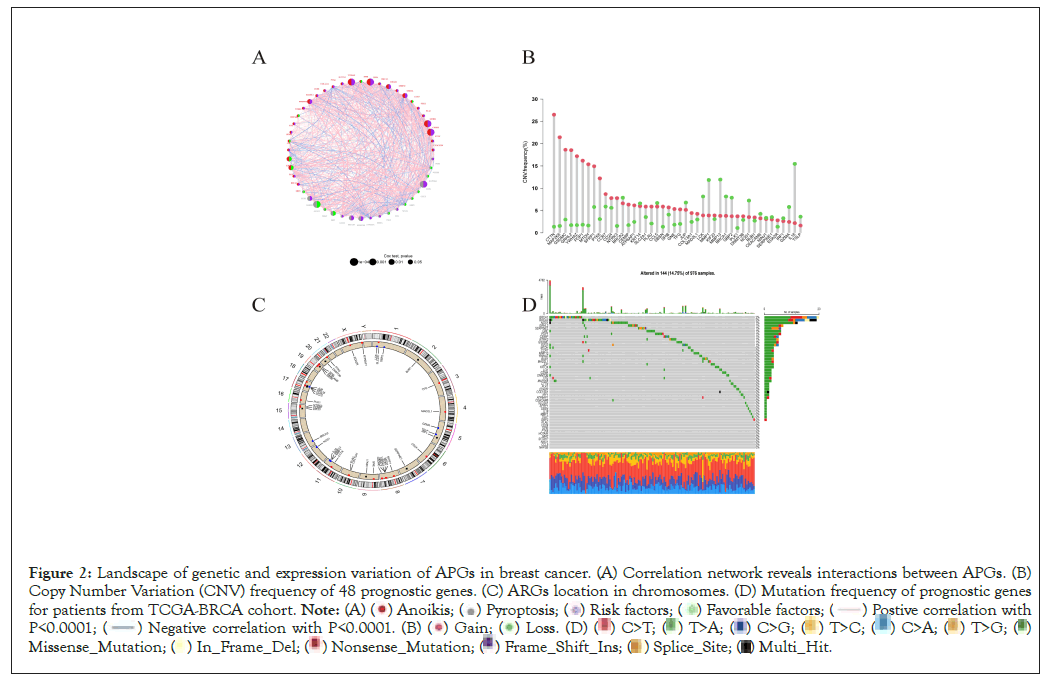
Figure 2: Landscape of genetic and expression variation of APGs in breast cancer. (A) Correlation network reveals interactions between APGs. (B)
Copy Number Variation (CNV) frequency of 48 prognostic genes. (C) ARGs location in chromosomes. (D) Mutation frequency of prognostic genes
for patients from TCGA-BRCA cohort. 


Subtypes classified by differentially expressed APGs
Based on the expression condition of 369 APGs identified by univariate Cox regression algorithm to be significantly related to overall survival, 1409 individuals with definite survival information were effectively classified into "A", "B" and "C" clusters at a ratio of 508:293:608 by R software “consensus” clustering algorithm (Figure 3A). Then we use "survival" package to analyze subgroup survival by Kaplan-Meier survival curve. The curve showed that cluster A had a significant advantage over B over C in terms of Overall Survival (OS) (Figure 3B). The accuracy of clustering was examined by methods of Principal Component Analysis (PCA) [20], Uniform Manifold Approximation and Projection (UMAP) [19] and t-Distributed Stochastic Neighbor Embedding (Figures 3C-3E) [18]. Heatmap was used to depict the correlation between subtypes and clinical characteristics of individuals from TCGA-BRCA cohort and GSE20685 (Supplementary Figure 1).
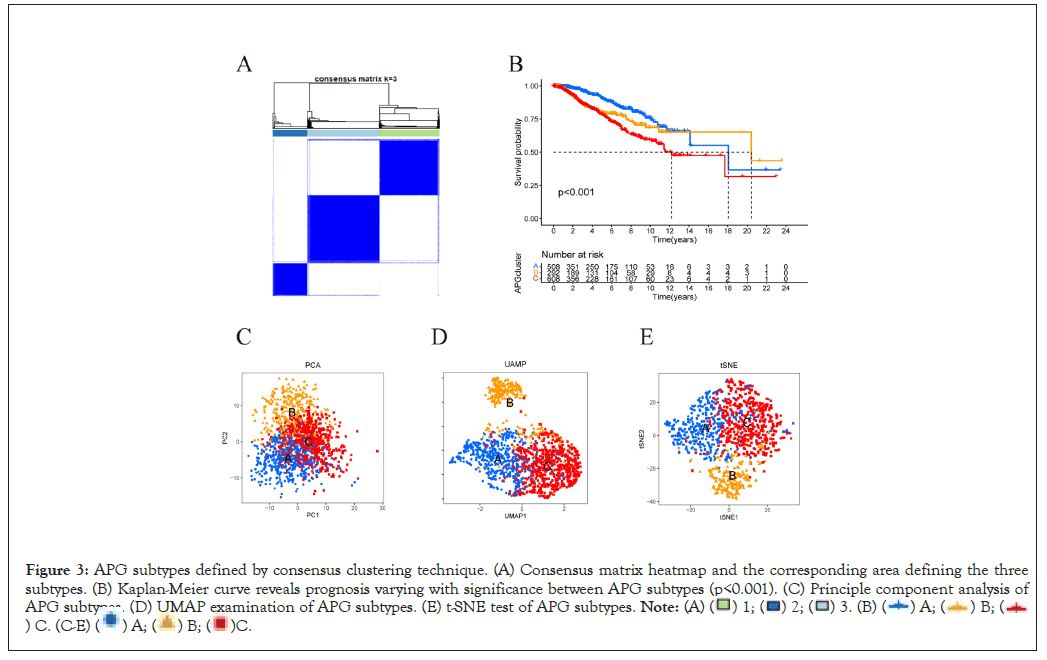
Figure 3: APG subtypes defined by consensus clustering technique. (A) Consensus matrix heatmap and the corresponding area defining the three
subtypes. (B) Kaplan-Meier curve reveals prognosis varying with significance between APG subtypes (p<0.001). (C) Principle component analysis of
APG subtypes. (D) UMAP examination of APG subtypes. (E) t-SNE test of APG subtypes. 

Immune cells infiltration and functional enrichment analysis across APG subtypes
Single sample Gene Set Enrichment Analysis (ssGSEA) was performed to reveal immune cell infiltration variation of three APG subtypes. We found that in the microenvironment of subtype A, percentages of most activated immune cells were significantly higher than that in subtype A, for instance activated B cells, CD8+ T cells, dendritic cells and CD56 bright natural killer cells (Figure 4A). This may indicate that the microenvironment of cluster A acted more inclined to be a “hot” tumor, resulting better prognosis than cluster C and implying a better response towards immunotherapy [30]. To further investigate the biological behaviors APGs take part in breast cancer pathological process, next we performed a Gene Set Variation Analysis (GSVA). As is shown in Figures 4B and 4C, cluster C is majorly enriched in signal pathways concerning chromosome separation, mitotic spindle organization, DNA replication and DNA damage repair, indicating more activity in mitosis and cell cycle. Additionally, Gene Set Enrichment Analysis (GSEA) revealed the top 5 significant signal pathways as was shown in Figures 4D and 4E. Consistent with former GSVA results, GSEA results revealed downregulated signal pathways concerning cytokine activity, lymphocyte mediated immunity, adaptive immune response and leukocyte chemotaxis in APG cluster C. Meantime, we discovered downregulated pathways relating to chromosome separation in subtype A. Our findings suggested that APG cluster C were highly probably to possess much more anti-tumor microenvironment than its counterpart. This may also partially explain a better OS in cluster A than that in C. The correlation between APGs and TME remained to be further explored.
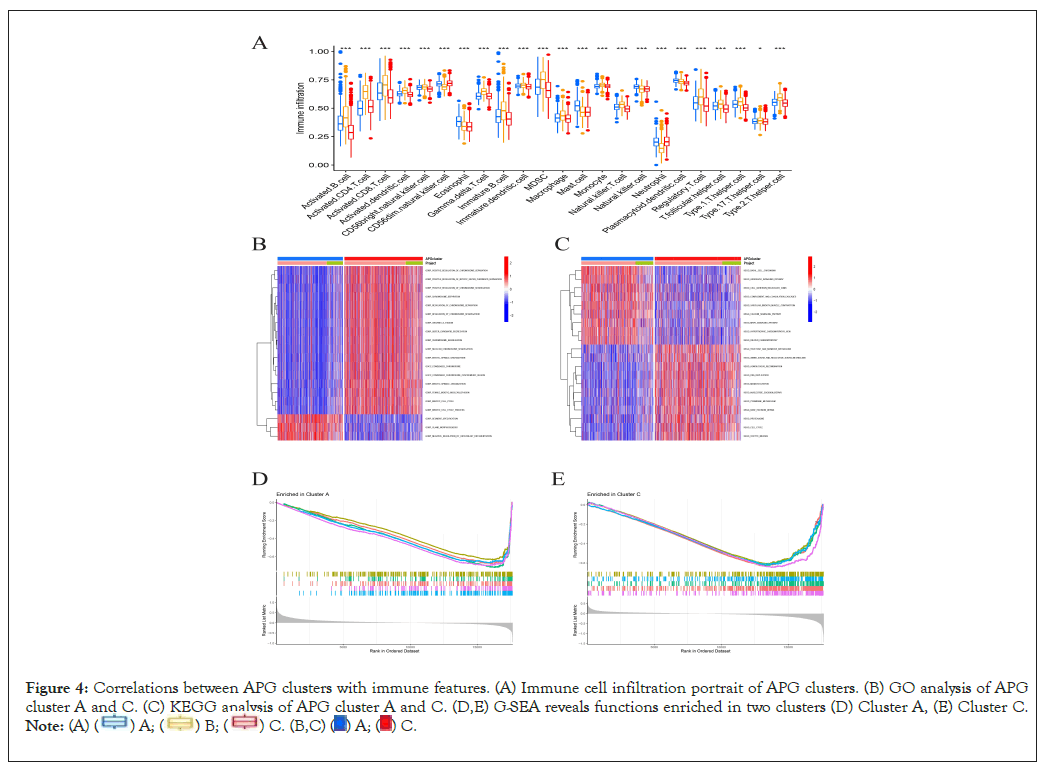
Figure 4: Correlations between APG clusters with immune features. (A) Immune cell infiltration portrait of APG clusters. (B) GO analysis of APG
cluster A and C. (C) KEGG analysis of APG cluster A and C. (D,E) G-SEA reveals functions enriched in two clusters (D) Cluster A, (E) Cluster C 
Identification and Gene Ontology (GO) analysis of intersecting genes between APG clusters
We used R “limma” package to have successfully identified 300 intersecting genes between three APG clusters, as is shown in Figure 5A. Overlapped genes between three APG subtypes were mainly enriched in biological processes concerned with mitosis, chromosome segregation and cell cycle (Figures 5B-5D).
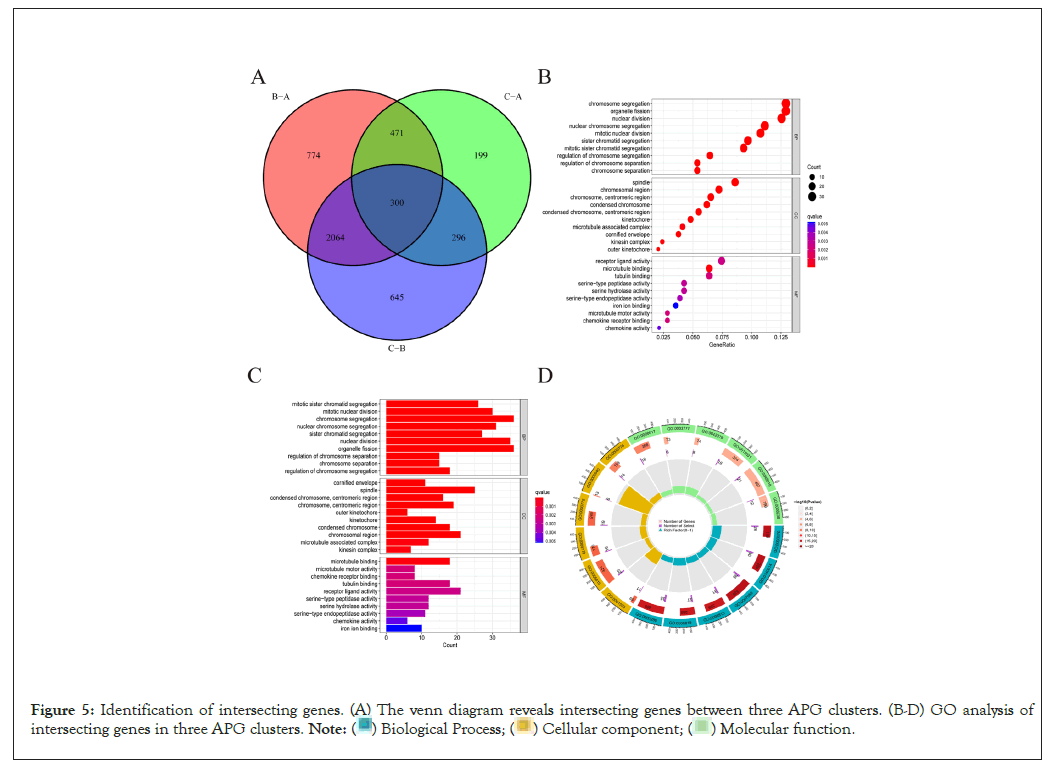
Figure 5: Identification of intersecting genes. (A) The venn diagram reveals intersecting genes between three APG clusters. (B-D) GO analysis of
intersecting genes in three APG clusters. 
Classification of gene clusters based on DEGs
121 DEGs significantly related to overall survival were identified by univariate Cox regression algorithm (Supplementary Table 2). According to expression profiles of DEGs, we again used R software “consensus” algorithm to classify patients into gene cluster “A” and “B” (Figure 6A). As was shown in Figure 6B, individuals in gene cluster A exhibited much better overall survival than their counterparts in gene cluster B. The relationship between clinicopathological portraits and gene clusters was displayed in a heatmap (Supplementary Figure 2). Notably, 38 of the 48 prognostic APGs expressed variedly across different gene clusters (Figure 6C).
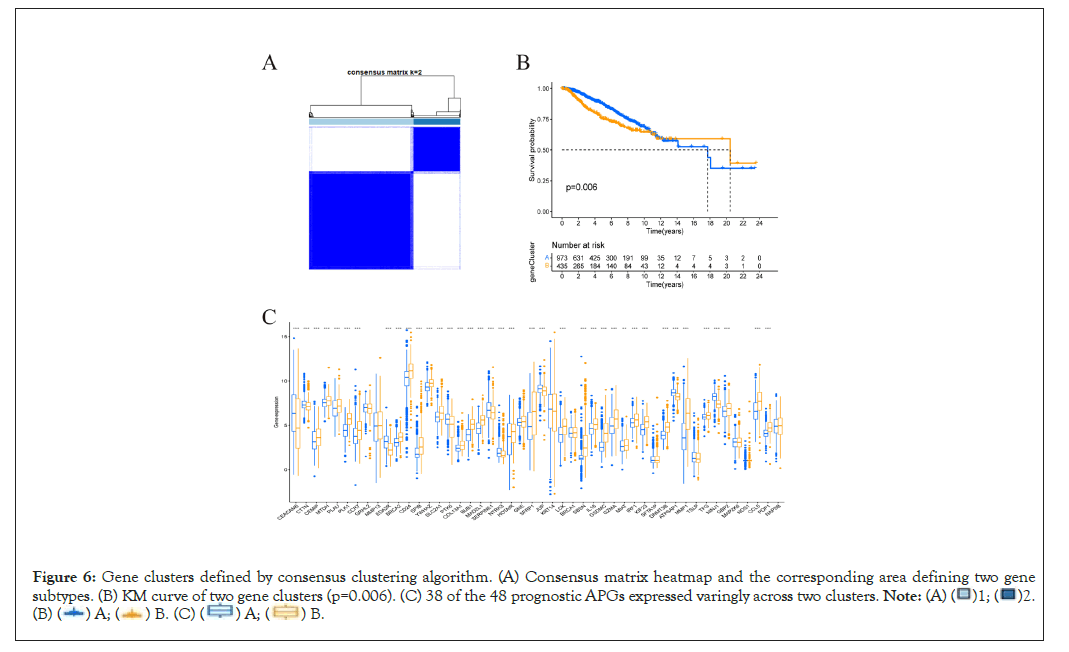
Figure 6: Gene clusters defined by consensus clustering algorithm. (A) Consensus matrix heatmap and the corresponding area defining two gene
subtypes. (B) KM curve of two gene clusters (p=0.006). (C) 38 of the 48 prognostic APGs expressed varingly across two clusters. 

Establishment of the APG score signature
Based on expression pattern of 121 DEGs, the approach of PCA was applied to calculate the APG score for every sample. The APG score was calculated as the following formulation; APG score=value of Principal Component One (PC1)+value of Principal Component Two (PC2) (Supplementary PCAscore.csv). Next, we used R function “surv_cutpoint” from package “survminer” to estimate optimal cutoff value of APG score. As a result, according to the calculated cutoff of APG score, patients with a higher score were categorized as “High risk” group (N=905) while those harboring a lower score were labelled as “Low risk” (N=503). There were remarkable differences between two score groups with regards to OS as was shown in Kaplan-Meier survival curve (Figure 7A). Patients in subgroup with lower APG score had a much better probability to survive than those with higher scores (Figure 7B). Clearly, patients who were dead also showed a tendency to score higher than those who were alive (Figure 7C). The alluvial diagram illustrated the distribution between APG clusters, gene clusters, APG score and clinical outcomes (Figure 7D).
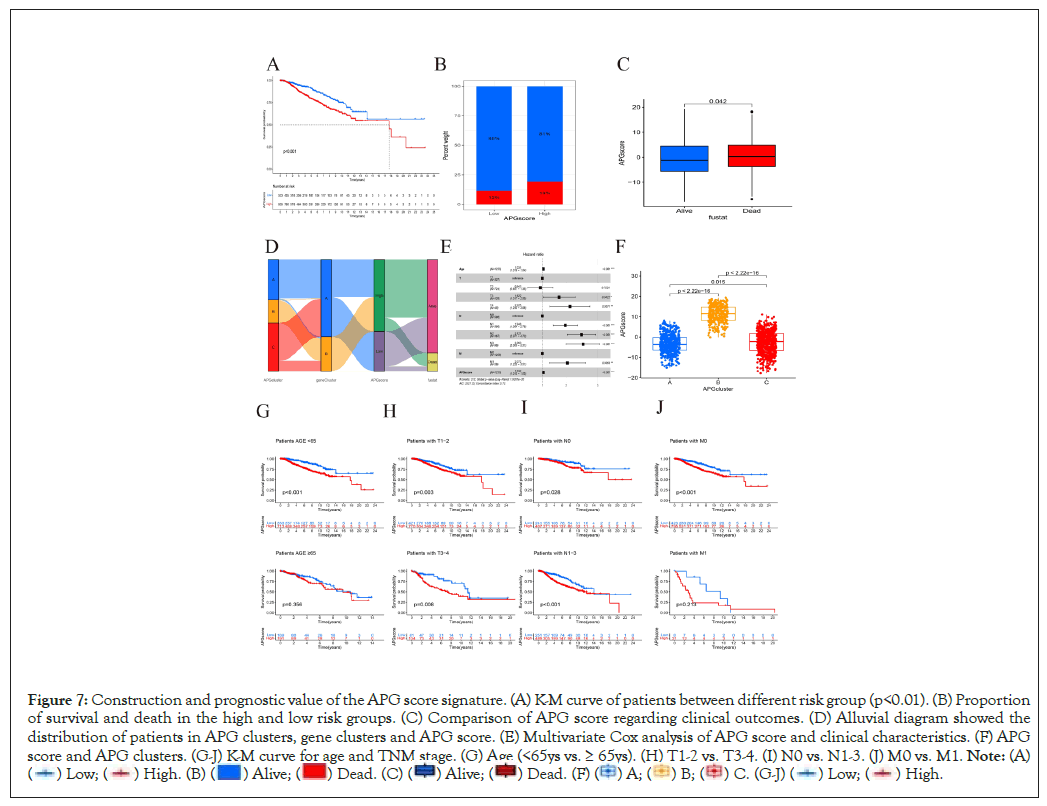
Figure 7: Construction and prognostic value of the APG score signature. (A) K-M curve of patients between different risk group (p<0.01). (B) Proportion
of survival and death in the high and low risk groups. (C) Comparison of APG score regarding clinical outcomes. (D) Alluvial diagram showed the
distribution of patients in APG clusters, gene clusters and APG score. (E) Multivariate Cox analysis of APG score and clinical characteristics. (F) APG
score and APG clusters. (G-J) K-M curve for age and TNM stage. (G) Age (<65ys vs. ≥ 65ys). (H) T1-2 vs. T3-4. (I) N0 vs. N1-3. (J) M0 vs. M1. 

Independence validation of the prognostic APG score
A total of 1235 samples from both TCGA-BRCA and GSE20685 cohorts with complete OS, age and TNM information was included in the independence validation. Multivariate Cox analysis was next used to explore the correlations between clinicopathological characteristics and clinical outcomes (Figure 7E). In accordance with our former results, patients from APG cluster A, whose OS is longest between three clusters, were featured with lowest APG scores. We also found that age, lymph node status, metastasis together with APG score exhibited significant potential in predicting survival (Figures 7F-7J). This further supported that APG score system is reliable and of prognostic value. We believe it will serve as a novel prognostic biomarker for breast cancer.
Correlation between APG score signature and immunotherapy
First, we applied “CIBERSORT” algorithm to estimate immune cell infiltration across all samples [25]. Generally, we ranked the samples in the order of APG score from low to high to show immune cell proportion (Figure 8A). Next, we explored interactions between different types of immune cells (Figure 8B). Most types of immune cells were enriched in the high-risk subgroup when compared to the low-risk group (Figure 8C). Moreover, APG score was observed to be positively related to most types of immune cells but in a negative correlation with CD56 dim natural killer cells and neutrophils (Figure 8D). It came to our sight that with APG score went higher, abundance of majority of immune cells went richer. To further investigated the relationship between APG score and immunotherapy efficacy, we analyzed the expression pattern of eight immune checkpoint molecules in different risk groups and found seven of the eight molecules expressed much higher in the high-risk group (Figure 8E). We speculate this may indicate a better response to ICIs treatment. To validate our suspect, we turned to “Tumor Immune Dysfunction and Exclusion (TIDE)” online database for further validation. Accordingly, patients in low-risk group exhibited more chance to immune escape events and respond poorer to immunotherapy (Figure 8F). Finally, we utilized the TCIA database to verify whether expressions of PD-1 or CTLA- 4 could affect treatment between the high- and low- risk groups of patients with breast cancer. Consistent with our former findings, patients classified as high-risk group would respond much better than their low-risk counterparts in case the tumor cells expressing CTLA-4 or/and PD-1 (Figure 8G-8J).
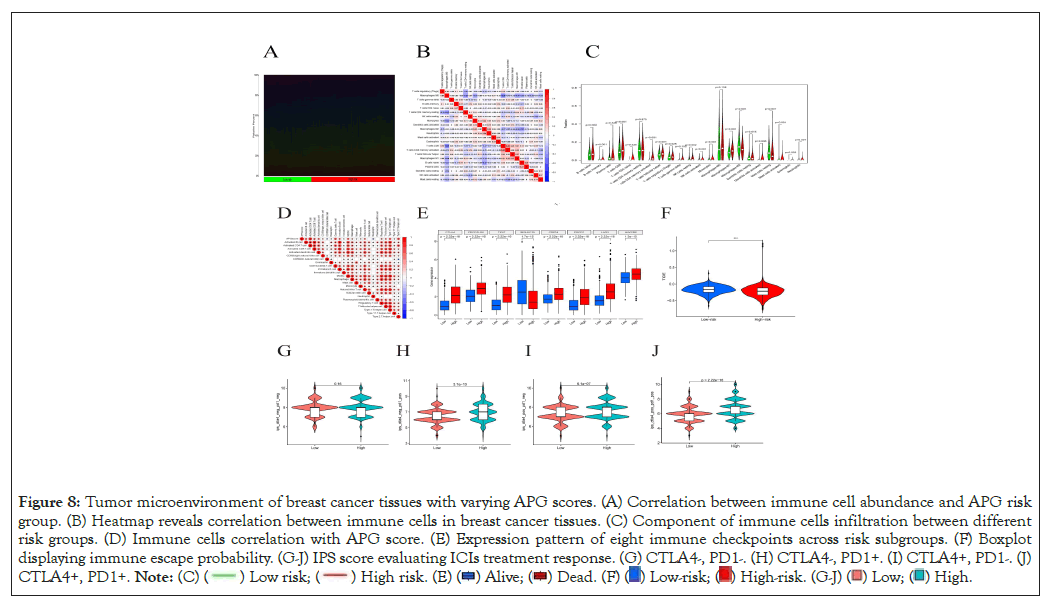
Figure 8: Tumor microenvironment of breast cancer tissues with varying APG scores. (A) Correlation between immune cell abundance and APG risk
group. (B) Heatmap reveals correlation between immune cells in breast cancer tissues. (C) Component of immune cells infiltration between different
risk groups. (D) Immune cells correlation with APG score. (E) Expression pattern of eight immune checkpoints across risk subgroups. (F) Boxplot
displaying immune escape probability. (G-J) IPS score evaluating ICIs treatment response. (G) CTLA4-, PD1-. (H) CTLA4-, PD1+. (I) CTLA4+, PD1-. (J)
CTLA4+, PD1+. 
Development of nomogram based on APG risk score
To precisely and individually assess risk and predict survival in breast cancer patients, we developed a nomogram constitutive of TNM stage, age and APG risk score by R program [23]. As is shown in Figure 9A, the higher the sum of scores was, the poorer the patient’s prognosis would be. Then we utilized calibration plots to validate the accuracy and efficiency of the nomogram (Figure 9B) [31]. Time-dependent Receiver Operating Characteristic (ROC) curves were utilized to examine sensitivity and specificity of nomogram predictive model (Figure 9C). What’s more, the AUC value of the nomogram was far beyond the other prognostic biomarkers, suggesting great potential in prognosis prediction (Figure 9D).
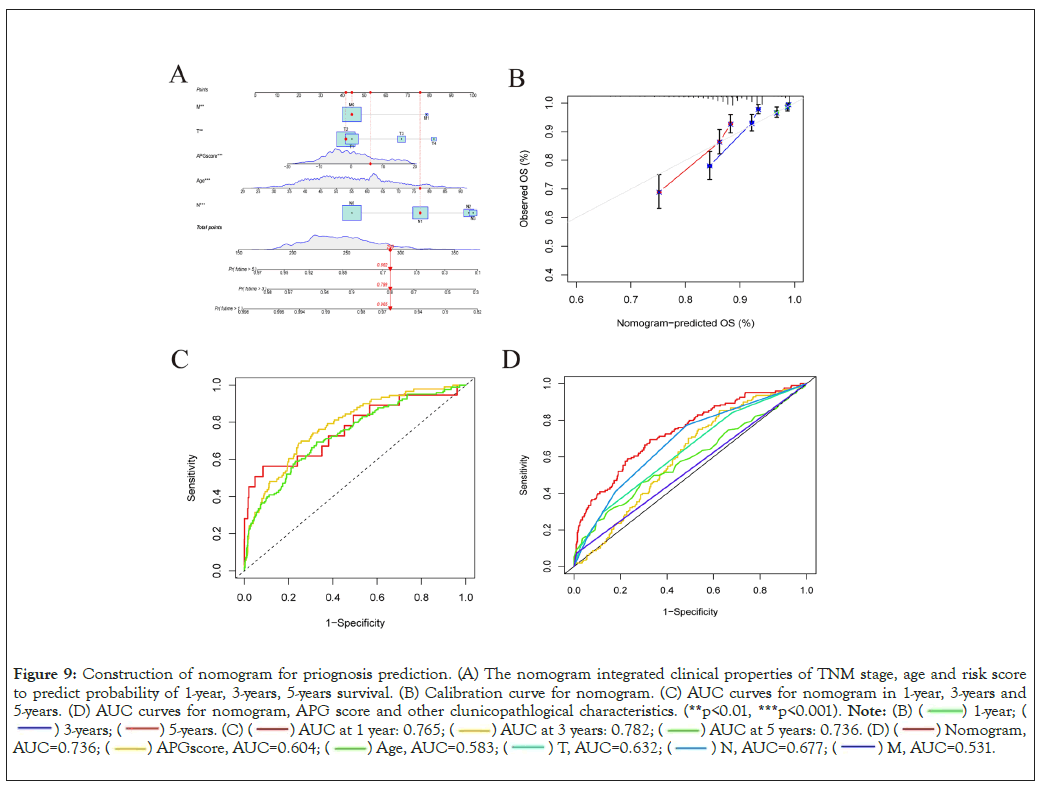
Figure 9: Construction of nomogram for priognosis prediction. (A) The nomogram integrated clinical properties of TNM stage, age and risk score
to predict probability of 1-year, 3-years, 5-years survival. (B) Calibration curve for nomogram. (C) AUC curves for nomogram in 1-year, 3-years and
5-years. (D) AUC curves for nomogram, APG score and other clunicopathlogical characteristics. (**p<0.01, ***p<0.001). 


Drug sensitivity prediction
Susceptibility of several drugs that were applied to treat breast cancer clinically was estimated by R package "pRRophetic" [29]. Sensitivity of a total of 198 drugs were analyzed (Supplementary Table 3). Our analysis showed patients from APG high-risk subtype were resistant to most drugs and could only benefit more from five drugs. (Supplementary Figure 3). This indicated that few chemotherapy and targeted drugs may achieve better response among patients with a high score. Sensitivity for several commonly used drugs in clinic were shown in Figures 10A-10H.
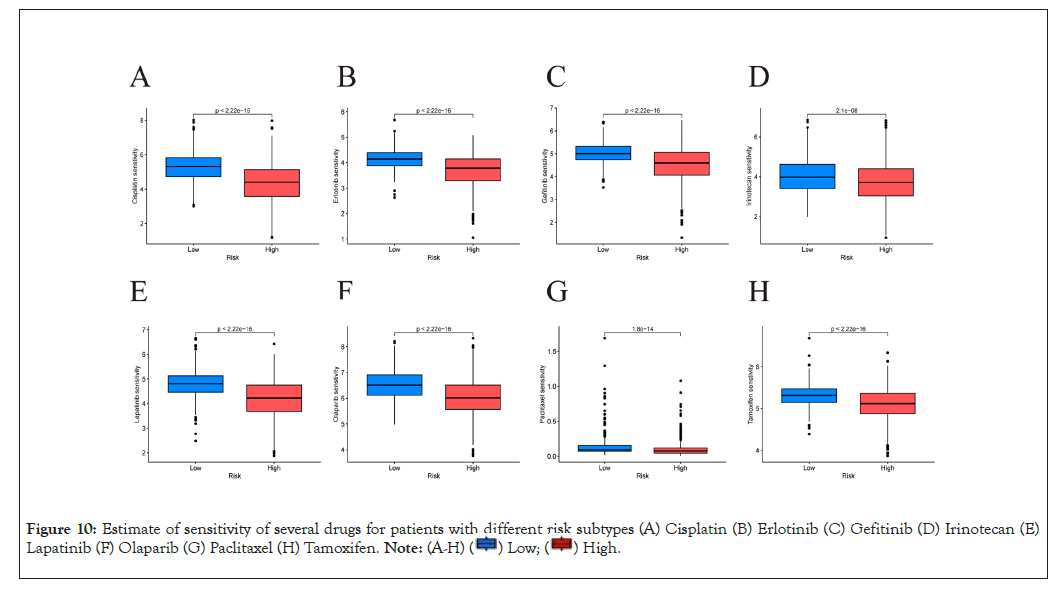
Figure 10: Estimate of sensitivity of several drugs for patients with different risk subtypes (A) Cisplatin (B) Erlotinib (C) Gefitinib (D) Irinotecan (E)
Lapatinib (F) Olaparib (G) Paclitaxel (H) Tamoxifen. 
Validation by the Human Protein Atlas (HPA) database
We exploited the HPA database to evaluate the protein expression level of the most remarkable hub genes. As speculated, expression level of the top two hub genes, BRCA1 and CD24 was much higher in tumoral tissues. Accompanied with higher level of protein expression level was a higher APG score, indicating a poorer OS (Figures 11A-11F).
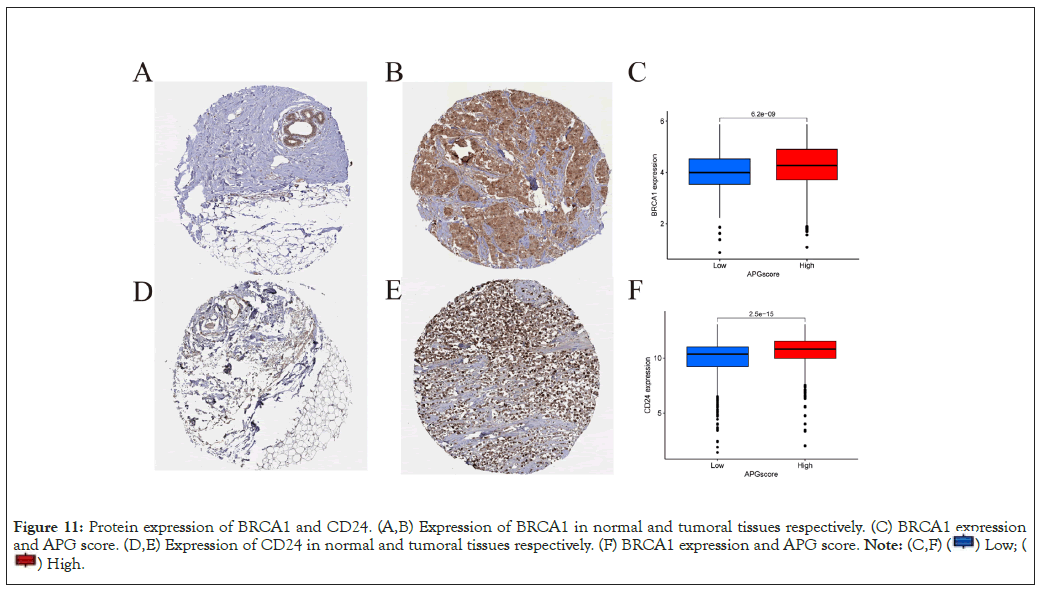
Figure 11: Protein expression of BRCA1 and CD24. (A,B) Expression of BRCA1 in normal and tumoral tissues respectively. (C) BRCA1 expression
and APG score. (D,E) Expression of CD24 in normal and tumoral tissues respectively. (F) BRCA1 expression and APG score. 

Breast cancer is one of the most common malignant worldwide and has posed a great threat to the female population [1,2]. Despite the rapid advance in detection techniques and treatment strategies of breast cancer, it is vital to identify early-stage breast cancer patients sensitively and specifically to improve clinical outcomes in such population [4,32]. Due to high heterogeneity of TME in Advanced Breast Cancer (ABC), patients developing into advanced stage are destined to embrace a poor prognosis [33]. In view of lack of innovative and individualized tactics to identify and treat breast cancer patients, novel biomarkers with sensitivity and specificity are urgently needed [34,35].
Normally, cells in incorrect context within a tissue or loss in contact with appropriate extracellular matrix will be eliminated by mechanism of apoptosis, a progress we called “anoikis” [36,37]. Hence, anoikis is a physiologically procedure taking an active role in the genesis, development and homeostasis of organisms. Corresponding studies indicated that malfunction of anoikis mechanism could give rise to a series of diseases, including progression of tumors [38]. It is universally observed that metastatic tumor cells exhibited property of highly resistance to anoikis. Anoikis disorder featured a hallmark of tumor cells by promoting the Epithelial-to-Mesenchymal Transition (EMT) through both the intrinsic and extrinsic pathways [7,39]. Nevertheless, there are few studies concentrating on the effects of expression of anoikisrelated signal pathways and genes on breast cancer invasiveness and prognosis.
Pyroptosis is a distinguished form of PCD in response to a wide range of stimulations. As a typical kind of inflammatory cell death usually triggered by the cytosolic sensing of danger signals and pathogen infection, pyroptosis is reported to be able to enhance immune activity depending on tumor type, host inflammatory status and immunity [40,41]. Recent studies have revealed targeting pyroptosis is a promising approach to treat breast cancer [42,43]. Evidence are accumulating that by triggering biological process in breast cancer, the tumor microenvironment could be reorganized and thus anti-tumor immunity could be enhanced [44].
Despite the important roles anoikis and pyroptosis have taken part in tumoral genesis, metastasis, microenvironment organization, even clinical outcomes of breast patients, prognostic biomarkers and crosstalk behind are scarcely discussed.
In this research, we investigated 467 APGs whose expression patterns varied with significance between tumor and normal tissues. Next, based on univariate Cox regression model, expression of 48 APGs were believed to be of prognostic value. Among them, 32 of them were identified as risk factors against prognosis while 16 of them as favorable factors. Based on the prognostic APGs, CCL5, IL18, SERPINE1, BRCA1 and MMP13 were identified as hub genes. Previous studies have demonstrated therapeutic value in regulating anoikis and pyroptosis. By interacting with Chemokine Receptor Type 5 (CCR5), CCL5 could promote breast cancer progression and metastasis via Treg cells [45]. Release of IL-18 is reported to initiate pyroptosis in breast cancer, facilitating tumor metastasis [46-48]. Serine Protease Inhibitor, Clade E Member 1 (SERPINE1) is a wellknown oncogene that takes an important part in several human malignancies. Inhibition of SERPINE1 significantly inhibited cell survival, induced cell apoptosis, downregulated expression of angiogenetic Vascular Endothelial Growth Factor A (VEGFA) [49]. Knockdown of SERPINE1 could partially restore sensitivity to paclitaxel in TNBC. Variants in BRCA1 are responsible for a bulk of breast cancer cases, as is universally investigated and acknowledged. Patients carrying mutations of BRCA1 are extremely vulnerable to breast cancer as is reported [50,51]. MMP13 was observed to be upregulated in invasive breast cancer while silencing of MMP13 could reduce proliferation of breast cancer cells [52]. There is abundant evidence that APGs play an important role in phases of genesis and development in breast cancer, affecting chemotherapy, targeted therapy and immunotherapy efficacy. Nevertheless, few studies were undergone to explore the association between anoikis and pyroptosis, let alone the crosstalk behind in breast cancer progression. The mechanisms behind remain to be more explicitly elucidated.
Based on prognostic APGs, in this study, we successfully classified individuals into three molecular subtypes. Prognostic information visualized by Kaplan-Meier survival curve had revealed significant differences in terms of survival between subtypes. By means of ssGSEA, we compared abundance of infiltrated immune cells between the three APG subtypes. Consistent with our expectation, those whose TME were infiltrated with more activated immune cells showed better OS. Next, we applied GSEA and GSVA to highlight signal pathways accounting for the differences. Consequently, we found individuals displaying higher activity in pathways regarding adaptive immunity and cytokine activity tended to share longer OS. On the contrary, subtypes mainly enriched in pathways regarding cell cycle, chromosome segregation and DNA replication inclined to have poor prognosis. We next focused on the 300 overlapped genes between three APG clusters. GO and KEGG analysis were used to determine biological functions the intersecting genes works. According to expression of 121 DEGs identified by univariate Cox regression model from 300 intersecting genes, patients were classified into two gene clusters. Individuals in gene cluster A were featured with better OS and higher abundance in activated immune cells in TME, inflecting an inflammatory environment that favors anti-tumor immunity [53]. We constructed an APG score system to predict prognosis based on PCA. Accordingly, patients were classified into different risk groups on the basis of an ideal cutoff of APG score. Our successive analysis verified the APG score signature was not only able to predict prognosis, but also beneficial to estimate immunotherapy response. Patients in the high-risk showed remarkable advantage in receiving ICIs treatment while resistant to majority of chemotherapy and targeted therapy. Furthermore, we constructed a nomogram model and consequent examination exhibited superior efficiency in predicting clinical outcomes over APG scores.
More and more evidence is pointing out that resistance to anoikis could facilitate chemotherapy tolerance. It is also reported that by reversing such resistance, prostate cancer patients could benefit much more from chemotherapy [54]. While pyroptosis serves as a double-edged sword in breast cancer treatment. How to make advantage of mechanisms of pyroptosis to promote anti-tumor immunity and improve immunotherapy efficacy is a challenge to deal with [55].
Above all, our research developed a novel biomarker based on analysis of anoikis combined with pyroptosis, corresponding regulation and intervention of which could profit the health being of patients suffering from breast cancer. Despite the discoveries, we must admit our study still share some deficiencies. Firstly, our data is majorly from open access to TCGA and GEO database. Secondly, only bioinformatic approaches are not convincing enough, we require following laboratory and clinical validation. Thirdly, breast cancer is a collection of a series of highly heterogeneous disease, in our study we failed to distinguish breast cancer patients according to their histopathological molecular portraits.
In this research, we constructed a risk score signature based on prognostic Anoikis- and Pyroptosis Related Genes (APGs). We analyzed and assessed the model from multiple dimensions, for example, the correlation with prognosis, TME, immunotherapy and chemotherapy treatment response. Our findings confirmed the clinical value of anoikis and pyroptosis, providing new visions in optimizing breast cancer management.
We are grateful for the support and cooperation of undergraduate students from department of Oncology, the first clinical college of Nanjing Medical University.
This article did not receive sponsorship for publication.
Datasets analyzed in this article were available by open access, retrieved from TGGA (https://portal.gdc.cancer.gov/), GEO((https://www.ncbi.nlm.nih.gov/geo/)) database, Cancer Immunome Atlas (ICTA) database (https://tcia.at/home) and The Human Protein Atlas (HPA; https://www.proteinatlas.org/). The datasets used and/or analyzed during the current study are available from the corresponding author on reasonable request.
QL and FQ contributed to the conception and design of the study. RL obtained the online datasets. QL and FQ performed the statistical analysis. QL wrote the first draft of the manuscript. QL, FQ, WL, contributed to the revision of the manuscript. All authors contributed to the article and approved the submitted version.
Not applicable.
Not applicable.
The authors declare that the research was conducted in the absence of any commercial or financial relationships that could be construed as a potential conflict of interest.
The authors declare that they have no competing interests.
All claims expressed in this article are solely those of the authors and do not necessarily represent those of their affiliated organizations or those of the publisher, the editors and the reviewers. Any product that may be evaluated in this article or claim that may be made by its manufacturer, is not guaranteed or endorsed by the publisher.
[Crossref] [Google Scholar] [PubMed]
[Crossref] [Google Scholar] [PubMed]
[Crossref] [Google Scholar] [PubMed]
[Crossref] [Google Scholar] [PubMed]
[Crossref] [Google Scholar] [PubMed]
[Crossref] [Google Scholar] [PubMed]
[Crossref] [Google Scholar] [PubMed]
[Crossref] [Google Scholar] [PubMed]
[Crossref] [Google Scholar] [PubMed]
[Crossref] [Google Scholar] [PubMed]
[Crossref] [Google Scholar] [PubMed]
[Crossref] [Google Scholar] [PubMed]
[Crossref] [Google Scholar] [PubMed]
[Crossref] [Google Scholar] [PubMed]
[Crossref] [Google Scholar] [PubMed]
[Crossref] [Google Scholar] [PubMed]
[Crossref] [Google Scholar] [PubMed]
[Crossref] [Google Scholar] [PubMed]
[Crossref] [Google Scholar] [PubMed]
[Crossref] [Google Scholar] [PubMed]
[Crossref] [Google Scholar] [PubMed]
[Crossref] [Google Scholar] [PubMed]
[Crossref] [Google Scholar] [PubMed]
[Crossref] [Google Scholar] [PubMed]
[Crossref] [Google Scholar] [PubMed]
[Crossref] [Google Scholar] [PubMed]
[Crossref] [Google Scholar] [PubMed]
[Crossref] [Google Scholar] [PubMed]
[Crossref] [Google Scholar] [PubMed]
[Crossref] [Google Scholar] [PubMed]
[Crossref] [Google Scholar] [PubMed]
[Crossref] [Google Scholar] [PubMed]
[Crossref] [Google Scholar] [PubMed]
[Crossref] [Google Scholar] [PubMed]
[Crossref] [Google Scholar] [PubMed]
[Crossref] [Google Scholar] [PubMed]
[Crossref] [Google Scholar] [PubMed]
[Crossref] [Google Scholar] [PubMed]
[Crossref] [Google Scholar] [PubMed]
[Crossref] [Google Scholar] [PubMed]
[Crossref] [Google Scholar] [PubMed]
[Crossref] [Google Scholar] [PubMed]
[Crossref] [Google Scholar] [PubMed]
[Crossref] [Google Scholar] [PubMed]
[Crossref] [Google Scholar] [PubMed]
[Crossref] [Google Scholar] [PubMed]
[Crossref] [Google Scholar] [PubMed]
[Crossref] [Google Scholar] [PubMed]
[Crossref] [Google Scholar] [PubMed]
[Crossref] [Google Scholar] [PubMed]
[Crossref] [Google Scholar] [PubMed]
[Crossref] [Google Scholar] [PubMed]
Citation: Liu Q, Qu F, Wu XF, Lu R, Li W (2023) A Novel Signature Based on Crosstalk Between Anoikis and Pyroptosis Associated Genes for Prediction of Clinical Outcomes, Tumor Microenvironment (TME) and Treatment Response of Breast Cancer. Immunotherapy (Los Angel). 9:237.
Received: 03-Nov-2023, Manuscript No. IMT-23-27909; Editor assigned: 06-Nov-2023, Pre QC No. IMT-23-27909 (PQ); Reviewed: 20-Nov-2023, QC No. IMT-23-27909; Revised: 27-Nov-2023, Manuscript No. IMT-23-27909 (R); Published: 04-Dec-2023 , DOI: 10.35248/2471-9552.23.09.237
Copyright: © 2023 Liu Q, et al. This is an open-access article distributed under the terms of the Creative Commons Attribution License, which permits unrestricted use, distribution and reproduction in any medium, provided the original author and source are credited.
Sources of funding : This article did not receive sponsorship for publication.