Journal of Pollution Effects & Control
Open Access
ISSN: 2375-4397
ISSN: 2375-4397
Review Article - (2015) Volume 3, Issue 2
In different concentration ranges of adsorbed species, various interactions occur between them and surface adsorption sites and there are different regions in an adsorption isotherm. In the common method for study of adsorption process, all of the regions are considered as one region and thus there are concerns regarding using adsorption equations. In this work, based on the KASRA and ARIAN regional models, a new method is presented for analysis of adsorption kinetic and thermodynamic data, respectively. The KASRA and ARIAN models are three- and four-region models, respectively and adsorption equations are used on the basis assumptions used in these models. According to the ARIAN model, adsorption binding constant of each region of an adsorption isotherm is different from the other regions. On the other hand, based on the kinetic KASRA model and ideal-second-order (ISO) equation, during the adsorption in each initial adsorbate concentration, different interactions occur between adsorbate species and adsorbent surface sites and thus the observed adsorption binding constant is an average value of these binding constants.
Keywords: Langmuir isotherm; Temkin isotherm; ARIAN model; KASRA equation; ISO equation
Adsorption has extensive applications such as air pollution control, chromatography, water treatment, etc. A lot of equations have been introduced for analysis of both kinetic and thermodynamic data obtained during adsorption processes in the gas and liquid phases. Researchers try to explain the mechanisms of different adsorption processes by these equations and compare them together. But, there are concerns in relation to using some of these equations for liquid phase adsorption which are discussed in this work and by using newly introduced equations and models, a new approach are introduced for analysis of adsorption experimental data. Here, it is shown that the pseudo-first- and pseudo-second-order assumptions used in the pseudo-first- and pseudo-second-order equations are wrong. Also, due to big differences between interactions involving the adsorption of an adsorbate on the surface of a different compound and crystallization of a particle on the surface of the growing crystal there is a big concern in relation to using the Avrami equation for adsorption from liquid phase on the adsorbent surface. Here, based on the KASRA model, the KASRA, ideal-second-order, pseudo-first-order, pseudo-secondorder, Elovich, pore-diffusion and Avrami equations are studied and in continuation of this work, according to the ARIAN model, a number of thermodynamic isotherms, including the ARIAN, Henry, bilayer, LBC, Langmuir-type, reverse desorption, Langmuir, Freundlich, Temkin, Sips, Dubinin-Radushkevich and BET isotherms are studied.
Analysis of adsorption kinetic data based on the KASRA model
KASRA model and KASRA equation: At first, the KASRA model and KASRA equation are discussed [1-3]. KASRA is an abbreviation for “Kinetics of Adsorption Study in the Regions with Constant Adsorption Acceleration”. The KASRA model was presented by Samiey [1] in 2014 and is based on the following assumptions: (1) each time range with constant adsorption acceleration, is named a “region”, (2) there are two regions before attaining plateau region, (3) the boundaries between the first and second regions and the second and third (plateau) regions are named “starting second region” (abbreviated as ssr) and “kinetics of adsorption termination” (abbreviated as kat) points, respectively and are determined by the KASRA equation, (Figures 1-4) Due to different features of the first and second regions, parameters obtained from a kinetic equation (such as the pore-diffusion, Avrami and Elovich equations, etc.) for these two regions are different from each other and the related equations for these regions come different pathways to the point qt=0 at t=0 (or q0i). It is good to say that KASRA is a Persian word meaning king.
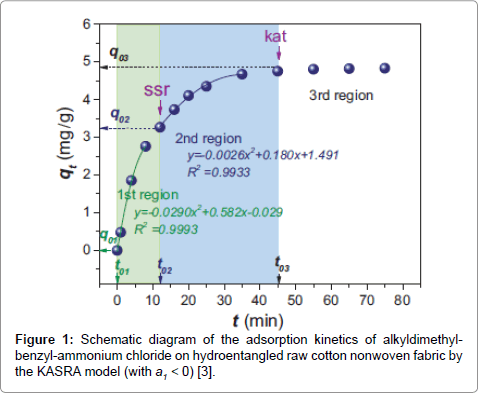
Figure 1: Schematic diagram of the adsorption kinetics of alkyldimethylbenzyl- ammonium chloride on hydroentangled raw cotton nonwoven fabric by the KASRA model (with a1 < 0) [3].
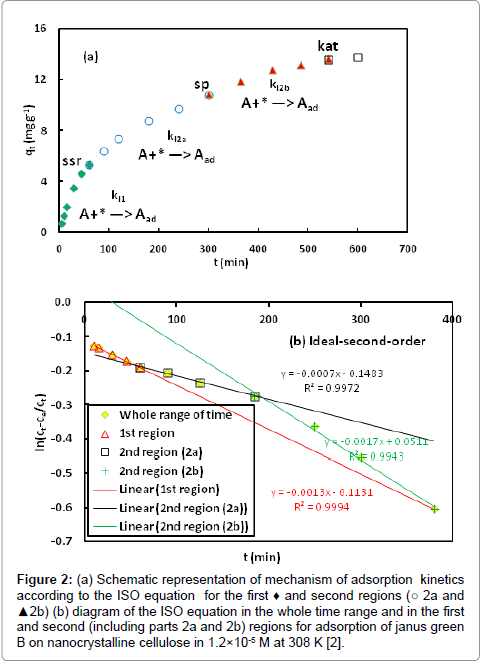
Figure 2: (a) Schematic representation of mechanism of adsorption kinetics according to the ISO equation for the first ♦ and second regions (○ 2a and ▲2b) (b) diagram of the ISO equation in the whole time range and in the first and second (including parts 2a and 2b) regions for adsorption of janus green B on nanocrystalline cellulose in 1.2×10⁻⁵ M at 308 K [2].
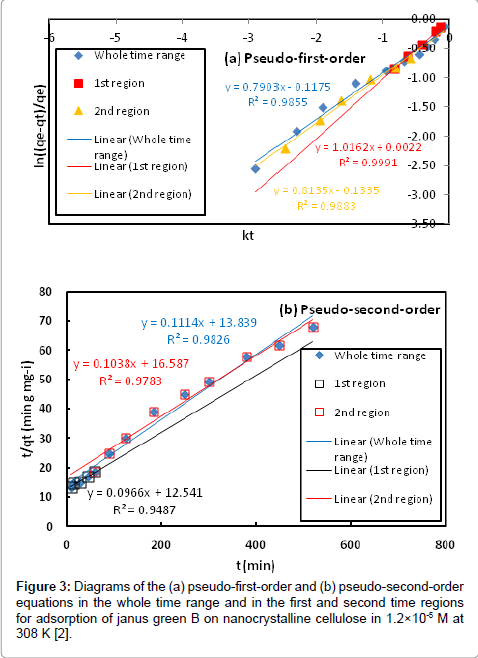
Figure 3: Diagrams of the (a) pseudo-first-order and (b) pseudo-second-order equations in the whole time range and in the first and second time regions for adsorption of janus green B on nanocrystalline cellulose in 1.2×10⁻⁵ M at 308 K [2].
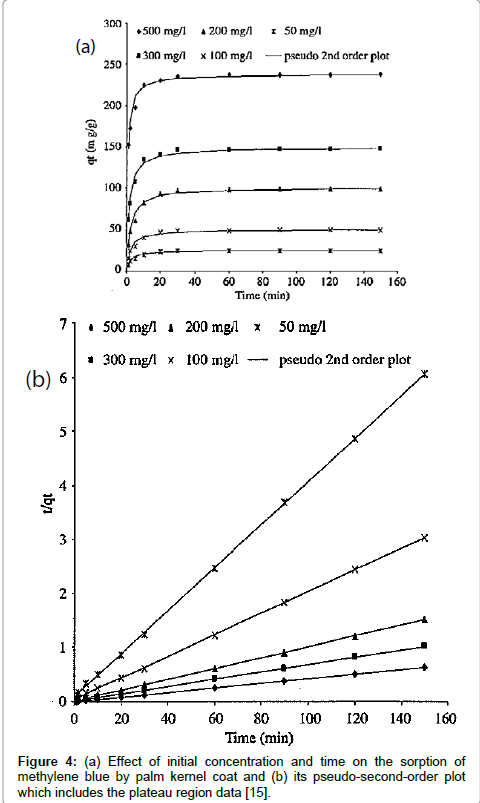
Figure 4: (a) Effect of initial concentration and time on the sorption of methylene blue by palm kernel coat and (b) its pseudo-second-order plot which includes the plateau region data [15].
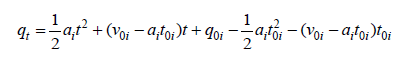
Due to the factors such as steric hindrance of adsorbed species, electric repulsion between adsorbed and free species of adsorbate (if charged), that are named as braking effect, features of the adsorption kinetics in the second region are different from those of the first region. The KASRA (Kinetics of Adsorption Study in the Regions with Constant Adsorption Acceleration) equation was introduced by Samiey [1] in 2014 and is as follows:
 (1)
(1)
Where qt is the adsorption capacity of adsorbent at each certain time, q0i ʋ0i and t0i are the starting qt, velocity and time values in ith region, respectively and ai is the acceleration of adsorption kinetics in the ith region and i =1− 3 . Because of decrease in adsorbate concentration during adsorption process ai values are negative. As reported [1-3], at each constant temperature, ʋ0i and  values decrease from the first to the second region and in each region their values increase with increase in shaking velocity. Also, in each region, ʋ0i and values increase with increase in temperature [1,2]. The KASRA equation is expressed as
 (2)
(2)
Where  and
and  q01 And q01 values are equal to zero and q02 and t02 are the coordinates of ssr point. Finally, the plateau (third) region begins at the equilibrium time, te and the equilibrium adsorption capacity, qe which are coordinates of kat point. In this region v03 = a3 = 0, q03 = qe and t03 = te and Equation (1) reduces to qt = qe. As an example, analysis of adsorption of janus green on nanocrystalline cellulose by the KASRA model is shown in Table 1.
| [JG] | te | qe | t02 | q02 | First region | Second region | ||
| mM | min | mg g-1 | min | mg g-1 | a1 | va | a2 | v02 |
| 0.012 | 520 | 7.6 | 60 | 3.2 | − 7.80×10⁻⁴ | 0.077 | − 1.77×10⁻⁵ | 0.016 |
| 0.024 | 600 | 13.7 | 60 | 5.3 | − 1.86×10⁻³ | 0.145 | − 4.86×10⁻⁵ | 0.034 |
| 0.040 | 480 | 17.7 | 45 | 2.8 | − 2.76×10⁻³ | 0.128 | − 1.57×10⁻⁴ | 0.081 |
Table 1: Experimental te, qe, t02 and q02 values and coefficients of the KASRA equation for kinetics of Janus green (JG) adsorption on Nano crystalline cellulose at 308 K [2].
Ideal-second-order equation: When one molecule of adsorbate interacts with one adsorption site
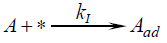 (3)
(3)
And the adsorption rate can be written as
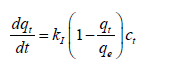 (4)
(4)
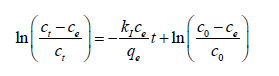
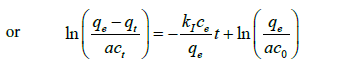
Where k1 and  are the adsorption rate and the fraction of unoccupied adsorption sites in each region (according to the KASRA model). Finally we have [2],
 (5)
(5)
 (6)
(6)
Where  and M, v and w are the molar weight of adsorbate (mg mole-1), used volume of adsorbate (ml) and weight of adsorbent (g), respectively. Also, c0 and ce are the initial and equilibrium concentrations of adsorbate (M), respectively. Equations (5) And (6), based on the assumption that adsorption sites in each region don’t affect each other, are named the ideal-second-order (or abbreviated as ISO) equation (2) and were introduced by Samiey [2] in 2015. As reported earlier [2], due to non-ideal behavior of adsorption sites, three ideal rate constants were observed during adsorption of methylene blue or Janus green B on Nano crystalline cellulose surface. One of them was in the region one and two other ones were in the parts 2a and 2b of the region 2. The first part of the second region, 2a, starts after ssr point and the second one, 2b, starts after starting second part point or abbreviated as sp point, (Figures 2a and 2b).
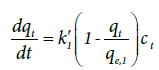
Pseudo-first- and pseudo-second-order-order equations: The pseudo-first-order equation is proposed by Lagergern [4,5] in 1898. As we know, adsorption of one molecule of adsorbate by one adsorption site is first-order with respect to adsorbate and adsorption site and adsorption rate equation is written as [2],
 (7)
(7)
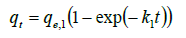
Where k1′ the adsorption second-order is rate constant and qe, 1 is the calculated equilibrium adsorption capacity. In Equation (7), if we assume ct remains constant during experiment and integrate it from t = 0 at t = 0 to qt = qt at t = t we have
 (8)
(8)
Where 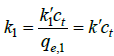 is the pseudo-first-order rate constant and
  .
.
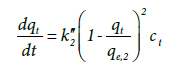
On the other hand, if the adsorption process occurs between one molecule of adsorbate and two adsorption sites, the rate equation [6-10] is written as follows:
 (9)
(9)
Where k”2 the third-order is rate constant and qe,2 is the calculated equilibrium adsorption capacity. By assuming ct remains approximately constant during the process, we have
 (10)
(10)
Where 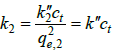 is the pseudo-second-order rate constant and
  . These equations are used frequently for analysis of data of adsorption kinetics experiments and some authors have tried to validate them theoretically [10,11]. But, there are big concerns in regard to using the pseudo-first- or pseudo-second-order assumptions [2]. In adsorption process, adsorbate concentration (ct ) decreases considerably with time and is not constant [2,3,11] and in some cases decreases as much as 10% of its initial concentration [1,2]. Thus, the pseudo first and pseudo second order assumptions are not satisfied and they do only the mathematical fitting of data. Other points observed regarding these two equations are as follows: (1) as referred in the KASRA model and ideal-second-order and KASRA equations [2], effect of occupied sites on the behavior of free surface sites results in non-ideality observed in their interactions with adsorbate molecules and thus there are two regions (and also two parts in the second region) before plateau region in the adsorption breakthrough curve. Therefore, it is not possible to use these equations in the whole time range of experiment, (Figures 3a and 3b), (2) Due to the shape of adsorption kinetics graphs in the first and second regions, when data of the whole time range of experiments are used in these two equations, most data of the first region (compared to the second region) fit to the pseudofirst- order equation while more data of the second region fit to the pseudo-second-order equation [2,12,13], (3) Data of plateau satisfy the pseudo-second-order equation where no adsorption process occurs in this region, (Figures 4a and 4b) [2,14,15], (4) Only by using data of the whole time range, qe,1 and qe,2 values are similar to experimental qe,(5) Authors of theoretical works use the whole time range as a region for their calculations to calculate a pseudo-first- or pseudo-second-order rate constant for adsorption process that is not a right assumption [7-10,16] and finally (6) The pseudo-first- and pseudo-second-order rate constants are mixed constants [17] and also they include ct variable values and usually do not change orderly with temperature and we can’t use them in the Arrhenius equation to calculate activation energy of adsorption process [1,18,19].
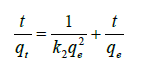
Elovich equation: The Elovich equation [20] is as follows
 (11)
(11)
Where α is the initial adsorption rate and β is the adsorption constant related to the surface coverage. This equation does not satisfy the whole time range of adsorption process, (Figure 5a). As reported [2], when according to the KASRA model, the Elovich equation was used in two regions, initial velocities decrease from the first to the second region.
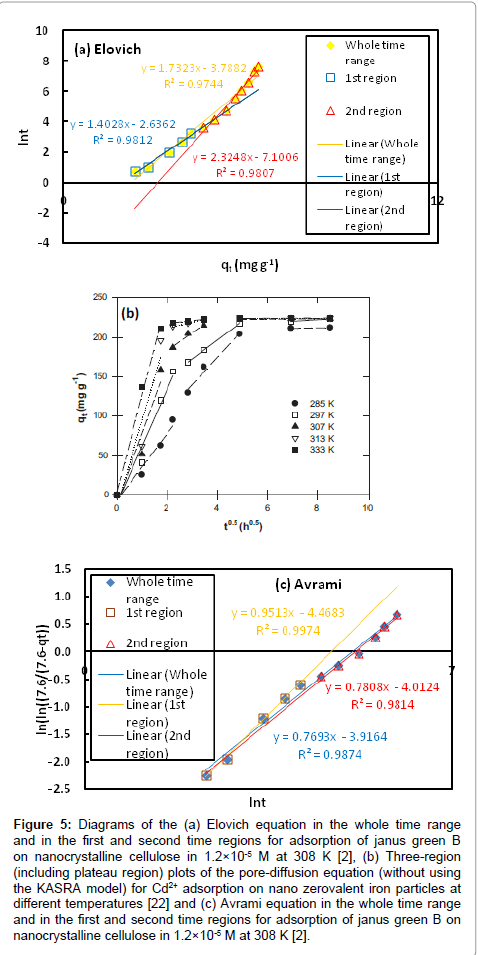
Figure 5: Diagrams of the (a) Elovich equation in the whole time range and in the first and second time regions for adsorption of janus green B on nanocrystalline cellulose in 1.2×10⁻⁵ M at 308 K [2], (b) Three-region (including plateau region) plots of the pore-diffusion equation (without using the KASRA model) for Cd2+adsorption on nano zerovalent iron particles at different temperatures [22] and (c) Avrami equation in the whole time range and in the first and second time regions for adsorption of janus green B on nanocrystalline cellulose in 1.2×10⁻⁵ M at 308 K [2].
Pore-diffusion equation: The pore-diffusion equation [21] is given as:
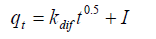 (12)
(12)
Where I is proportional to the boundary layer thickness and kdif is the rate constant for intraparticle diffusion. This equation is used for adsorption on the porous adsorbent and does not satisfy the whole time range of adsorption. As reported [1,22], kdif values decrease from the first to the second region and their values increase with increase with increase in temperature, (Figure 5b).
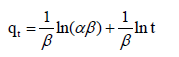
Avrami equation
The Avrami equation [23,24] is expressed as
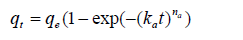 (13)
(13)
Where ka is the Avrami kinetic constant and is a measure of adsorption of adsorbate and na is the Avrami exponent of time. Data of the whole time range of adsorption kinetics don’t satisfy the Avrami equation and parameters obtained from these equations in its first and second time regions (according to the KASRA model) are different from each other [1,2] (Figure 5c). This equation was introduced to explain kinetics of crystallization and despite of adsorption process, data of crystallization within the whole range of time fit to this equation [25]. In the Avrami equation, na is held to have an integer value to show the nature of the transformation. If the growth of crystalline structure is restricted to 1 or 2-dimensions, site saturation may lead to na values of 1, 2 or 3 for surface, edge and point sites, respectively [26]. As reported [2], na values obtained from this equation for adsorption of methylene blue on Nano crystalline cellulose in the second region are about one which may be interpreted as adsorption on the surface. But, there are principally big differences between interactions involving the adsorption of adsorbate on the surface of a different compound and crystallization of a particle on the surface of the growing crystal and this is a big concern regarding using this equation for adsorption from liquid phase on the surface of an adsorbent.
ARIAN model and Henry, bilayer, LBC, Langmuir-type and reverse desorption isotherms
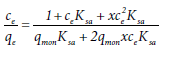
The ARIAN is an abbreviation for “adsorption isotherm regional analysis”. This model was introduced by Samiey [27] for studying adsorption isotherms up to four regions [27,28], (Figure 6). It is good to say that ARIAN is a Persian word meaning Iranian. In the ARIAN model [27] is assumed that depending on the studied concentration range, different interactions may occur between adsorbate and adsorbent. The concentration range related to each kind of interactions is called a “region” and data of various regions are interpreted by different adsorption isotherms. In each region, the surfactant concentration range that satisfies in an adsorption isotherm or small plateau is called a “section”. A region may include one or more sections. Region 1 obeys Henry’s law [29],
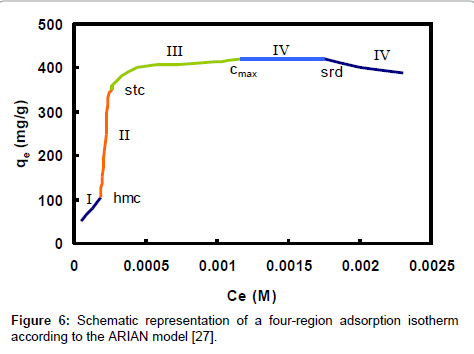
Figure 6: Schematic representation of a four-region adsorption isotherm according to the ARIAN model [27].
 (14)
(14)
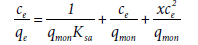
Where K is the binding constant of adsorbate on the surface and adsorption increases linearly with concentration. Region 2 which starts from the “starting second region concentration” (abbreviated as ssc) or in surfactants from the hemimicelle concentration (abbreviated as hmc), includes only the formation of monolayer surface aggregates and can be studied by an appropriate isotherm such as the Langmuir, Temkin, etc. In region 3, molecular aggregates (or admicelles and new surface clusters in the case of surfactants) form. The concentration in which region 3 starts, is called the “starting third region concentration” (abbreviated as stc). Data of region 3 are analyzed by the bilayer equation, Equation (15), and its derived ones, Equations (16) and (17), and equilibrium constants of monolayer and bilayer adsorption of adsorbate molecules are obtained. Region 4 starts from maximum adsorption capacity qmax. The surfactant concentration corresponding to maximum adsorption capacity is symbolized by cmax. This region is studied by the reverse desorption equation, Equation (18), whether it is as plateau or declining curve. Assuming adsorption occurs mostly in the first and second layer and we have
 (15)
(15)
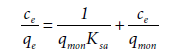
Where qmon ksa and x are the monolayer adsorption capacity and adsorption equilibrium constants of adsorbate molecules in surface aggregates and in the second layer in the concentration range between stc and cmax, respectively. Equation (15) is called “bilayer isotherm” [27]. If adsorbate molecules are adsorbed mostly on the first layer,  Equation (15) is reduced to [27]
 (16)
(16)
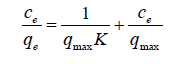
This is used for low bilayer coverages (abbreviated as LBC) and is named the LBC isotherm. On the other hand, if the adsorption process is monolayer, Equation (15) is reduced to [27],
 (17)
(17)
Where Equation (17) is the Langmuir-type equation. In region 4 of four-region isotherms, (after cmax value) either the adsorption remains constant (as plateau) or graph goes down. In the latter case, with increase in surfactant concentration, surfactant molecules desorb into the solution and thus, this interaction is named “reverse desorption”. The concentration in which the reverse desorption starts, is called “starting reverse desorption concentration” (abbreviated as srd) [27]. The reverse desorption is analyzed by the reverse desorption isotherm.
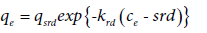 (18)
(18)
Where qsrd and krd are the equilibrium adsorption capacity and reverse desorption constant at srd, respectively. The formation of bilayer and surface aggregates has been reported by some authors [27-31]. The reverse desorption has been observed in some works such as adsorption of TX-100 [27] and malachite green (from aqueous 2-propnol solutions) [30] on silica gel surface. Equations (15-18) were introduced by Samiey [27]. In continuation, the Langmuir, Freundlich, Temkin and Sips isotherms are discussed. According to the ARIAN model, these isotherms are used for analysis of data of region 2. They are intensively used for the studying adsorption from gas phase and by analogy have been applied for adsorption from liquid phase.
Langmuir isotherm
Langmuir introduced his adsorption isotherm for studying physical adsorption of gases on the surface of solids [32]. This equation for liquid phase is as follows
 (19)
(19)
Where K is the Langmuir adsorption constant and qmax is the monolayer capacity of adsorbent. Also, it is generally known that this equation is converged to Henry’s law at very low concentrations of adsorbate. To use this equation, it is assumed that all adsorption sites are similar and don’t affect each other. But, most compounds used as adsorbent in adsorption from liquid phase have not uniform surface, yielding heterogeneous adsorption sites. Based on the KASRA model [1], kinetics of adsorption for each point of an adsorption isotherm such as the Langmuir isotherm, proceeds in two steps (before attaining plateau) and data of the whole time range don’t fit to the ideal-secondorder (ISO) equation [2]. This shows that in addition to decrease in the number of adsorption sites, occupied sites exert influences on the adsorption ability of vacant sites towards adsorbate molecules. This is called braking effect [2]. Thus, for each initial concentration of a kind of adsorbate molecules that are adsorbed on one kind of adsorption sites, the adsorption binding constant of process (regardless the used adsorption isotherm) is an average of the binding constants of the sites involved in the first and second time regions.
Freundlich isotherm
The Freundlich isotherm is an empirical equation used for adsorption of gases on the heterogeneous surfaces [33]. This equation is written as
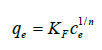 (20)
(20)
When it is used for adsorption from the gas or liquid phase, KF and n are two temperature dependent parameters and n values are usually greater than unit [34-36], (Figure 7). But, in the case of adsorption from liquid phase, KF is considered as adsorption binding constant [37]. This parameter varies randomly with temperature [38] and in most cases the changes in adsorption enthalpy can’t be calculated by them. The Freundlich equation does not show a Henry’s law behavior in low pressure (or concentrations) of adsorbate and doesn’t have a finite limit in high pressure (or concentrations). Thus, it is commonly credible in the narrow range of the adsorption data of the gas phase [39] or liquid phase adsorption [40], (Figure 8).
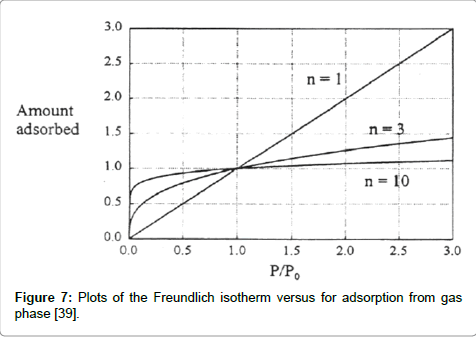
Figure 7: Plots of the Freundlich isotherm versus for adsorption from gas phase [39].
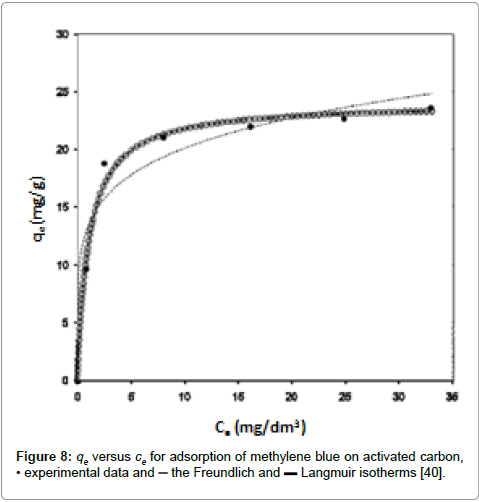
Figure 8: qe versus ce for adsorption of methylene blue on activated carbon, • experimental data and ─ the Freundlich and ▬ Langmuir isotherms [40].
Temkin isotherm
The Temkin isotherm is another empirical equation originally proposed by Slygin and Frumkin to explain the chemisorption of hydrogen on platinum electrodes in acidic solutions [39] and was used frequently by Temkin. This isotherm for liquid phase is represented by Hamdaoui et al., [41].
 (21)
(21)
Where c1 is a constant and c2 is adsorption equilibrium constant Temkin noted experimentally that heats of adsorption would not linearly increase with surface coverage [42]. This equation considers indirect adsorbate-adsorbate interactions [42] supported by kinetic evidence (The KASRA model and ISO equation) [1,2]. As reported [1,2,27,30,43], data of adsorption process in the second region of adsorption isotherm (according to the ARIAN model) properly fit to the Temkin equation and we can obtain entropy and enthalpy changes of the process using adsorption equilibrium constants obtained from this equation. Adsorbate molecules and adsorbent surface may interact through hydrogen bonding, ionic, ion-dipole interactions, etc. and depending on the nature of interaction; ΔH values may be zero, positive or negative. Although during adsorption process, number of particles decreases but ΔS values may be positive. This may be due to the release of solvent molecules from the salvation shell of adsorbate or surface of adsorbent [27,44] or breaking interactions (for example hydrogen binds) between surface functional groups [28] during adsorption process.
Sips isotherm (Langmuir-Freundlich)
In 1948, Sips proposed an equation similar in form to the Freundlich equation, but it has a finite limit when the pressure of gas is sufficiently high and none of them have the right behavior at low pressure and don’t give the correct Henry’s law limit [39,45]. The Sips isotherm is used for evaluation of isosteric heat of gas adsorption [39,46]. This equation is sometimes called the Langmuir-Freundlich isotherm because it has the combined form of Langmuir and Freundlich isotherms [39]. The Sips isotherm for liquid phase is as follows
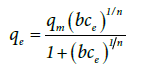 (22)
(22)
Where qm is the maximum adsorbed amount, b is the adsorption binding constant and n could be regarded as the parameter characterizing the system heterogeneity [47].
Dubinin-Radushkevich isotherm
The Dubinin-Radushkevich isotherm is an empirical equation for description of adsorption of gases on the mesoporous adsorbents [39,48,49] and for adsorption from liquid phase is shown by Azouaou et al., [50].
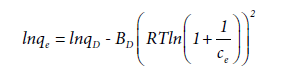 (23)
(23)
Where BD is related to the free energy of adsorption per mole of adsorbate (mol2 J-2) and qD is the theoretical monolayer saturation capacity. The apparent energy of adsorption from Dubinin- Radushkevich isotherm, E, (J mol-1) can be computed using the relationship
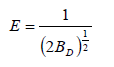 (24)
(24)
Heat of adsorption (E) values in liquid phase are positive and vary irregularly with temperature and there is no relation between E and enthalpy change or adsorption equilibrium constant values of adsorption process in liquid phase [1,2,41,43,50,51]. Thus, it can’t be used as a measure for judging about physical or chemical nature of adsorption process in liquid phase [1,27,52,53].
BET isotherm
The BET theory was proposed by Brunauer, Emmett and Teller for a flat surface and there is no limit in the number of layers which can be accommodated on the surface. In this theory, it is assumed that the surface is energetically homogeneous and there is no interaction among adsorbed molecules [39]. The liquid phase BET isotherm [54,55] is as follows,
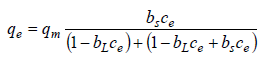 (25)
(25)
qm(mg/g) is the amount of adsorbate per unit weight of adsorbent, ce is the solute equilibrium concentration, bs is the equilibrium constant of adsorption on the first layer, bL the equilibrium adsorption desorption constant for upper layers of adsorbate on the adsorbent. In the liquid phase, due to interactions of solvent with adsorbate molecules and limitation of freezing of solvent in low temperatures, an infinite number of adsorbate layers don’t build up on the surface of adsorbent and formation of bilayers on the adsorbent surface has been reported [27]. Thus, fitting of data to the BET isotherm for adsorption from liquid phase has no physical meaning and parameters obtained from Equation (25) are meaningless.
During the adsorption from gas phase, gas molecules (or atoms) are adsorbed on the surface through either van der Waals interaction at low temperatures or forming new chemical bonds with surface. There exists an equilibrium relationship between free and adsorbed molecules of adsorbate. At sufficient high pressures, gas molecules (or atoms) are adsorbed as multilayer and finally are liquefied on the adsorbent surface. But, in liquid phase, solvent molecules interact both with adsorbate and with the surface of adsorbent. During the adsorption in liquid phase, the number of solvent molecules attached to the surface and adsorbate changes and the role of solvent molecules in enthalpy and entropy changes of the adsorption process should be considered and in some cases the entropy change of adsorption is positive [1,27]. Also, in the case of self-assembled compounds (such as surfactants), depending on the kind of adsorbent, they may be adsorbed as bilayer [27] and the temperature of carrying out the adsorption process can’t be less than the freezing point of solvent. Thus, the molecules in liquid phase (despite of gas phase) are not adsorbed through physisorption. They are adsorbed through non-covalent chemical interactions including electrostatic interactions (such as hydrogen bonding), hydrophobic effects, van der Waals interactions and π-π interactions [56], (Figure 9).
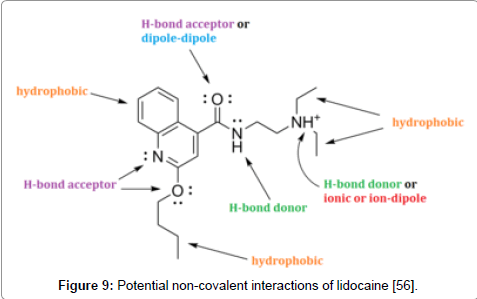
Figure 9: Potential non-covalent interactions of lidocaine [56].
(1) It is better to use a concentrated stock solution of adsorbate and prepare different concentrations of adsorbate solutions by diluting it, (2) Before starting experiments to draw adsorption isotherms, we should determine the time period for the most diluted and concentrated samples to reach equilibrium at the lowest and highest used temperatures and apply the greater time period than them in thermodynamic experiments, (3) Using heater-stirrer apparatus (rather than a shaking water bath) to work in temperatures higher than room temperature causes a thermal gradient from the bottom to the top of the sample container and thus results in wrong data, (4) Due to physical differences in the structure of particles, for example due to different sizes of adsorbent particles in an un sieved powder adsorbent or probable cracking the particles to smaller ones during their shaking or different texture of filter paper used as adsorbent, etc. a number of outliers may be obtained for qe or qt. Thus, to draw an adsorption isotherm, we should prepare sufficient number of samples (at least 20) in the used concentration range of adsorbate. Similarly, in the case of kinetic measurements we should remove any outlier data and repeat the experiments, (5) when we carry out the kinetic experiments, the temperature of adsorbate solution should be regulated and kept constant before adding adsorbent to it. This is very important specially to do experiments in the short periods of time, (6) In the case of existence of two different kinds of adsorption sites, adsorption kinetic diagram in the whole time range is composed from two adsorption kinetic curves that each one is analyzed separately [43]. But, some authors [57,58] incorrectly attribute these sequential adsorption kinetic curves to one kind of adsorption site, (Figure 10), (7) Data of plateau region aren’t used in kinetic and thermodynamic measurements. But during study of rapid adsorption process, some authors [59] report data of plateau region rather than data of regions before it, Figure 11 and (8) Under alkaline conditions, metal ions participate as metal hydroxide and it was wrongly reported [60] that adsorption capacity of adsorbent was increased, (Figure 12).
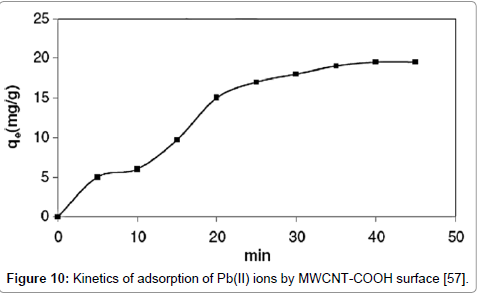
Figure 10: Kinetics of adsorption of Pb(II) ions by MWCNT-COOH surface [57].
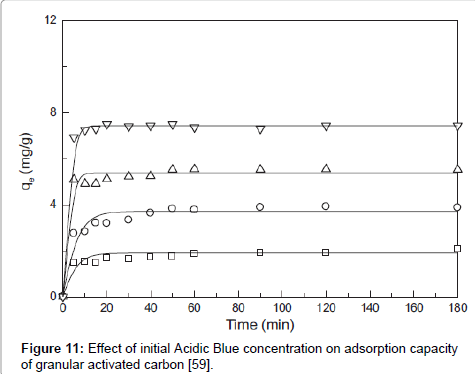
Figure 11: Effect of initial Acidic Blue concentration on adsorption capacity of granular activated carbon [59].
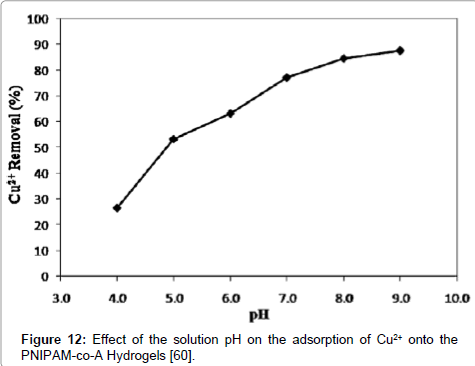
Figure 12: Effect of the solution pH on the adsorption of Cu2+ onto the PNIPAM-co-A Hydrogels [60].
The KASRA model indicates that adsorption kinetics is threeregion (including plateau region) which is due to the effect of the occupied sites on the adsorption rate of adsorbate on free adsorption sites which is called braking affect. We can obtain the acceleration and velocity of adsorption in each region by the KASRA equation. Also, the ISO equation confirms that adsorption rate constant changes during the process progress with time and thus binding constant values change with time. As reported in literature, kinetic data in the whole range of time do not satisfy adsorption kinetics equations and based on the KASRA model, parameters of an adsorption kinetics equation (such as the Elovich, Avrami, pore-diffusion, ideal-second-order (ISO) equations, etc.) are calculated for the first and second regions. Also, it was shown that data of adsorption kinetics, due to considerable decrease in adsorbate concentration, don’t satisfy the pseudo-firstand pseudo-second-order equations. On the other hand, according to the ARIAN model for adsorption thermodynamics, depending on the used adsorbent and adsorbate, adsorption isotherm may involve up to 4 regions. In region 1, the adsorption capacity changes linearly with equilibrium concentration of adsorbate. In region 2, we can use an appropriate isotherm such as the Langmuir or Temkin, etc. In region 3, which new aggregates or second layer form, the bilayer isotherm or its derivatives (the LBC and Langmuir-type isotherms) can be used and in region 4 that plateau attains or graph goes down, the reverse desorption isotherm is used. Finally, it is shown that in liquid phase there is no relation between heat of adsorption obtained from the Dubinin-Radushkevich isotherm with adsorption binding constant or adsorption enthalpy change and also parameters obtained from BET isotherm for liquid phase are meaningless.