Journal of Proteomics & Bioinformatics
Open Access
ISSN: 0974-276X
ISSN: 0974-276X
Research - (2019)Volume 12, Issue 5
Hepatitis is a global disease that is on the rise and is currently the cause of more deaths than the human immunodeficiency virus each year. As a result, there is an increasing need for antivirals. Previously, effective anti-virals have been found in the form of substrate-mimetic antiviral protease inhibitors. The application of machine learning has been used to predict cleavage patterns of viral proteases to provide information for future drug design. This study has successfully applied and compared several machine learning algorithms to hepatitis C viral NS3 serine protease cleavage data. Results have found that differences in sequence-extraction methods can outweigh differences in algorithm choice. Models produced from pseudo-coded data sets all performed with high accuracy and outperformed models created with orthogonal-coded data sets. However, no single pseudo-model performed significantly better than any other. Evaluation of performance measures also show that the correct choice of model scoring system is essential for unbiased model assessment.
Hepatitis C; NS3 Protease; Peptide Cleavage; Machine learning
HCV: Hepatitis C Virus; HIV-1: Human Immunodeficiency Virus; DAA: Direct Acting Antiviral; NS: Non- Structural; NS3P: NS3 Serine Protease; SVM: Support Vector Machine; TP: True-Positive; FP: False-Positive; TN: True-Negative; FN: False- Negative; Ortho: Orthogonal; RF: Random Forest; GLM: Generalised Linear Model; LDA: Linear Discriminant Analysis; ANN: Artificial Neural Network; ROC: Receiving-Operator Characteristic; PR: Precision-Recall; MCC: Matthews- Correlation Coefficient; AUC: Area Under Curve
Hepatitis C virus (HCV) is a member of the Flaviviridae family, alongside yellow fever virus and west nile virus [1]. Hepatitis is a global disease that caused 1.34 million deaths in 2015, higher than the number of deaths caused by HIV. It is estimated that each year 1.75 million people newly acquire HCV infection. Chronic infection of HCV is the main reason for liver transplantation worldwide. Infection can lead to severe liver disease and primary liver cancer [2]. Since 2014, several direct acting antivirals (DAA’s) have been approved that target specific HCV proteins or RNA elements [3]. Prior to this, treatment consisted of general use antivirals, such as ribavirin and pegylated interferon-α. These treatments were often lengthy and caused many adverse side effects [4]. Detailed information about HCV replication components enabled the development of DAA’s. The HCV RNA genome encodes a long polyprotein precursor which is processed proteolytically. The release of non-structural (NS) proteins is vital for the virus’s maturation. Cleavage of NS proteins is catalysed by the viral encoded NS3 serine protease (NS3P) [1]. Because of the protease’s importance in the life-cycle of the virus it has become an attractive antiviral target. Inhibition of the protease is effective and can lead to the production of non-infectious viral particles [5]. Therefore, the design of NS3P inhibitors has received much attention and several of these DAA’s have now been discovered, many of which incorporate substrate mimetic properties [6-9]. To design effective protease inhibitors, it is important to understand and predict HCV cleavage sites in proteins, as inhibitor molecules mimic cleavable substrates. Prediction and characterisation of viral protease cleavage sites have been determined by a number of in silico studies. The main tools used for these studies incorporate machine learning algorithms to analyse viral data sets. Supervised learning is a class of machine learning algorithms which builds predictive models based on data sets with known classifications. These models can then be used to classify new unknown data sets [10]. There have been many successful studies in which machine learning algorithms have been used to identify substrate specificity of the human immunodeficiency virus (HIV-1) protease. A wide range of supervised algorithms exist and several of them have been applied to predict the substrate specificity of proteases. The most recent studies tackling the HIV-1 protease cleavage problem commonly use four types of classifiers: artificial neural networks (ANN’s), support vector machines (SVM’s), decision trees and linear models. Within these studies ANN’s have outperformed many other models, with most studies able to obtain an accuracy of ~92% [11-13]. Although the predictive accuracies of ANN’s are high, they have come under criticism for their longer run times and limited interpretability when compared to other models [14]. A number of studies have compared a handful of classifiers against one another to see which performs best using HIV-1 data [11,12,14]. In return this information has helped development of HIV-1 protease inhibitors. Currently, almost half of all anti-HIV compounds are protease inhibitors [15]. As mentioned, there is a large number of machine learning algorithms available in the bioinformatics toolbox to predict cleavage sites of viral proteases. Choosing the correct method is essential for accurate predictions. Previously, this information has been useful for the design of antivirals. This study aims to apply and compare several machine learning algorithms to an HCV NS3P data set and to see whether differences in sequence-data transformation and model selection improves prediction accuracies based on three performance metrics.
Data sets
The data set obtained by Narayanan et al. [13] was removed of all peptides containing non-normal amino acids and the resulting modified data set was used for this study. The data set contained a collection of decapeptides and their cleavage ability, either cleaved or non-cleaved, denoted by 1 or 0 respectively. Out of the 891 peptides collected, 145 are classified as cleaved and 746 as non-cleaved. The amino acids of each peptide were arranged following standard Schechter and Berger nomenclature: P6-P5-P4-P3-P2-P1-P’1-P’2-P’3-P’4, where cleavage occurs between the scissile bond at P1-P’1 [16].
Sequence-based feature extraction
Two sequence-based feature extraction methods were implemented to convert each peptide into a numerical feature vector which accurately stores the composition of amino acids. The selected methods were orthogonal (ortho) coding and pseudo coding. Ortho coding created a vector which represents each amino acid by a 20-bit long binary sequence. Pseudo coding created a vector by calculating the frequency of each amino acid at each position. Ortho and pseudo coding were applied to the modified data set to produce two new data sets. Both the ortho and pseudo coded data sets were used in the study for all machine learning algorithms.
Machine learning algorithms
Several machine learning algorithms were applied to predict HCV protease specificity, including three ANN’s [17], Random Forest (RF) [18], a Generalized Linear Model (GLM) [19], Linear Discriminant Analysis (LDA) [20] and an SVM [21]. ANN’s are non-parametric models that can detect non-linear interactions between independent and dependent variables. ANN pass variables through a set of interconnected nodes, arranged in hidden layers, with specific weights to determine their output variable (classification) [22]. Three ANN model packages were used in this study, “darch”, “h2o” and “elmNN”. The first two packages can produce models with multiple hidden layers whereas the later uses a fixed single-hidden layer. There are now a number of open-source multilayer ANN models to choose from. The two used in this study were chosen due to their ease of use and high performance seen in other studies [23]. RF was used as it is not influenced by linearity, it assesses the outcome of a set of decision trees to classify data [24]. The RF model used was created from the “RandomForest” package. GLM, from the “stats” package, is a logistic regression model that transforms data into independent linear variables [25]. LDA attempts to project raw data from a high-dimensional space to a univariate space, it is modelled from principles of Fischer’s discriminant analysis. An LDA model was produced from the “MASS” package. The last model, SVM, creates a kernel function to map data into a high- dimensional space and finds the optimal hyperplane to classify data [26]. The package “e1071” was used to create an SVM model. As shown, each model used classifies data variables using different mathematical properties. This range of algorithms has been used extensively in biological research and provides rationale for the side-by-side comparison of all seven machine learning models. Machine learning packages were installed from the CRAN repository and ran in RStudio. Default parameters were used for all models except darch, h2o, elmNN and RF. ANN models required an optimised number of nodes and layers. Epochs were kept constant (100). Optimised number of nodes and layers were determined using general rule-of-thumb measures, in which the number of hidden nodes is no greater than double of the input nodes [27] and due to lack of computer processing power the number of hidden layers was restricted to two. Both darch and h2o algorithms performed at their best using two layers. The number of nodes found in each layer is summarised in Table 1. Optimised node parameters for ortho-elmNN were 19 and 17 for pseudo-elmNN. The number of decision trees for RF to use was optimised from 1-500. The optimal number of trees for ortho-RF and pseudo-RF were found to be 107 and 99 respectively.
| Model | Optimal Hidden Layer Nodes | |
|---|---|---|
| Layer 1 | Layer 2 | |
| Ortho-darch | 18 | 11 |
| Ortho-h2o | 19 | 13 |
| Pseudo-darch | 1 | 20 |
| Pseudo-h2o | 17 | 16 |
Table 1: ANN optimised nodes.
Evaluation measures
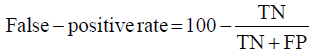
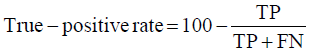
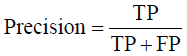
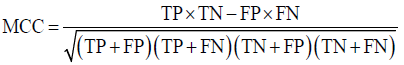
Prior to modelling, data was split by 5-fold cross-validation to produce training and testing data sets. The percentage of non-cleaved peptides in each fold was standardised at 16%, representative of the whole data set. Cross-validation of this style overcomes the bias of training the model predominantly on either negative or positive data [28]. Correct assessment of model performance is critical for determining an algorithms predictive power. Therefore, this study proposes the use of three different evaluators: receiving-operator characteristic (ROC) curves [29], precision- recall (PR) curves [30] and Matthews-correlation coefficient (MCC) [31]. Evaluative measures focus on confusion matrix results that produce true-positive (TP), false- positive (FP), true-negative (TN) and false-negative (FN) values. ROC curves use FP rates as their x-axis and TP rates as their y-axis, whereas PR curves use recall (x-axis) and precision (y-axis). Values for these curves and MCC were calculated as below:
Recall = True − PositiveRate
The area under curve (AUC) value was used as a descriptive value for ROC and PR curves. MCC values were used for the fine-tuning of parameters in ANN and RF models. Many studies using protease data often assess the quality of their models based on ROC-AUC values and accuracy. ROC is a useful tool for determining the robustness of a model by varying the discrimination threshold for prediction values. This provides more information than accuracy alone. However, most protease data sets are imbalanced. It is common to find a larger number of negative, non-cleaved, peptides than positive, cleaved, peptides. The downfalls of ROC come from this as ROC curves neglect the negative variables, enhancing positive predictions. As a result, ROC-AUC values can produce overly hopeful values. PR curves tackle this imbalance by maximising the correctly classified positive values and does not directly consider the negative values, which are not of importance to this study or to previous studies. For this reason, PR curves are more informative as the data sets have few positive instances but many negative instances. PR curves work in similar fashion to ROC in that they vary their discriminant threshold. Due to imbalanced data sets it is possible to build a model mainly on negative instances. As a result, these models can predict TN’s at a greater rate than TP’s, in turn this can obtain high accuracy scores. MCC values consider the ratio of the confusion matrix size, which is not taken into consideration by accuracy alone. As a result, the MCC score is only high when the classifier is able to correctly predict both positive and negative elements at a high level [32]. Due to its unbiased nature it is a common metric used by a US FDA initiative for predictive model consensus [33]. For these reasons the MCC values were used for optimisation and further significance testing. The Shapiro-Wilk test, Kurtosis test, median and mean were used to determine normal distribution of data obtained across five-folds of cross-validation before using parametric t-tests and ANOVA [34-37]. To determine whether the judgement of model performance differs between evaluators, Spearman’s rank was applied to the order of performance denoted by ROC-AUC, PR-AUC and MCC values [38].
Sequence-coding methods
The analysis of performance metrics shows that the application of either pseudo- coded or ortho-coded data sets to a classifier greatly affects a model’s performance. Figure 1 shows the performance of models under pseudo and ortho-coding. The pseudo-coded data set produced models with substantially higher accuracies than their ortho-coded counterparts. Ortho-coded models also showed varied performance between models, whereas pseudo-coding produced models with similar predictive powers, this can be seen clearly in Figure 1. Furthermore, a larger disparity in model performance was observed across five-folds of cross-validation in pseudo-models compared to their orthogonal counterpart, seen in Figure 2.

Figure 1: Average ROC and PR curves across five-folds of cross-validation for both orthogonal-coded (A/C) and pseudo-coded models (B/D).

Figure 2: Model performance across five-folds of cross-validation using three performance metrics (ROC-AUC, PR-AUC and MCC) for both orthogonalcoded (A) and pseudo-coded (B) models.
Model performance
Several machine learning algorithms were applied to the two data sets; AUC and MCC scores were used to quantify model performance, which is summarised in Figure 2. Experiment results show that the ortho-coded RF model (average results: ROC-AUC 0.924, PR-AUC 0.819 and MCC 0.842) outperformed all other ortho-coded models. The ortho-RF model also had a better prediction rate than its pseudo-coded counterpart. This was the only ortho-model to achieve higher performance scores than its pseudo-coded version (average results: ROC-AUC 0.914, PR-AUC 0.828 and MCC 0.892). MCC ANOVA analysis concluded that the ortho-RF model performed significantly better than any other ortho-model (p-value = 7.70x10⁻¹³). This was further validated by MCC t-test analysis between ortho-RF and the second-best performing ortho-model SVM (average results: ROC-AUC 0.868, PR-AUC 0.662 and MCC 0.640) (p-value = 0.003). The lowest scoring ortho-models were both LDA (average results: ROC-AUC 0.638, PR-AUC 0.235 and MCC 0.294) and GLM (average results: ROC-AUC 0.635, PR- AUC 0.233 and MCC 0.300) models. All pseudo-coded models predicted peptide classification with a high degree of accuracy. The highest performance was found in SVM (average results: ROC-AUC 0.972, PR-AUC 0.900 and MCC 0.860) and elmNN (average results: ROC-AUC 0.960, PR-AUC 0.883 and MCC 0.852) models. In contrast to the ortho-coded models, RF performed the worst using a pseudo-coded data set (average results: ROC-AUC 0.914, PR-AUC 0.809 and MCC 0.828). Due to the high performance of all models there was no significant difference across the predictions by pseudo-models. This was proven by MCC ANOVA testing (p-value=0.981).
Evaluation measures
Three evaluation measures were applied to all models: ROC-AUC, PR-AUC and MCC. Ranking of the models using these metrics were assessed to see which evaluative measures are consistent with each other. Consistency between metrics shows that regardless of which measure is being used it will rank model performance similarly to other measures. ROC-AUC ranked model performance analogously to PR-AUC, evidence for this was determined using Spearman’s rank correlation (ortho-model Rho= 0.964, pseudo-model Rho = 1). Although the scores are not directly comparable, as they measure different predictive qualities, in general ROC-AUC values were higher than PR-AUC and MCC values. This was exemplified by the ortho-darch model which obtained a ROC-AUC value of 0.820 but scored a dramatically lower PR-AUC (0.454) and MCC (0.494) value.
The aims of this study were to determine which machine learning algorithms can successfully predict HCV NS3P substrate cleavage sites, using two sequenced-based feature extractions methods, with high accuracies. Alongside this, the study investigated model evaluation to determine if the choice of prediction metric effects the accuracy of model performance representation.
Model performance
Results from this study has shown that the method of sequence data transformation is a limiting-factor for high-level model performance. Experimental data has shown that pseudo coding data transformation techniques enables machine learning models to accurately classify data at a higher accuracy than orthogonal coding techniques. The rationale for the large difference between model performance is due to the dependency of the training and testing data and dimension reduction found in the pattern-based pseudo coding technique. When splitting pseudo-code data into training and testing sets, the amino acids are still encoded as an observation frequency in the whole data set, this makes the split data sets dependent on each other. Reducing dimensions within a data set is extremely useful for machine learning algorithms as it enables variables of similarity to be replaced by a singular instance, in turn this can lead to improved model performance, as long as no important features are lost [39]. Therefore, it should have been no surprise that pseudo-coded models greatly outperformed their orthogonal counterparts. However, the large difference between coding techniques have not been seen in other comparative studies on viral data sets [12]. These results show that the application of feature extraction methods is imperative for enhanced predictive power. Pseudo-coded models also showed a greater variance in performance than ortho- models, as seen in Figure 2. Although pseudo-coding reduces dimensionality, which in turn should help to reduce model variance, there was still disparity between model performances across testing sets in cross-validation. As mentioned, the dependency between training and testing sets in pseudo-coding enhances pseudo-model performance. However, this dependency could also be the reason for the higher variance in pseudo-models. Individual testing folds may have a higher or lower rate of dependency on their constitutive training folds. As a result, a decreased relation between the training and testing data will reduce the model’s performance. With a large repertoire of machine learning algorithms available for biologists it is important to use the optimal one for the classification task. Ortho-models experimentally exhibited a large variance in accuracies, showing the significance of correct model choice. Of these, the RF algorithm outperformed all models under ortho- coding. In contrast, previous studies have shown that decision trees and RF perform with lower accuracies than other algorithms [11,40]. Results show that RF should not be disregarded as a potential candidate for other similar pattern recognition tasks. Overall pseudo-models showed similar predictive capabilities with moderately high variation across five-folds of cross-validation making it difficult to compare the pseudo- models. However, Figure 2 shows that some models have parallel prediction power to others. The two ANN models darch and elmNN had uniform performances across both ortho- and pseudo-models. Whereas, the ANN h2o showed greater performance whilst using ortho-code and was non-distinguishable when using pseudo-code due to the high variance between folds. This shows that the choice of specific ANN algorithm can affect the results of a machine learning task. GLM and LDA also displayed uniform performance in Figure 2. These showed the greatest difference when applying pseudo-or ortho-coding techniques. Ortho-GLM and ortho-LDA were the worst performing orthogonally encoded models whereas their pseudo counterparts performed to the same capabilities of other models. This provides evidence in favour of linear models for machine learning tasks but only if the data has been pre-processed to a high standard. The importance of model selection has been greatly questioned by pseudo-model performance. No pseudo-model significantly outperformed their orthogonal/pseudo counterparts, and all obtained high scores across all three-performance metrics used. As a result, the efficiencies of models come into question and reinvigorates the ideas put forward by Rögnvaldsson and You that if all algorithms work at a high accuracy rates the simplest algorithm with faster run times should be used [14]. With these ideas in mind the use of ANN models is unnecessary due to their slower run times, need for parameter optimisation and overall comparatively insignificant model performance.
Performance measures
When measuring model performance, a variety of metrics can be considered. This study proposed the use of three measures to give full details on a model’s prediction capabilities. Figure 2 shows the application of three performance metrics to evaluate each of the models. These three metrics showed little disparity between ranking the models. This proved the relationship between ROC and PR even though the curves and AUC values can be different [41]. Although ROC-AUC, PR-AUC and MCC are not directly comparable measurements, it was observed that ROC-AUC scores are traditionally higher than the other metrics (Figure 2). This means that evaluation of model performance based on ROC-AUC scores alone can be misleading to the wider audience of researchers without sound knowledge on the workings of ROC curves. The overly optimistic ROC-AUC values seen in Figure 2 disregard the important principles of imbalanced data sets. Studies that work on viral peptide data sets need to focus more on the identification of cleavable peptides. It is this information which is of biological importance for the development of new peptide inhibitors. Using scoring systems such as PR and MCC, alongside ROC, can help correctly assess the predictive biases found in the models. Figure 2 also shows there was little disparity between the ranking of models based on three different performance measurements. However, ROC-AUC scores were always higher than PR-AUC and MCC scores. The low performance of ortho-models was expressed more obviously in PR-AUC and MCC scores, these were over half the ROC-AUC scores in some cases. This shows that ROC-AUC evaluation alone can be misleading and unimportant when dealing with imbalanced data sets as it maximises the model’s capabilities of predicting TN’s. As mentioned previously, studies that work on viral peptide cleavage need to focus more on the identification of cleavable peptides, TP’s. It is this information which is of biological importance for the development of new peptide inhibitors. Using scoring systems such as PR-AUC and MCC help correctly assess whether a model is favoring the prediction of non-cleaved peptides when compared to ROC-AUC scores.
Reference peptides
To understand the biological significance of this study it is important to analyse the substrate predicted by the models. As a result, a set of reference peptides have been chosen for comparison against data obtained from in vitro experiments on HCV NS3P substrate specificity. True-positive predictions taken from the top performing ortho- and pseudo-models (ortho-RF and pseudo-SVM) were taken, with a discriminant threshold of 0.5, to produce a set of nine reference peptides. The results from both models can be seen in Table 2. The amino acid composition of the reference peptides have been visualised as a WebLogo in Figure 3 [42]. Experimental data has shown that the most important amino acids in substrate peptides are found to be at positions P1 and P’1, either side of the scissile bond. Enzymatic assays and consensus substrate sequence alignments have previously revealed that the following amino acids are found at each position: Asp or Glu at P6, Cys or Thr at P1 and Ser or Ala at P’1. Out of these key three positions, substrate mutations at P1 resulted in a significant decrease of substrate cleavage [4]. The reference peptides produced from this investigation support experimental evidence. Figure 3 show that the Asp at P6, Cys at P1 and Ser or Ala at P’1 are commonly found in substrate peptides, corroborating with in vitro results. Furthermore, computational models also suggest that Glu or Asp at P5 and Glu or Val at P3 could also be an important factor for substrate cleavage, see Fig. 3. Other studies have shown that acidic residues at P5 and P6 enables the substrate to form electrostatic interactions with the NS3 protease, with the potential to enhance binding [4]. These in silico results support this. With this knowledge, it is possible that peptides with similar physiochemical properties to the average substrate model in Figure 3 could form the basis of inhibitor molecules.
| Reference Peptides |
|---|
| ADVVCC-SMSY |
| DAEVVT-STWY |
| DDIVPC-SMKR |
| DDIVPC-SMSK |
| DEAEEC-ASHL |
| DEMEEC-AQHL |
| DEMEEC-ASAL |
| DEMEEC-RQHL |
| DEMEER-ASHL |
Table 2: Set of reference peptides.

Figure 3: WebLogo of reference peptides with amino acid compositions from P6 to P’4.
In silico studies that can predict the substrate cleavage sites of HCV NS3P can speed the anti-hepatitis drug development pipeline and reduce experimental costs. The need for new anti-hepatitis drugs is increasingly important as the rate of hepatitis has been rising. This study has successfully shown that several machine learning algorithms can be applied to determine substrate cleavage of HCV NS3P. It has been shown that the method of feature-extraction greatly outweighs the choice of algorithm. This has shown that more emphasis should be placed on pre-modelling techniques than the models themselves. Furthermore, it has also been shown that the use of ROC-AUC scoring as a main indicator of model performance can hide model biases towards the correct prediction of non-cleaved peptides. This information can help aid future studies on viral proteases by providing information on the importance of data transformations, model selection and model assessment. In future research work, physical and chemical features should be combined with sequence information and improved data coding techniques should be applied, as these have been found to be limiting factors over model selection. It is also hoped that multiple scoring measures will also be applied to provide transparency of model’s predictive capabilities.
I would like to thank Dr Ron Yang for being my mentor throughout the project and the University of Exeter. The research data supporting this publication are openly available from GitHub at: https://github.com/harrychown/hcvp/
Citation: Chown H (2019) A Comparison of Machine Learning Algorithms for the Prediction of Hepatitis C NS3 Protease Cleavage Sites. J Proteomics Bioinform 12:5. DOI: 10.35248/0974-276X.19.12.501
Received: 29-May-2019 Accepted: 26-Jun-2019 Published: 03-Jul-2019 , DOI: 10.35248/0974-276X.19.12.501
Copyright: © 2019 Chown H. This is an open-access article distributed under the terms of the Creative Commons Attribution License, which permits unrestricted use, distribution, and reproduction in any medium, provided the original author and source are credited.