Advances in Pediatric Research
Open Access
ISSN: 2385-4529
ISSN: 2385-4529
Research Article - (2023)Volume 10, Issue 1
Objective: The study proposes a description and a mathematical model of growth of both Silver Russell Syndrome (SRS) and Small for Gestational Age (SGA) patients, with and without Growth Hormone (GH) treatment.
Design and methods: Thirteen patients with molecular diagnosis of SRS were compared with 13 sex-paired SGA subjects. For each patient, neonatal and follow up auxological data were collected. A predictive growth model based on the gompertzian function and optimization method, already tested and validated on a cohort of GH-deficient children, was used.
Results: Baselines anthropometric values do not significantly differ between the presented SRS and SGA populations. The applied mathematical model showed same natural growth hope for SGA and SRS subjects. In SRS patients under GH treatment a significant increase in growth hope seems to emerge from the prediction model, while an improvement in growth velocity was assessed in the counterpart of SGA subjects, which exhibit early response to the treatment.
Conclusion: The proposed mathematical prediction model indicates a benefit from GH treatment for both the SRS and SGA conditions; while SGA patients showed an earlier response, SRS patients have a longer term gain. These data suggest the need to anticipate the SRS diagnosis for starting with earlier therapy.
Growth hormone; Mathematical model; Silver-russell syndrome; Heterogeneous
The Silver-Russell Syndrome (SRS) is a rare disorder characterized by heterogeneous clinical phenotypes and molecular mechanisms. The most frequent epigenetic alterations are represented by loss of methylation on chromosome 11p15 (11p15 Limitation of Motion (LOM)) and maternal uniparental disomy of chromosome 7 (mUPD7) [1]. The main clinical features reported in patients with SRS comprise a reduced prenatal growth leading to Small for Gestational Age (SGA) newborns and/or a markedly decreased post-natal growth often associated with significant nutritional difficulties and hypoglycemic events, a typical triangular face with prominent forehead and skeletal asymmetries. Since the molecular analyses fail to identify the mutation in about 60% of the cases [1], the evidence of some recurrent phenotypic traits of the syndrome makes the diagnosis prevalently clinical [2].
A clinical score based on certain parameters has been proposed in the last Consensus Statement dating back to February 2017. The simultaneous presence of four criteria out of six has been indicated sufficient to make the diagnosis, while an adherence to three criteria only requires deeper investigations, at molecular level [1].
According to the Netchine-Harbison score the main clinical six criteria are represented by the SGA condition at birth, a postnatal growth failure, a relative macrocephaly at birth, a protruding forehead, body asymmetry, feeding difficulties and/or low Body Mass Index (BMI) [1]. Although not all SRS subjects are necessarily born SGA, a clear overlap exists between the two conditions, both in the auxological features and in the associated co-morbidities [3]. On the other hand, the definition of SGA itself is not unique and universally accepted [4]; despite the most recent studies refer to the SGA condition all the babies with birth weight or length below the 3rd percentile or lower than 2-Standard Deviation Scores (2-SDS) from the mean, the criterion based on to the birth and weight below the 10th percentile is still widely used, overall in the context of the neonatology [5]. As for SGA patients [6,7], SRS individuals have an increased risk of developing insulin resistance, the metabolic syndrome in adulthood, a precocious or early puberty and a psychomotor delay [1].
While SGA patients are more likely to spontaneously recover during the first years of life the percentiles prenatally lost, this finding seems to be extremely rare for the SRS children: a recent study reports adult height of -3.13 ± 1.37 SDS in untreated SRS patients and of -2.12 ± 0.98 SDS in a GH-treated cohort [8]. Indeed, in case of persisting small stature and reduced growth velocity both conditions may benefit from the GH treatment [9], even if little data exist so far on the response to the treatment in the SRS condition. The present study proposes a description of the growth in a population of SRS and SGA patients, exposed and not exposed to treatment with GH. A mathematical model is presented to predict the growth trend in the two diagnostic categories, also providing a predictive estimate of the growth over time.
Data availability statement
The present study is based on data from the Regina margherita children hospital’s anonymized medical data archive. The study was approved by local committee AOU San Luigi Gonzaga in accordance with Helsinki Declaration. Informed consent was obtained from patients’ parents. The authors have nothing disclosure/conflict of interest to disclose.
Patients
All the patients with a molecular diagnosis of SRS, followed between august 2010 and december 2018 at the Paediatric Endocrinology Department of the regina margherita children hospital in Turin, Italy, have been included. The data collection allowed the identification of 14 SRS patients; one of them was then excluded because he harboured a molecular alteration not yet associated with the disease.
In the molecularly characterized patients, the investigated clinical criteria associated with the SRS condition, according to the Netchine-Harbison score, were: It includes
1. Postnatal growth failure
2. Relative macrocephaly at birth
3. Protruding forehead
4. Body asymmetry
5. Feeding difficulties and low BMI
The 13 SRS patients of the study were then coupled with 13 SGA subjects from a cohort followed at the Regina Margherita Children Hospital between August 2010 and December 2018, with a match-pair selection. Subjects with disproportionate short stature, chromosomal or other genetic alterations, clinical signs of Turner or SHOX syndromes have been excluded. Among all selected patients, 10 have been treated with rhGH (5 SRS and 5 SGA); untreated patients (8 for SRS and 8 for SGA) were therefore considered as a control group for the growth (Figure 1 and Table 1).

Figure 1: Diagram of patients’ selection.
| SRS | ||||||||||
|---|---|---|---|---|---|---|---|---|---|---|
| S no | Sex | Main clinical criteria | rhGH treatment | Age at start of treatment | Epigenetic alteration | |||||
| 1 | 2 | 3 | 4 | 5 | 6 | |||||
| 1 | F | + | + | - | + | + | - | Yes | 1.883 | Upd(7)mat |
| 2 | F | + | n.a. | - | + | + | + | Yes | 2.988 | Upd(7)mat |
| 3 | M | + | + | + | - | + | + | No | - | 11p15LOM |
| 4 | M | + | + | + | - | - | + | Yes | 6.753 | 11p15LOM |
| 5 | F | + | - | + | + | + | + | No | - | 11p15LOM |
| 6 | M | - | + | - | - | - | n.a. | No | - | 11p15LOM |
| 7 | F | + | + | + | - | - | - | No | - | 11p15LOM |
| 8 | M | + | + | + | - | + | + | No | - | 11p15LOM |
| 9 | F | - | + | + | + | - | + | No | - | Upd(7)mat |
| 10 | F | + | + | + | + | - | + | No | - | Upd(7)mat |
| 11 | M | + | + | n.a. | + | + | + | No | - | 11p15LOM |
| 12 | F | - | n.a. | n.a. | + | + | n.a. | Yes | 7.876 | 11p15LOM |
| 13 | F | + | + | n.a. | + | + | - | Yes | 4.066 | 11p15LOM |
Note: F: Female; M: Male; +: Present; -: absent; n.a.: not available; 1: SGA condition at birth; 2: Postnatal growth failure; 3: Relative macrocephaly at birth; 4: Protruding forehead; 5: Body asymmetry; 6: Feeding difficulties and/low BMI.
Table 1: SRS patients’ clinical features and adherence to consensus main clinical criteria.
Data on gestational age, sex, neonatal auxological parameters (weight, length and head circumference), have been collected in all 26 patients, at baseline and at the biannual or annual follow-up monitoring. General physical examination at each time, aimed at highlighting the clinical features of the syndrome, allowed to better characterize the phenotype. Weights have been recorded by using appropriate scales according to age; heights have been measured with the Harpenden's Infantometer in infants up two years of age, with the Harpenden's statimeter afterwards; the relative SDS has been calculated for each measurement. Different growth curves were used, depending on the age and the considered variables: INeS’ curves for the neonatal age [10], WHO curves for patients aged less than two years [11] and Tanner’s ones for the following ages [12]. SDS and decimal age have been calculated with Growth Calculator 4 (Software House Web-oriented and SIEDP, Turin, Italy).
Statistical methods
All measures in patients are showed using the classic descriptive statistics indicators. Growth values were analysed separately for the SRS and the SGA population and for presence-absence of treatment.
In order to describe the auxological general trend of the patients with the two conditions, with and without GH treatment, the RBF-PSO mathematical model was performed [13,14]. This model was already validated in a previous study on the response to GH treatment in idiopathic and organic GH-deficient patients; it was applied on children’s data to predict their growth behaviour until the final height (18-22 years old) [15]. In the present study we have used the same model to describe the growth in SRS and SGA patients, with and without GH treatment, providing an estimate of the expected growth curves.
The RBF-PSO is a mixed method that combines the Radial Basis Functions (RBFs) approximation technique with the Particle Swarm Optimization (PSO), a stochastic optimization tool. Briefly, as starting point it considers a theoretical curve for human growth, as also shown by Castorina P and Gliozzi AS [16,17], called Gompertzian function, shown below in Equation 1:
H(t)=H∞ exp{-log(H∞/H0 )exp[ri (t-t0 )]}
Where: H is the height at time t
H0 is the initial height at time t0 (i.e. the first visit value)
H∞ is the carrying capacity, i.e. the maximum value that the population can reach. It is noteworthy that this is not the maximum height that the single patient will reach in his/ her life, but the maximum height that each person of that population could reach (a “growth hope”). In this work, the carrying capacity is estimated for each patient’s group (male SRS, female SRS, male SGA, female SGA and also divided in treated/no treated subjects) using optimization methods during estimation.
ri is the growth coefficient, or “growth velocity rate”, which is strictly related to the patient’s characteristics. In the case of two patients with the same carrying capacity, the one with a bigger growth coefficient is growing faster.
In the results, another variable is considered: rmean is the ‘growth velocity’: in order to compare the eight groups, a mean growth coefficient was calculated (simple average of each ri).
The model, therefore, estimates H∞ and ri thanks to the first 4 height measurements of each patient, using numerical methods [13,18], and reconstructs the growth curves according to Equation 1.
H∞ and rmean become useful in order to compare the groups in terms of “growth velocity” and “growth hope”. In particular, a comparison could be done between SRS and SGA and before and after treatment.
The reconstructed curve does not necessary pass from the given points: indeed, the method forces the curve to be gompertzian and to have a minimal distance from the given points, while it could not pass exactly on them. For this reason, in order to control the adherence of the model to the real data, the accuracy of the model has also been calculated, using the Root Mean Square Error (RMSE) as accuracy indicator.
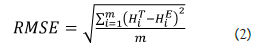
where m denotes the number of patients, HiT and HiE the real and estimated final height of the i-th patient, respectively. This indicator represents the mean difference between predicted and observed values. If the prediction is perfect, the RMSE is equal to zero; values greater than zero indicate the average deviation (in cm) between observed and expected.
The model was performed and validated using MATLAB 7.0 (The MathWorks Inc., Natick, MA, 2000).
Descriptive analysis
Table 1 depicts the presence of the 6 main clinical criteria indicated in the Consensus in our genetically characterized SRS cohort, which displayed one to five out of the six criteria. The 76.9% of the patients were born SGA; 76.9% of the subjects lack postnatal growth; 53.8% of the patients showed relative macrocephaly at birth and 61.5% a protruding forehead during the infancy; 61.5% of the children have body asymmetry and 61.5% of the patients were known to have feeding difficulties or a low BMI. The lack of data concerning the second, the third and the sixth criteria in our cohort is related to the strict time period in which they must be collected.
All the SRS patients were affected by one of two typical mutations: 30.8% had maternal uniparental disomy of chromosome 7 (mUPD7), 69.2% harboured a loss of methylation on chromosome 11p15 (11p15 LOM).
Table 2 shows the descriptive analyses for the two groups, which have been paired for size and sex (8 females and 5 males for each group). Of them, 5 females and only 1 male in each group underwent rhGH treatment. Similar baseline values were present in both SGA and SRS subjects for SDS neonatal weight, SDS neonatal length, age, SDS and BMI at first visit and length of follow up (p-values >0.05). SGA patients started the rhGH treatment on average at 7.81 years old (SD 2.28), while SRS at 5.4 (SD 2.82), a difference that does not reach statistically significance (p-value=0.1353). SGA females started the therapy later (8.07 years old) than the SRS ones (5.13 years old), but either in this case the difference was not significant (p-value=0.1329).
| SGA (n=13) | SRS (n=13) | ||||||||||
|---|---|---|---|---|---|---|---|---|---|---|---|
| Variable | All | Mean | SD | Median | Min | Max | Mean | SD | Median | Min | Max |
| Neonatal weight | (n=26) | 2.41 | 0.51 | 2.41 | 1.32 | 3.41 | 1.85 | 0.49 | 1.9 | 1.24 | 2.6 |
| SDS neonatal weight | -1.94 | 0.66 | -1.97 | -3.06 | -0.82 | -2.34 | 0.95 | -2.34 | -4.53 | -0.96 | |
| Neonatal length | 44.72 | 2.35 | 45.3 | 38.4 | 48 | 42.04 | 2.83 | 42 | 39 | 46 | |
| SDS neonatal length | -2.28 | 0.38 | -2.35 | -2.86 | -1.67 | -2.76 | 1.42 | -2.67 | -6.53 | -0.58 | |
| Age first visit | 3.08 | 2.16 | 2.13 | 0.97 | 8.27 | 2.51 | 1.96 | 1.88 | 0.25 | 6.42 | |
| SDS at first visit | -2.42 | 0.66 | -2.43 | -3.57 | -1.51 | -2.99 | 0.97 | -2.75 | -4.65 | -1.41 | |
| BMI at first visit | 14.51 | 1.17 | 14.51 | 12.55 | 16.99 | 13.4 | 1.75 | 14.05 | 10.03 | 15.98 | |
| SDS BMI at first visit | -1.18 | 0.92 | -0.98 | -2.98 | 0.67 | -2.74 | 2.69 | -1.92 | -10.4 | 0.1 | |
| Age start GH therapy | 7.81 | 2.28 | 7.97 | 4.16 | 10.3 | 5.4 | 2.82 | 5.41 | 1.88 | 8.85 | |
| Follow up (years) | 4.1 | 3.5 | 3.24 | 0.63 | 12.9 | 3.5 | 2.37 | 3.32 | 0.31 | 7.01 | |
| Neonatal weight | Females | 2.44 | 0.37 | 2.4 | 1.88 | 2.89 | 1.8 | 0.42 | 1.85 | 1.24 | 2.37 |
| SDS neonatal weight | (n=16) | -1.89 | 0.63 | -1.97 | -2.94 | -0.82 | -2.25 | 0.55 | -2.24 | -3.16 | -1.41 |
| Neonatal length | 45.11 | 1.48 | 45.5 | 41.6 | 46.3 | 42.06 | 2.88 | 41.75 | 39 | 46 | |
| SDS neonatal length | -2.14 | 0.3 | -2.1 | -2.57 | -1.67 | -2.43 | 0.92 | -2.67 | -3.18 | -0.58 | |
| Age first visit | 3.22 | 2.65 | 2.01 | 0.97 | 8.27 | 2.65 | 2.14 | 1.69 | 0.59 | 6.42 | |
| SDS at first visit | -2.42 | 0.65 | -2.36 | -3.53 | -1.72 | -3.09 | 0.86 | -2.75 | -4.28 | -1.82 | |
| BMI at first visit | 14 | 0.94 | 13.73 | 12.55 | 15.5 | 13.48 | 1.48 | 14.19 | 10.79 | 15.4 | |
| SDS BMI at first visit | -1.53 | 0.8 | -1.42 | -2.98 | -0.65 | -2.14 | 1.48 | -1.47 | -5.29 | -0.42 | |
| Age start GH therapy | 8.07 | 2.45 | 8.22 | 4.16 | 10.3 | 5.13 | 3.07 | 4.07 | 1.88 | 8.85 | |
| Follow up (years) | 4.23 | 3.98 | 3.23 | 0.63 | 12.9 | 3.4 | 2.53 | 3.02 | 0.31 | 7.01 | |
| Neonatal weight | Males | 2.38 | 0.74 | 2.41 | 1.32 | 3.41 | 1.94 | 0.64 | 2 | 1.27 | 2.6 |
| SDS neonatal weight | (n=10) | -2.04 | 0.78 | -2.12 | -3.06 | -0.87 | -2.49 | 1.51 | -2.46 | -4.53 | -0.96 |
| Neonatal length | 44.02 | 3.54 | 44.9 | 38.4 | 48 | 42 | 3.08 | 42 | 39 | 46 | |
| SDS neonatal length | -2.54 | 0.39 | -2.67 | -2.86 | -1.87 | -3.27 | 2.01 | -3.03 | -6.53 | -1.27 | |
| Age first visit | 2.82 | 0.98 | 2.89 | 1.81 | 4.29 | 2.26 | 1.78 | 2.37 | 0.25 | 4.58 | |
| SDS at first visit | -2.43 | 0.76 | -2.49 | -3.57 | -1.51 | -2.8 | 1.21 | -2.71 | -4.65 | -1.41 | |
| BMI at first visit | 15.41 | 1.06 | 15.39 | 14.02 | 16.99 | 13.25 | 2.35 | 13.9 | 10.03 | 15.98 | |
| SDS BMI at first visit | -0.53 | 0.8 | -0.59 | -1.52 | 0.67 | -3.81 | 4.11 | -2.31 | -10.4 | 0.1 | |
| Age start GH therapy | 6.51 | . | 6.51 | 6.51 | 6.51 | 6.75 | . | 6.75 | 6.75 | 6.75 | |
| Follow up (years) | 3.86 | 2.82 | 3.25 | 0.66 | 7.52 | 3.72 | 2.31 | 3.46 | 1.18 | 6.78 | |
Table 2: Descriptive analysis of the two groups.
Model results
Based on the measurements at each visit, the patients’ growth curves have been reconstructed using the above described RBF- PSO method (Figures 2a-2d).

Figure 2: RBF-PSO growth curve. Note: (a) female SRS without rhGH treatment; (b) female SGA without rhGH treatment; (c) female SRS with rhGH treatment; (d) female SGA with rhGH treatment. Circles are the real measurements, lines are the estimated curves. The different colours represent the different patients.
The ‘stars’ curves summarize in a single curve the individual estimated curves for each group of patients, separately considered on the basis of the diagnosis and for the presence or absence of treatment, thus representing the growth of an ideal ‘average patient’. Untreated patients displayed RMSE values higher than the counterpart of the treated subjects (3.54 vs. 0.32 for SRS females, 0.99 vs. 0.43 for SGA females, 1.56 vs. 0.0007 for SRS males, 2.10 vs. 1.67 for SGA males). Looking at the untreated females’ group, the difference between SGA and SRS is not relevant (same carrying capacity H∞=160, rmean=0.14 and 0.17 respectively).
After treatment, the SGA patients improve their growth velocity (rmean change from 0.14 to 0.37), unlike the SRS patients who maintain the same growth rate, but increase their carrying capacity (H∞ change from 160 to 200) (Table 3). These differences can be seen also in Figure 3a (female SGA and a female SRS in comparison) (Figures 3a and 3b).
| Categories | SRS | SGA |
|---|---|---|
| Females-No rhGH treatment | rmean=0.17 | rmean=0.14 |
| H∞=160 | H∞=160 | |
| RMSE=3.54 | RMSE=0.99 | |
| N=6 | N=8 | |
| Females-rhGH treatment | rmean=0.13 | rmean=0.37 |
| H∞=200 | ||
| RMSE=0.32 | H∞=150 | |
| N=4 | RMSE=0.43 | |
| N=4 | ||
| Males-No rhGH treatment | rmean=0.24 | rmean=0.18 |
| H∞=140 | H∞=150 | |
| RMSE=1.56 | RMSE=2.10 | |
| N=4 | N=5 | |
| Males-rhGH treatment | rmean=0.09 | rmean=0.15 |
| H∞=200 | H∞=180 | |
| RMSE=0.0007 | RMSE=1.67E-05 | |
| N=1 | N=1 |
Table 3: Comparison of coefficients, carrying capacities, RMSE and sample size in the 8 groups.

Figure 3: Comparison of pre and post rhGH therapy in a female SRS. Note: (a) female SR; (b) female SGA. Circles represent the real data, the dotted line the pre-treatment growth curve, while the straight line the post-treatment one.
Also for the untreated male patients the coefficients are similar in SGA and SRS. As concerns the treated patients, the sample size of one subject hampered the comparison of the two populations; however, an improvement of growth velocity in SGA and of carrying capacity in SRS is notable.
Prediction model
The present mathematical model has been used not only for the already shown descriptive purposes, but also for predictive purposes. While for the descriptive analysis the model curves are created by considering all the available measurements for each patient in Figures 2a and 3a construct the estimated curve only the first four measurements are given as input (Figure 4).

Figure 4: Example of growth provisions. Note: The RBF-PSO algorithm is applied only to the first four measurements of each patient (stars) and the curve (straight lines) is therefore extended. The mean difference between the last real value (circle) and the last estimated ones is 0.31 cm.
For the 3 female patients under GH treatment, the RMSE of 0.31 cm between the last real value and the estimated one indicated that a good provision of final height could be given already after treatment duration of less than two years. Furthermore, the comparison of the predicted values with the values found on the subsequent visits (white dots in Figure 4) indicated an extreme overlap between the estimated and the real data.
By considering the incidence of the SRS of 1/30,000-100,000 [1] and the difficulty in its diagnosis, a scarce literature is so far present regarding this condition, overall investigating the natural growth or after rhGH substitutive treatment of SRS subjects; the presented data refers to an indeed small cohort, but it derives from a monocentric sample of patients followed over time and it is in line with other previous studies [19,20].
Even the prevalence of 11p15LOM is in line with the literature (11p15LOM so far reported in 30%-60% of SRS patients) [21], while the prevalence of upd7mat seems higher than the 5%-10% described in literature [21]. The discordant data could be linked to a selection bias, as our sample of the patients has been chosen on the basis of a genetically confirmed diagnosis.
As regards adherence to the Consensus criteria, the importance of the molecular diagnosis emerges from our data. A definite SRS clinical diagnosis could be often cumbersome without a molecular confirmation, because of the limited period in which some criteria must be verified, for which two major issues can occur. In many subjects the diagnosis suspicion can arise later the two years of age when the precise retrospective auxological measurements could be not available; on the other hand, in patients with SRS typical signs at birth the molecular investigations could definitely define the diagnosis, even before the two years of age, the time at which the clinical score has to be assessed. The same problem of temporal nature might occur for the protruding forehead, a parameter that should be evaluated between 1 and 3 years. The Consensus statement itself highlights the limitation of this classification system in some categories of subjects, such as children below two years of age, adolescents and adults; in order to somehow bypass it, the authors suggest to possibly recovering the subjects’ photographs [1]. It is noteworthy that in our series of patients a fair percentage of SRS subjects was not born SGA. Therefore, according to our experience, in subjects born appropriate for gestational age (AGA) but displaying other highly specific criteria, such as relative macrocephaly or body asymmetry, for which a high degree of suspicion of SRS could arise, the genetic investigations for the disease would be indeed worthwhile. In the present paper, we aimed to search for the growth features in SRS and SGA, before and during rhGH treatment, by using an already described mathematical method [15]. Even if in some instances the curves obtained with a RBF-PSO method may not be exactly passed by the real data, as explained in Method section, in our case the curve well overlaps with the real points, thus highlighting that the used gompertzian equation is a good description of the human growth and also that our method is able to model efficiently the given data.
Using this model and considering GH treated or untreated, male and females patients with the two conditions, different behaviours have been found. Untreated male SGA patients displayed a greater carrying capacity than untreated male SRS, while untreated SGA and SRS females have the same ‘growths hope’. Conversely, a slight smaller growth velocity can be seen in untreated SGA patients. Under GH treatment, both female and male SRS increase in a significant way their carrying capacity, while SGA subjects seem to improve their growth velocity only, indicating an apparently major growth gain in SGA than in SRS, in an early and limited observation time. These results could reflect the same observations of Smeets [22], where no significant differences as regards the height gain were found between SRS and SGA after treatment, even if SGA were higher at the end of the treatment because they were already taller at the beginning of the therapy.
The proposed method, showing higher RMSE in the absence of GH treatment, seems to be less efficient in predicting the natural growth, classically inconstant, while it seems an optimal tool to monitor growth during the GH treatment. Indeed, in the treated population the comparison and the real overlap of the predicted values with the values found in the subsequent visits allowed to further validate the curve estimated by the model and to hypothesize that such model could really represent a good predictive tool for growth, even after only one year of therapy. Thus, the estimated curve could also be a supporting tool for the clinician in the evaluation of the response to the therapy at each follow up visit.
The increased carrying capacity emerged from the female SRS after GH treatment highlights the huge potential of growth for this group of patients, overall when associated with longer treatment. This behaviour could reflect a different reaction to the treatment in the two groups and could also suggest that SRS patients may have a greater benefit from an early therapy.
We are aware that several limitations and critical points of our work should be considered. The most noticeable is that in our sample females seem to have a greater ‘growth hope’ than males. This is probably due to the sample size and to the fact that females are more represented than males. Another point is that the reconstructed curves of untreated patients are less accurate (RMSE ≥ 1) with respect to the ones of the GH treated population. The highest frequency of the measures and the growth regularity due to the drug are the possible explanations of this fact. Also, the different long-term response of the SRS and SGA population to rhGH treatment could be related to the different age at which the therapy has been started in the two groups, not statistically significant possibly for the limited size of each population or for the limited duration of follow up.
Notwithstanding, our results seem to show that the treatment brings a benefit to both diagnostic categories; while SGA patients have a good immediate response, SRS patients have a longer term benefit. This suggests the need for an anticipation of the diagnosis and consequent earlier start of therapy. Even the sample sizes are not sufficient to generalize our conclusion to the SGA and SRS populations, these preliminary results further underline the importance of GH therapy for both groups and indicate a potential use of our model in clinical setting.
By considering the effectiveness of GH therapy in SRS, as shown also by the proposed model, a revision of the actual Italian indications for rhGH treatment in this population should be desirable, in order to include also SRS who were not born SGA and to authorize an early onset of the GH treatment that could improve the final height in these growth-restricted patients. The use of RBF-PSO model could be of great interest in the clinical practice since it can provide a predicted growth curve already after a relatively short auxological follow up and it can be easily editable over time accordingly to the new data, being a personalized model on the patient’s data; finally, a slight deviation from the expected curve would allow the clinicians to immediately notice it and further investigate the underlying causes.
[Crossref] [Google Scholar] [PubMed]
[Crossref] [Google Scholar] [PubMed]
[Crossref] [Google Scholar] [PubMed]
[Crossref] [Google Scholar] [PubMed]
[Crossref] [Google Scholar] [PubMed]
[Crossref] [Google Scholar] [PubMed]
[Crossref] [Google Scholar] [PubMed]
[Crossref] [Google Scholar] [PubMed]
[Crossref] [Google Scholar] [PubMed]
[Crossref] [Google Scholar] [PubMed]
[Crossref] [Google Scholar] [PubMed]
[Crossref] [Google Scholar] [PubMed]
[Crossref] [Google Scholar] [PubMed]
[Crossref] [Google Scholar] [PubMed]
[Google Scholar] [PubMed]
[Crossref] [Google Scholar] [PubMed]
[Crossref] [Google Scholar] [PubMed]
Citation: Alabbasi B (2023) Growth Evaluation in Silver Russel Syndrome and Small Gestational Age Patients Exposed to GH Treatment: A Mathematical Approach. Adv Pediatr Res. 10:050.
Received: 13-Dec-2022, Manuscript No. LDAPR-22-20864; Editor assigned: 15-Dec-2022, Pre QC No. LDAPR-22-20864 (PQ); Reviewed: 29-Dec-2022, QC No. LDAPR-22-20864; Revised: 05-Jan-2023, Manuscript No. LDAPR-22-20864 (R); Published: 17-Mar-2023 , DOI: 10.35248/2385-4529.23.10.050
Copyright: © 2023 Alabbasi B. This is an open-access article distributed under the terms of the Creative Commons Attribution License, which permits unrestricted use, distribution, and reproduction in any medium, provided the original author and source are credited.