Healthy Aging Research
Open Access
ISSN: 2261-7434
ISSN: 2261-7434
Research Article - (2023)Volume 12, Issue 1
The study examined the prevalence and factors associated with medical check-ups among older adults in India by using cross-sectional data from building a knowledge base on population aging in India. Multivariate analysis has been implemented to fulfil the objectives of the study. Concentration index and decomposition analysis were carried out to examine observed socio-economic inequality in routine medical check-ups. Results show that one-fourth of the older adults were undergoing routine medical check-up. Older adults’ education has significant positive association with routine medical check-ups. Concentration index value of 0.19 depicts the pro-rich inequality in health check-ups among older adults. Furthermore, the results from the decomposition analysis revealed that the wealth quintile of the household contributed nearly 57 percent to the observed socio-economic inequality in the prevalence of routine medical check-ups. Education and working status of older adults made a substantial contribution to the inequalities in routine medical check-ups and explained 16.9 percent, and 4.2 percent of the total inequality, respectively. There is a dire need to spread awareness about the usefulness of routine medical check-ups among older adults. A low level of medical check-ups among older adults in rural areas could be reduced by offering free health check-ups regularly.
Health check-up; Older adults; Decomposition; Inequality; Socio-economic
BKPAI: Building a Knowledge base on Population Aging in India; WHO: World Health Organization; ISEC: Institute for Social and Economic Change; TISS: Tata Institute for Social Sciences; IGE: Institute for Economic Growth; PSU: Primary Sampling Unit; CI: Concentration Index; SES: Socio-Economic Status; OR: Odds Ratio
Today, the world is gripped with struggles of ageing and age related issues [1]. Irreversible demographic transition is, by far and large, changing the age structure all around the globe [2]. Initially, what seemed like a developed country problem, is seeping in to even low and middle-income countries, i.e., developing countries [3,4]. It is presumed that by 2050, 80% of the elderly population would be living in low and middle-income countries [5]. According to WHO, an escalation of 250% among the elderly population can be predicted in low and middleincome countries, while just a 71% increase in the developed countries during the period of 40 years, starting from 2010 to 2050.
India is home to nearly 104 million older adults (age 60+), census 2011, and it is expected to grow to 173 million by 2026 [6]. The elderly in India mostly suffer from cardio-vascular diseases, circulatory illnesses, and cancer [7-9]. Thus, it is imperative to turn our attention to health care practices of the elderly, given the state of the increasing burden of diseases of the growing older adult population. The ageing population comes across as the most vulnerable group and in dire need of health care attention and healthy intervention. Hence, there exists a need to promote certain behavioral practices that ensure healthy ageing, the most important being regular health checkups. Even in general terms, the people who adopt health care strategies can control the onset of various health conditions, which further may result in morbidity or mortality [10].
In recent times, the promotion of health check-ups has proved to be one of the advantageous practices. It was identified that those who underwent regular health check-ups from a pre-elderly stage of life turned out to be healthier in older stages. It was also found that healthy practices, including regular health check-ups, led to early detection of the disease, which in turn paved the way towards hale and hearty older population. Early detection of long-term morbidities also decreases the socio-economic burden on patients and communities. However, older adults have little or almost no awareness and the importance of regular health check-ups in disease detection. India, notably, lags in this aspect of regular health check-ups.
Most of the research work done on the Indian elderly population highlights the prevalence of morbidities, comorbidities, or focuses on the health-seeking behavior of older adults. However, none seek to emphasize the behavioral aspect of health check-up. Regular and thorough health check-ups have been established as one of the primary habits that can sustain and ensure a healthier ageing process, yet there is a dearth of literature on the same existing studies point towards healthseeking behavior; however, the aspect of regular health check-ups remains untouched. Prevention is better than cure this phrase is particularly important regarding the elderly. Even the people who seem more or less healthy are advised to seek routine health check-ups in order to prevent the onset of various non-communicable diseases such as hypertension, type 2 diabetes, cancers, liver and kidney disorders. Preventive health care practice is an important yet widely neglected factor that can avoid or slow the progression of any medical condition. It also opens the door for the assessment of well-being, especially in the elderly.
Therefore, understanding the need of the hour, it is crucial to identify the socio-economic and demographic factors that influence the routine medical check-up seeking behavior in the older adults in India. The study seeks to understand this profile of older adults residing in seven states of India and their health check-up seeking behavior and thereby identify the areas which need special attention in order to bring forth the importance of routine health check-ups. This study also tries to discover the aspects that encourage older adults to go through a routine health check-up. The study would be of immense help for the policy-makers to encourage a routine medical check-up by identifying the factors that prove to be a hurdle and intervening to rectify them.
Data source
The present research used data from Building a Knowledge Base on Population Aging in India (BKPAI), which was a nationallevel survey and was conducted in 2011, across seven states of India. The survey was sponsored by the Institute for Social and Economic Change (ISEC), Tata Institute for Social Sciences (TISS), Institute for Economic Growth (IEG), and UNFPA, New Delhi. The survey gathered information on various socioeconomic and health aspects of ageing among households of those aged 60 years and above with the written consent of the respondents. Seven major regionally representative states were selected for the survey with the highest 60+ year’s population than the national average. This survey was carried out on a representative sample in the northern, western, eastern, and southern parts of India following a random sampling process.
Eighty primary sampling units (villages or urban wards) 40 urban and an equal number of rural with 16 households per Primary Sampling Unit (PSU) having an elderly person were covered in the survey. The respondents to the household schedule included any usual resident member above the age of 15 years, while in the case of the individual schedule all those aged 60 and above in the sampled households were the respondents and were interviewed. The PSU was villages for rural areas and urban wards in urban areas. A list of households with at least one elderly person was prepared and the prescribed number of elderly households (16 households) was selected through systematic random sampling. A total of 8,792 households were selected and 8,329 household interviews were completed with response rate of 95%. Of a total of 10,604 elderly identified from 8,329 household interviews, 9,852 elderly interviews were completed either independently or through proxy interviews with response rate of 93%. Interviews were conducted by trained field investigators. Graduation was the minimum qualification for mappers and listers, supervisors, interviewers and data entry operators.
The sample of 1280 elderly households was fixed for each state. Further details on the sampling procedure, the sample size is available in national and state reports of BKPAI, 2011. For the current study, the effective sample size was of 9541 older adults residing in seven states aged 60+ years were selected.
Outcome variables
The routine medical check-up was the outcome variable of this study. The variable of health check-up was framed from the question that “Do you go for routine medical check-up?” The response was recoded as 0 means “no,” and 1 means “yes.”
Predictor variables
The predictors included age (60-69, 70-79 and 80+ years), gender (men and women), education (no education, below five years, 6-10 years and 11+ years), marital status (not in union and currently in union), living arrangement (alone, with spouse, with children and others), economic independence (independent, pension and dependent), working status (no, yes and retired), chronic disease (no and yes).
Twenty chronic diseases were used to generate variable chronic morbidity which includes arthritis/rheumatism/osteoarthritis, diabetes, asthma, chronic lung disease (emphysema, bronchitis, COPD), etc. The wealth index drawn based on the BKPAI survey is based on the following 30 assets and housing characteristics: Household electrification; drinking water source; type of toilet facility; type of house; cooking fuel; house ownership; ownership of a bank or post-office account; and ownership of a mattress, a pressure cooker, a chair, a cot/bed, a table, an electric fan, a radio/transistor, a black and white television, a colour television, a sewing machine, a mobile telephone, any landline phone, a computer, internet facility; a refrigerator, a watch or clock, a bicycle, a motorcycle or scooter, an animal-drawn cart, a car, a water pump, a thresher, and a tractor. The range of index was from poorest to the richest i.e. ranging from lowest to the highest. The five categories of wealth are based in quintile i.e., lowest 20 percent to highest 20% (poorest, poorer, middle, richer and richest). Religion (Hindu, Muslim, Sikh, and others), caste Scheduled Caste (SC), Scheduled Tribe (ST), other backward class, and others). The scheduled caste include a group of the population that is socially segregated and financially/economically by their low status as per Hindu caste hierarchy. The Scheduled Castes (SCs) and Scheduled Tribes (STs) are among the most disadvantaged socioeconomic groups in India. The OBC is the group of people who were identified as “educationally, economically and socially backward”. The OBC’s are considered low in the traditional caste hierarchy. The “other” caste category is identified as having higher social status. Residence (rural and urban) and states (Himachal Pradesh, Punjab, West Bengal, Orrisa, Maharashtra, Kerala, and Tamil Nadu).
Statistical analysis
Descriptive statistics and bivariate analysis were used to find the preliminary results. Further, multivariate analysis (binary logistic) has been done to fulfil the objectives of the study. The results were presented in the form of an Odds Ratio (OR) with a 95% Confidence Interval (CI).
The model is usually put into a more compact form as follows:
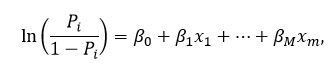
Where β_0,…..,β_M are the regression coefficient indicating the relative effect of a particular explanatory variable on the outcome. These coefficients change as per the context in the analysis in the study.
Moreover, the wealth quintile was the key variable to measure the economic status of the household. A household wealth index was calculated in the survey by combining household amenities, assets, and durables and characterizing households in a range varying from the poorest to the richest, corresponding to wealth quintiles ranging from the lowest to the highest.
The study used wealth score (continuous variable) for decomposition analysis, and for the calculation of the Concentration Index (CI), the study used a wealth quintile, which was divided into five equal sizes of the population.
Concentration index
Concentration index represents the magnitude of inequality by measuring the area between the concentration curve and line of equality and calculated as twice the weighted covariance between the outcome and fractional rank in the wealth distribution divided by the variable mean.
The concentration index can be written as follows:
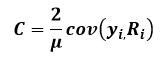
Where, C: Concentration index; yi: Outcome variable index; R: Fractional rank of individual i in the distribution of socio-economic position; μ: Mean of the outcome variable of the sample; Cov: Covariance. The index value lies between -1 to +1.
The concentration index takes a negative value if the curve is above the line of equality, suggesting a disproportionate concentration of inequality among the poor (pro-rich). If the curve falls below the line of equality, the concentration index is positive, suggesting that inequality is concentrated disproportionally among the wealthy (pro-poor). The concentration index is zero when there is no socioeconomic inequality. The CI value indicates the degree of socioeconomic disparity. The greater the absolute value, the more inequities there are.
Further, the study decomposes the concentration index to understand the relative contribution of various socio-economic factors to the routine medical check-ups among older adults. To do this, the study used a regression based decomposition technique, which was proposed by Wagstaff, et al. Each contribution is determined by the sensitivity of health to that socioeconomic component as well as the degree of income disparity in that element. Based on the linear regression relationship between the outcome variable yi, the intercept α, the relative contribution of xki and the residual error εi.
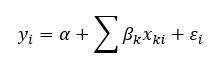
Where, εi is an error term, given the relationship between yi and xki, the CI for y (C) can be rewritten as:
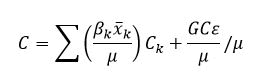
Where, μ is the mean of yi, x̄k, is the mean of xk, βk is the coefficient from a linear regression of outcome variable, Ck is the concentration index for xk (defined analogously to C, and GCε is the generalized concentration index for the error term εi).
Here C is the outcome of two components: First, the determinants or ‘explained’ factors, which are equivalent to the weighted accumulation of the concentration indices of the regressor, where one unit change in the outcome variable is to be associated with the one unit change in the explanatory variable. The explained factors indicate that the proportion of inequalities in the outcome (routine medical check-up) variable is explained by the selected explanatory factors, i.e., xk. Second, a residual or ‘unexplained’ factor ((GCε/μ)/μ), indicating the inequality in health variable that cannot be explained by selected explanatory factors across various socio-economic groups.
The socio-demographic profile of older adults is presented in Table 1. Overall, about one-fourth of the older adults went for medical check-ups. Three-fifth of the older adults belonged to 60 years-69 years age group, half of the older adults were women and illiterate. Nearly six percent of older adults were lived alone, 48% were economic dependent, and one-fourth of older adults were working. Around 65% of older adults were suffered from chronic diseases, and the majority of older adults were Hindu.
| Variables | Sample | Percentage |
|---|---|---|
| Medical check-ups | ||
| No | 7,334 | 76.9 |
| Yes | 2,205 | 23.1 |
| Age (years) | ||
| 60-69 | 5,890 | 61.8 |
| 70-79 | 2,612 | 27.4 |
| 80+ | 1,036 | 10.9 |
| Gender | ||
| Men | 4,525 | 47.4 |
| Women | 5,014 | 52.6 |
| Educational status | ||
| No education | 4,871 | 51.1 |
| Below 5 years | 1,954 | 20.5 |
| 6 to 10 years | 2,136 | 22.4 |
| 11+ years | 578 | 6.1 |
| Marital status | ||
| Not in union | 3,759 | 39.4 |
| Currently in union | 5,780 | 60.6 |
| Living arrangement | ||
| Alone | 561 | 5.9 |
| With spouse | 1,521 | 15.9 |
| With children | 6,717 | 70.4 |
| Others | 740 | 7.8 |
| Economic independence | ||
| Independent | 2,178 | 22.8 |
| Pension | 2,769 | 29 |
| Dependent | 4,588 | 48.1 |
| Working status | ||
| No | 6,419 | 67.3 |
| Yes | 2,310 | 24.2 |
| Retired | 810 | 8.5 |
| Chronic disease | ||
| No | 3,364 | 35.3 |
| Yes | 6,175 | 64.7 |
| Wealth quintile | ||
| Poorest | 2,248 | 23.6 |
| Poorer | 2,114 | 22.2 |
| Middle | 1,970 | 20.7 |
| Richer | 1,771 | 18.6 |
| Richest | 1,433 | 15 |
| Religion | ||
| Hindu | 7,570 | 79.4 |
| Muslim | 671 | 7 |
| Sikh | 898 | 9.4 |
| Others | 400 | 4.2 |
| Caste | ||
| Scheduled caste | 1,979 | 20.7 |
| Scheduled tribe | 531 | 5.6 |
| Other backward class | 3,507 | 36.8 |
| Others | 3,522 | 36.9 |
| Place of residence | ||
| Rural | 7,042 | 73.8 |
| Urban | 2,497 | 26.2 |
| State | ||
| Himachal Pradesh | 1,470 | 15.4 |
| Punjab | 1,351 | 14.2 |
| West Bengal | 1,127 | 11.8 |
| Orissa | 1,453 | 15.2 |
| Maharashtra | 1,380 | 14.5 |
| Kerala | 1,356 | 14.2 |
| Tamil Nadu | 1,403 | 14.7 |
| Total | 9,539 | 100 |
Table 1: Socio-economic profile of older adults in India.
The percentage of older adults who went for routine medical check-ups are presented in Table 2. Older adults aged 70 years-79 years (26.2%) went more for medical check-ups than 60-69 years (21.6%) and 80+ years (24.2%) age group. Interestingly, women (24.3%) went more for medical check-ups than men. Only 18% of older adults lived alone went for routine medical check-ups, whereas one-fourth of economically dependent older adults went for medical check-ups. About 28% of retired and one-third of older adults had chronic diseases went for medical check-ups? Wealth quintile had a positive association with routine medical check-ups of older adults. For instance, rich older adults went more for medical check-ups than poor ones. Moreover, low caste groups (SC-19.8% and ST-9.7%) went less for medical check-ups. Older adults who belonged to urban areas (26.8%) went more for medical checkups than rural areas (21.8%). Around 40% of older adults in Kerala, 27% in West Bengal, 25% in Maharashtra, and 24.6% in Punjab went for routine medical check-ups.
| Variables | Percentage | P-value |
|---|---|---|
| Age (years) | ||
| 60-69 | 21.6 | <0.001 |
| 70-79 | 26.2 | |
| 80+ years | 24.2 | |
| Gender | ||
| Men | 21.8 | <0.001 |
| Women | 24.3 | |
| Educational status | ||
| No education | 19 | <0.001 |
| Below 5 years | 26.3 | |
| 6 to 10 years | 25.8 | |
| 11+ years | 37.2 | |
| Marital status | ||
| Not in union | 23.8 | <0.001 |
| Currently in union | 22.7 | |
| Living arrangement | ||
| Alone | 18.3 | <0.001 |
| With spouse | 20.9 | |
| With children | 23.7 | |
| Others | 25.9 | |
| Economic independence | ||
| Independent | 17.4 | <0.001 |
| Pension | 26.2 | |
| Dependent | 24 | |
| Working status | ||
| No | 25 | <0.001 |
| Yes | 15.9 | |
| Retired | 28.4 | |
| Chronic disease | ||
| No | 5.7 | <0.001 |
| Yes | 32.6 | |
| Wealth quintile | ||
| Poorest | 13.7 | <0.001 |
| Poorer | 18.6 | |
| Middle | 24.4 | |
| Richer | 27 | |
| Richest | 38 | |
| Religion | ||
| Hindu | 21.1 | 0.045 |
| Muslim | 38.5 | |
| Sikh | 24.9 | |
| Others | 31 | |
| Caste | ||
| Scheduled caste | 19.8 | <0.001 |
| Scheduled tribe | 9.7 | |
| Other backward class | 23.1 | |
| Others | 27 | |
| Place of residence | ||
| Rural | 21.8 | 0.0237 |
| Urban | 26.8 | |
| State | ||
| Himachal Pradesh | 21.6 | <0.001 |
| Punjab | 24.6 | |
| West Bengal | 27.4 | |
| Orissa | 13 | |
| Maharashtra | 25.8 | |
| Kerala | 40.2 | |
| Tamil Nadu | 11.3 | |
| Total | 23.1 | |
| p-value based on chi-square test | ||
Table 2: Percentage of older adults went for routine medical check-ups by background characteristics in India.
Estimates from logistic regression analysis for routine medical check-ups were presented in Table 3. Older adults aged 70 years-79 years were 1.13 times more likely to go for routine medical check-ups compared to 60 years-69 years age group. Older adults with below five years (OR: 1.31; CI: 1.13-1.51), 6 years to 10 years (OR: 1.36; CI: 1.16-1.60), and 11+ years of schooling (OR: 2.02; CI: 1.6-2.54) were significantly more likely to go for routine medical check-ups than illiterate older adults. Working older adults (OR: 0.72; CI: 0.60-0.87) were less likely to go for routine medical check-ups than their counterparts. Older adults who suffered from chronic diseases were 7.71 times more likely to go for routine medical check-ups compared to those who did not. With reference to the poorest category, middle, richer, and richest older adults were 1.47 times, 1.68 times, and 2.21 times more likely to go for routine medical check-ups. Muslim older adults were 1.41 times more likely, and other religions were 0.71 times less likely to go for routine medical check-ups compared to Hindu. Urban older adults (OR: 1.06; CI: 1.01-1.19) were more likely to go for routine medical check-ups than rural counterparts. With reference to Himachal Pradesh, West Bengal, Maharashtra, and Kerala were 1.44 times, 1.24 times, and 1.37 times more likely to go for routine medical check-ups, respectively.
| Variables | OR (95% CI) |
|---|---|
| Age (years) | |
| 60-69 | Ref. |
| 70-79 | 1.13*(1.01,1.28) |
| 80+ | 0.88(0.74,1.06) |
| Gender | |
| Men | Ref. |
| Women | 1.06 (0.93,1.21) |
| Educational status | |
| No education | Ref. |
| Below 5 years | 1.31* (1.13,1.51) |
| 6 to 10 years | 1.36* (1.16,1.6) |
| 11+ years | 2.02* (1.6,2.54) |
| Marital status | |
| Not in union | Ref. |
| Currently in union | 0.98 (0.85,1.12) |
| Living arrangement | |
| Alone | Ref. |
| With spouse | 0.92 (0.69,1.22) |
| With children | 0.84 (0.66,1.08) |
| Others | 0.75* (0.55,0.99) |
| Economic independence | |
| Independent | Ref. |
| Pension | 1.08 (0.89,1.3) |
| Dependent | 0.99 (0.82,1.19) |
| Working status | |
| No | Ref. |
| Yes | 0.72* (0.6,0.87) |
| Retired | 1.02 (0.82,1.25) |
| Chronic disease | |
| No | Ref. |
| Yes | 7.71* (6.56,9.05) |
| Wealth quintile | |
| Poorest | Ref. |
| Poorer | 1.17 (0.96,1.43) |
| Middle | 1.47* (1.2,1.8) |
| Richer | 1.68* (1.36,2.08) |
| Richest | 2.21* (1.76,2.78) |
| Religion | |
| Hindu | Ref. |
| Muslim | 1.41* (1.16,1.72) |
| Sikh | 1.09 (0.85,1.4) |
| Others | 0.71* (0.55,0.92) |
| Caste | |
| Scheduled caste | Ref. |
| Scheduled tribe | 1.07 (0.91,1.25) |
| Other backward class | 0.67* (0.48,0.93) |
| Others | 1.19* (1.04,1.37) |
| Place of residence | |
| Rural | Ref. |
| Urban | 1.06* (1.01,1.19) |
| State | |
| Himachal Pradesh | Ref. |
| Punjab | 0.83 (0.65,1.04) |
| West Bengal | 1.44*(1.18,1.76) |
| Orissa | 0.86 (0.69,1.06) |
| Maharashtra | 1.24* (1.02,1.51) |
| Kerala | 1.37* (1.12,1.68) |
| Tamil Nadu | 0.64* (0.5,0.82) |
| *p<0.05; OR: Odds Ratio; CI: Confidence Interval | |
Table 3: Logistic regression estimates for routine medical check-ups among older adults in India.
Figure 1 depicts the concentration curve for routine medical check-ups among older adults in India. If the curve is formed below the line of equality than the inequality is concentrated towards rich and vice-versa. Moreover, more the area between the line of equality and curve higher the inequality. India was having an inequality of 0.19, which depicts the pro-rich bias of health check-ups among older adults.

Figure 1: Concentration curve for routine medical check-ups among older adults in India.
Estimates from decomposition analysis for routine medical check-ups among older adults were presented in Table 4. The positive CI denotes that routine medical check-ups among older adults were concentrated in rich for that particular variable and vice-versa. Older adults aged 70 years-79 years, working older adults, and older adults who belonged to other backward classes were concentrated more among the disadvantaged population in terms of routine medical check-ups. On the other hand, years of schooling suffered from chronic diseases, household’s wealth status, and place of residence inclined to concentrate among better off. Wealth status of the household, education status, suffered from chronic diseases, and the working status of older adults were the significant contributors to the inequalities. For instance, the wealth quintile of the household was responsible for 57 percent of the socio-economic status related inequality, while older adults suffered from chronic diseases explained 18.9 percent of the socio-economic status related inequality. Education and working status of older adults made a substantial contribution to the inequalities in routine medical check-ups, and explained 16.9 percent, and 4.2 percent of the total inequality, respectively.
| Variables | Coefficients | Elasticity | Concentration index | Absolute contribution | % contribution | Total % contribution |
|---|---|---|---|---|---|---|
| Age (years) | ||||||
| 60-69 | -0.3 | |||||
| 70-79 | 0.13* | 0.005 | -0.014 | 0 | -0.2 | |
| 80+ | -0.12 | -0.002 | 0.018 | 0 | -0.1 | |
| Gender | ||||||
| Men | -0.7 | |||||
| Women | 0.06 | 0.009 | -0.033 | -0.001 | -0.7 | |
| Educational status | ||||||
| No education | 16.9 | |||||
| Below 5 years | 0.27* | 0.008 | 0.002 | 0 | 0.1 | |
| 6 to 10 years | 0.31* | 0.012 | 0.26 | 0.012 | 7.6 | |
| 11+ years | 0.7* | 0.006 | 0.613 | 0.015 | 9.2 | |
| Marital status | ||||||
| Not in union | -0.3 | |||||
| Currently in union | -0.02 | -0.003 | 0.04 | -0.001 | -0.3 | |
| Living arrangement | ||||||
| Alone | -3.9 | |||||
| With spouse | -0.09 | 0.002 | -0.197 | -0.001 | -0.8 | |
| With children | -0.17 | -0.012 | 0.089 | -0.004 | -2.6 | |
| Others | -0.29* | -0.002 | 0.092 | -0.001 | -0.5 | |
| Economic independence | ||||||
| Independent | 0.3 | |||||
| Pension | 0.08 | 0.002 | 0.066 | 0 | 0.2 | |
| Dependent | -0.01 | -0.001 | -0.009 | 0 | 0.1 | |
| Working status | ||||||
| No | 4.2 | |||||
| Yes | -0.33* | -0.011 | -0.174 | 0.008 | 4.8 | |
| Retired | 0.02 | -0.001 | 0.518 | -0.001 | -0.6 | |
| Chronic disease | ||||||
| No | 18.9 | |||||
| yes | 2.04* | 0.153 | 0.051 | 0.031 | 18.9 | |
| Wealth quintile | ||||||
| Poorest | 57.3 | |||||
| Poorer | 0.16 | 0.002 | -0.338 | -0.003 | -2 | |
| Middle | 0.39* | 0.01 | 0.138 | 0.005 | 3.2 | |
| Richer | 0.52* | 0.014 | 0.522 | 0.028 | 17.4 | |
| Richest | 0.79* | 0.021 | 0.76 | 0.063 | 38.6 | |
| Religion | ||||||
| Hindu | 1.5 | |||||
| Muslim | 0.34* | 0.005 | 0.146 | 0.003 | 1.6 | |
| Sikh | 0.09 | 0.003 | 0.311 | 0.003 | 2 | |
| Others | -0.34* | -0.003 | 0.296 | -0.003 | -2 | |
| Caste | ||||||
| Scheduled caste | -0.7 | |||||
| Scheduled tribe | 0.07 | -0.003 | -0.444 | 0.006 | 3.4 | |
| Other backward class | -0.4* | 0 | -0.029 | 0 | 0 | |
| Others | 0.18* | -0.008 | 0.219 | -0.007 | -4.2 | |
| Place of residence | ||||||
| Rural | 0.4 | |||||
| Urban | 0.06* | 0.001 | 0.247 | 0.001 | 0.4 | |
| State | ||||||
| Himachal Pradesh | 6.4 | |||||
| Punjab | -0.19 | -0.005 | 0.331 | -0.006 | -3.8 | |
| West Bengal | 0.36* | 0.008 | -0.163 | -0.005 | -3.3 | |
| Orissa | -0.16 | 0 | -0.368 | 0 | 0 | |
| Maharashtra | 0.22* | 0.006 | -0.125 | -0.003 | -1.8 | |
| Kerala | 0.32* | 0.014 | 0.349 | 0.02 | 12.1 | |
| Tamil Nadu | -0.45* | -0.006 | -0.222 | 0.005 | 3.3 | |
| Calculated CI | 0.163 | 100 | ||||
| Actual CI | 0.181 | |||||
| Residual | 0.018 | |||||
Table 4: Estimates from decomposition analysis for routine medical check-ups among older adults in India.
Regular medical examination is a well-accepted form of preventive medicine. Routine medical check-up preferably involves a thorough history, physical examination, and screening of asymptomatic individuals by physicians on a timely basis. A routine medical check-up is reckoned as an effective illness and promoting health and eliminating morbidity and mortality. This study is therefore intended to examine routine medical check-ups by older adults in India and its associated factors. This study also examined observed socio-economic inequality in the prevalence of routine check-up by older adults. This study adds relevant information to the missing literature as previously very limited studies have directly examined the prevalence and factors associated with regular medical check-ups among older adults. Previously, studies have examined health-seeking behavior among older adults in combination with various ageing-related diseases. We were able to find a few studies examining medical check-ups among people in other countries, not specifically older adults and routine medical check-ups; however, we were unable to find any study in Indian context examining the prevalence and factors associated with routine medical check-up among older adults in India.
The result found that only around one-fourth (23.1%) of the older adults were regularly going for a routine check-up, which further varied by various socio-economic characteristics of the older adults. A study examining ethical differences in participation in medical check-ups among the elderly found a higher prevalence of routine medical check-up among Malay (59.68%), Chinese (60.85%), and Indian population (68.07%), respectively. Abuduxike, et al., in their study, noticed that half of the participants (51.7%) in Northern Cyprus visited the health center for a routine medical check; however, these participants were previously associated with some medical conditions. Routine medical check-up varied by various background characteristics; highly educated older adults, richest older adults, and urban older adults were more likely to opt for a routine medical check-up than their counterparts. Furthermore, older adults with some chronic diseases were more likely to opt for a routine medical check-up than their counterparts.
Results from cross-tabulation noticed that a higher prevalence of women older adults were seeking routine medical check-ups than men older adults; however, this finding could not be statistically approved as the results from logistic regression could not find a significant relationship. Previously, various studies have noted that men tend to have lower levels of health-seeking than women, based on routinely collected primary care consultation data, and observed that the consultation rate was much lower among men than in women. Women live longer than men, and as a result, they may have a higher number of visits to medical personnel for a routine check-up as compared to men. However, few studies found that men older adults were more likely to seek health-care than women older adults.
Education status is one of the important factors affecting routine medical check-ups among older adults. This study noticed that frequency of routine medical check-ups is higher among older adults with higher education. Previous studies have confirmed the positive association between education and routine medical check-up among older adults. Education enhances knowledge about the importance of routine health check-ups, which further brings a positive change in attitude and practice of routine medical check-ups among older adults. Results profoundly concluded that older adults with chronic diseases were around 7.7 times more likely to opt for a routine medical check-up than their counterparts. The hospitalization rate is higher for chronic diseases as these can be deadly diseases, and hence people with chronic diseases are more likely to opt for a routine medical check-up.
Richest older adults were better at routine medical check-ups than poorest older adults. It is no paradox and can be attributed to the fact that richest older adults had enough money to invest in routine medical check-ups, while poorest older adults may not have enough money to go for a routine medical check-up. Richpoor inequalities in health-care are widely documented across various settings, and researchers unanimously agreed that poor people tend to have low preventive care or routine medical check-up than richer people. Few researchers believe that poorer people tend to consume more health-care as they are sicker than richer people; however, richer people tend to have a more routine check-up as they have enough money to invest in preventive care. The results from the decomposition analysis also found that wealth contributed to more than half of the observed socio-economic inequality in routine medical checkups among older adults in India. Educational status of the older adults, chronic diseases among older adults, and wealth quintile of the households defined nearly 92 percent of the observed socio-economic inequality in routine health check-ups among older adults in India. It means that education and wealth are the two important factors along with chronic disease among older adults that define socio-economic inequality in routine health check-ups. The rural-urban differentials in routine medical check-up are visible in this study. The routine medical check-up was higher among older adults in urban areas. People in rural areas may have less routine medical check-up due to various reasons accounting from the unavailability of doctors to low income among people in rural households. Furthermore, older adults in rural areas may have poor health literacy, which can further impact their routine medical check-up.
This study has some potential limitations. One of the predictor variables, namely chronic disease, was self-reported. However, it can be assumed that the self-reporting of chronic disease may not have much effect on the overall structure of the study. Furthermore, the cross-sectional nature of data limits our understanding of the causal relationship. Despite these limitations, this study provides first-hand information on routine medical check-ups among older adults in India.
For a long time now, people have been visiting health facilities only when they fall ill. However, with recent escalation in focus on health care practices, people have started to give routine medical check-ups a thought. People are now pre-emptively striving for better medical services to live a disease-free life. In this context, this study examined the prevalence and factors associated with routine medical check-ups among older adults in India. This study noticed a low prevalence of routine medical check-ups among older adults in India. From a policy perspective, at first, there is a need to spread awareness about the usefulness of routine medical check-ups. Further, this study reflects the association between education and routine medical check-up, and therefore there is a need to promote literacy at the grass-root level; also, it is recommended to promote health literacy among the older adults. A low level of medical check-up among older adults in rural areas could be reduced by offering free health check-ups regularly. Furthermore, the care of the elderly needs to be prioritized while policy formulation.
This research did not receive any specific grant from funding agencies in the public, commercial, or not-for-profit sectors.
The authors state that there is no conflict of interest.
Details of the data are provided in the methodology section.
Not applicable.
Ethical approval for the data has been obtained from the ethics committee in the university of Southampton. Informed written consent was obtained from each participant, who were ensured that data would remain confidential and used for research purposes only. All methods were carried out in accordance with relevant guidelines and regulations.
Not applicable.
Not applicable.
Conceptualization: SS and PK; Data curation: PK; Methodology: PK; Software; PK and SS; Validation: SS, SC, RP, PK, SSG and DWB; Formal analysis: PK.; Investigation: SS; Data curation, PK.; Writing original draft preparation: SC, RP, and SSG; Writing Review and Editing: PK, SC, RP, and SSG; Visualization: DWB; Supervision: DWB.
[Google Scholar] [PubMed]
[Crossref] [Google Scholar] [PubMed]
[Crossref] [Google Scholar] [PubMed]
[Crossref] [Google Scholar] [PubMed]
[Crossref] [Google Scholar] [PubMed]
[Crossref] [Google Scholar] [PubMed]
[Crossref] [Google Scholar] [PubMed]
[Crossref] [Google Scholar] [PubMed]
[Crossref] [Google Scholar] [PubMed]
Citation: Srivastava S, Chauhan S, Patel R, Kumar P, Gupte SS, Bansod DW (2023) Decomposing Socio-Economic Inequality for Routine Medical Check-ups among Older Adults: An Evidence from Cross-Sectional Survey in India. Healthy Aging Res. 12:167.
Received: 22-Dec-2022, Manuscript No. HAR-22-21126; Editor assigned: 26-Dec-2022, Pre QC No. HAR-22-21126 (PQ); Reviewed: 09-Jan-2023, QC No. HAR-22-21126; Revised: 20-Mar-2023, Manuscript No. HAR-22-21126 (R); Published: 27-Mar-2023 , DOI: 10.35248/2261-7434.23.12.167
Copyright: © 2023 Srivastava S, et al. This is an open-access article distributed under the terms of the Creative Commons Attribution License, which permits unrestricted use, distribution, and reproduction in any medium, provided the original author and source are credited.