Journal of Geology & Geophysics
Open Access
ISSN: 2381-8719
ISSN: 2381-8719
Research Article - (2017) Volume 6, Issue 1
Precision mining and optimization of ore mining practise are gaining more importance as the global demand and competition for exploring the raw mineral material has grown manifold with increased industrialization world-wide. The overall process of mining activity involves ore identification, estimation, planning, excavation, transportation etc. The activity requires accurate mapping, monitoring and proper management of information pertaining to ore stockpile, mining pits and infrastructure of the areas on a regular basis. Of late, advancements in remote sensing techniques have paved a way for digital management of the mining activity. Especially, use of photogrammetric techniques for open pit mining are found to be highly accurate and effective in capturing, monitoring, mapping, managing the information pertaining to mining in a three dimensional (3D) space. Capturing of information pertaining to mines in 3-D perspective with respect to a specific location on the terrain is highly effective in accurate estimation of ore reserves, exploration and reclamation planning, ore continuity mapping and decision making. However, precision mining requires the use of large scale photogrammetric techniques with high resolution imagery of gigabytes size at mapping scales range from 1: 1000 to 1: 5000. In addition to that, the entire procedure involves the use of state-of-theart software and hardware for fast processing of data and subsequent digital output generation. Above all, involvement of skilled photogrammetric experts with specialised knowledge on open pit mining is very much essential for accurate interpretation and delineation of the resources. A project was carried out for the 3D mapping of iron ore stockpiles, pits and infrastructure areas at various sites. The stockpile and pit mapping is used for very precise volume measurements and the infrastructure mapping is used for general mine planning activities. High accuracy is critical, as the data and volume reports are used to calculate the value of the ore being extracted, and any errors in the mapping data can result in incorrect payments of large amounts of money. Since, the timeline specified to complete the task is very short, it is crucial that the staff doing the final volume computations and downstream processing should receive the accurate data, correctly coded and mapped according to the standards outlined. The study has demonstrated a typical workflow for the effective use of close range photogrammetric techniques for 3D mapping and iron ore mining in open pit areas. The study also sees a brighter outlook and challenges of upcoming aerial and terrestrial photogrammetric technology for precision mining.
Keywords: Large scale photogrammetry; 3D mapping; Precision iron ore mining
During the last decade, the photogrammetry and mapping industry has seen tremendous impetus in the implementation of innovative methods for accurate planning, 3D mapping and computation of mining ore and resources volumes. Notable studies by different authors particularly [1-3] have demonstrated the significance of accurate 3D shape reconstruction and volume estimation in many applications, for example, erosion studies, estimation of ore removed from a mine face and terrain assessment for construction etc. Particularly, digital photogrammetry has gained tremendous popularity due to the technology advancements in collecting detailed spatial information pertaining to the extent of mineral resource using high-resolution cameras or laser scanners and producing and rendering the digital 3D surface models [4-7]. Digital terrain models (DTMs) coupled with ancillary information, such as, dip direction and dip measurements, joint spacing etc., help in the assessment and characterization of mineral volumes [8,9]. Most importantly, digital photogrammetry is proven to be more reliable and cost effective when it is required to update the mapping of ore stockpiles, pits and infrastructure areas on a regular basis, generally at quarterly intervals for various sites, simultaneously [10]. On the other hand, it is also important to consider the geomorphic configuration and characteristics of the associated features as they may have certain degree of influence on open-pit mining [11,12]. A study has been undertaken to map and estimate the mineral ore stockpiles. In some cases material may have been moved around on top of the stockpile itself which would also require re-mapping [13]. The stockpile and pit mapping is used for very precise volume measurements and the infrastructure mapping is used for general mine planning activities [14-16]. Data accuracy is very critical as it is used to asses stockpile information and for the generation of volume reports which will be used as the basis for calculating the payments to subcontractors [17]. Any errors in the mapping data can result in incorrect payments of large amounts of money. In majority of the cases, the projects need to be completed within the given timelines and it is very important that the work is done in accordance with the schedules defined by the concerned Project Manager. In general practice, unless and otherwise notified the workflow will always be the mapping and volumetric computations of stockpiles first, then pits and finally infrastructure areas. As the timelines to complete the data updating task are very short, it is critical that the staff engaged in the computations of final ore volumes and downstream processing receive the data which is highly accurate, correctly coded and mapped according to the standards. One of the innovative techniques introduced in the study was to use only the alternate frames of the aerial photography received for mapping as the forward overlap was found to be 80% since use of such excessive overlap results in lower accuracy of DTM.
Stockpile mapping requires the delivery of map data with high quality and information pertaining to ore volumes on time. There is a multitude of objectives to be met for each quarterly survey, but the primary goal is to provide the customer with an accurate measure of their production for the last three months, most specifically,
The amount of ore and product that is stockpiled; and
The amount of bulk earth excavated from the mine pits.
The secondary objectives are
To compare the current size of waste or overburden dumps to final design surface;
Measure the “in pit” dumping of waste or backfill; and
Provide updated site maps to be used for a variety of purposes.
Another important objective of the project is to reduce the density of data captured in certain areas of the mine, particularly within waste dumps and spoil. It is important that the data density in waste and spoil is kept to an absolute minimum so that the data loads quickly and efficiently into the database.
High resolution aerial photographs of 7 cm to 10 cm GSD are used for the stockpile mapping study. Ground truth information collected by the supervisors is also used as the ancillary data to update the stockpiles. Feature symbology as specified by the client has been adopted for the mapping of stockpile, pits and infrastructure data. Similarly, Quality Assurance and Quality Control (QA/QC) plan is designed according to the recommendations of the client.
The overall methodology involves a typical photogrammetry project workflow starting from aerial photo acquisition, data inventory, groundtruth verification in the mine area followed by Aerial Triangulation (AT). 3D Mapping of stockpile data starts with loading and updating the stockpile map data file that has been supplied by the client. Updating task involves identification of the areas of change (i.e. areas to be updated) and plotting them with an “update mapping polygon” around such areas. Once the areas which need to be updated have been defined and demarcated, the area inside this need to be mapped with sufficient breaklines on tops and toes of stockpiles along with spot heights on a notional 20 m grid to accurately define the stockpile surface. If new stockpiles are found in the image then the respective areas have to be identified and mapped accordingly. Subsequently typical QA/QC of the data has to be performed according to the standards specified for the data capturing task.
Stockpile mapping
The purpose of stockpile mapping exercise is to identify areas where the stockpile surface has changed since last aerial survey [18]. The change may be due to material being added or removed from the stockpile surface. Accuracy is critical to the stockpile mapping data and volumes supplied as they used to work out the amount of product material and therefore the value of the material pertaining to each mining site. The objective is to map three different categories of information pertaining to stockpiles which are subject to change continuously over a period of time. The three different categories which are to be mapped are stockpiles which have been changed, new stockpiles and stockpiles which no longer exist. The procedure for correctly mapping and updating stockpiles data is as mentioned below.
The stockpile areas which have been identified as the areas of change are to be mapped as “update mapping polygon”. In case of stockpiles which are no longer existing, they have to be mapped using “update mapping polygon” around the original stockpile but no new data should be plotted. The update polygons should be placed very close to the area of change. Areas with no change can be identified easily with the presence of vegetation. However, make sure that the names of all stockpiles remain in the mapping data. Areas with minor changes, unchanged stockpile surface data and changes due to erosion processes around the stockpile toe need not be mapped. Stockpiles with very small or negligible areas which are in doubt for identification are captured as a stockpile with the addition of an explanatory note to the data. Once update areas have been defined, the areas inside these stockpiles are mapped with sufficient breaklines or tops and toes of stockpiles with necessary spot heights with a 20 m grid spacing to accurately define the stockpile surface. For the areas where there are rows of truck dumps there should be breaklines along the top and toe of each row.
This is done by properly defining and plotting the “edge of stockpile” boundary as the stockpile surface should be mapped or updated using the relevant stockpile mapping feature codes. In addition to this, a 10 m buffer of additional surface data is captured around the outside of the ‘live’ stockpile edge. This data is captured using the feature types relevant to the stockpile location within the mine site, e.g. if the stockpile is located in an area mapped with ‘Pit’ feature coding, then the 10 M buffer is captured with ‘Pit’ feature codes. This 10 M buffer of data is in the form of DTM points with spacing not greater than 5 m. This also affects the pit and infrastructure mapping process as the map data has to be voided (at 11 m from stockpile edge) to accommodate the additions in the stockpile map data.
Pit mapping phase of the project involves update mapping of the remaining mine areas at each site. Generally the pit data consist of pit areas, spoil areas and surrounding natural surface feature data. The purpose of the pit mapping is to create a digital terrain model of the pit surface which we will use to calculate the volume of material removed from the pit since the previous aerial survey. This volume is then used to work out how much money the earth moving contractor gets paid, which is a function of how much crude ore they have removed from the pit.
Spoil areas are to be captured in such a way that the spacing between the points along the line strings are much less while the DTM spot spacing is optimized as per the natural surface. A fundamental requirement is that all top and toe strings must be on the terrain surface, except where toe strings are obstructed by broken material, in which case they have to be “pushed through” on a line where they would be had the broken material not obscured it. They are critical in defining both the pit floor level and bench level. In order to map the pit faces accurately, breaklines are to be captured to define the face between the top and the toe and should be very precisely positioned on the face. Breaklines are to be plotted down the face of the pits to define the corners accurately. Closed embankment features are defined by bench tops and toes that need to be properly snapped where appropriate. The top of bank (pit wall) should be at the same reduced level as the floor of the pit behind it, any material above and just behind the top of bank edge should be outlined by a material edge code and have material breaklines defining the top.
The spacing between consecutive vertices forming the line strings should not between 3 to 15 m. Figure 1 shows an example of far too many points captured along line strings. The original points, white dots, are in places less than a metre apart and are nearly all less than 3 m from their neighbour. The green and blue dots show the correct spacing. Green on top of bank and along breakline on face is between 5 to 8 m apart. Blue dots at back along material line are about 12 m to 14 m apart. In the case of both the blue and the red dots the surface is still defined accurately but with far less data. On the other hand, the blast site surface areas have been “coarsely” defined with breaklines.
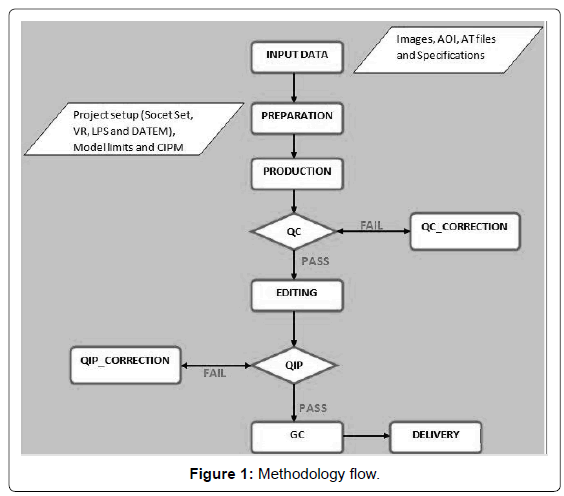
Figure 1: Methodology flow.
Material heaps and safety bunds have been outlined with an edge of material boundary and material breaklines to define the surface of the heap. They form a closed polygon except where the material boundary snaps to a top of bank in which case the top of bank code takes precedence. When identifying areas of change in waste and spoil areas it is important to ignore changes that have been caused by erosion.
Infrastructure mapping
This phase of the project involves update mapping of the infrastructure areas at each mining site. The infrastructure mapping has many different users within the client’s organisation but will mostly be used for planning purposes. The infrastructure data will usually consist of very detailed data in some areas and large areas of natural surface. It all needs to be checked, although there is not usually much change in the natural surface areas. For sites with multiple infrastructures it is important to make sure that the integration between the general infrastructure and the infrastructure to pit and stockpile area are checked and the relevant data is loaded as a reference to ensure a seamless integration. In areas where there are some preparatory earthworks or drilling programs being done there will be occasions when an existing track is “cut off” from the rest of the network of roads and tracks. These “orphan” tracks must be recoded as breakline.
Quality analysis (QA)/quality control (QC) of the data
Once the data capture phase is complete the data must be cleaned in accordance with data cleaning standards defined for the stockpile mapping project. This includes, thorough review of entire data capturing process using various cleaning tools and processes custom designed for the task. Tools like ‘review feature statistics’ was used to ensure that valid codes have been used and to make sure that there are no unexpected codes in the data, e.g., to check the inclusion of any road feature codes in the stockpile data. There are other tools like “find crossing tool” that are used to ensure the edge matching of each dataset with reference to the adjoining datasets. There will be occasions when an update polygon clips a cell for a pole, post or other feature represented by a cell. When this happens the cell will “drop” to an ellipse or line feature. Running “review feature statistics” will highlight these as incorrect feature types.
QA check for control and check points are done as part of the AT procedures at each site. It is critical that the QA checks on control meets the required accuracy standards. If this does not occur then the Project Manager should be alerted immediately. Under no circumstances, should any data capture commence until the results of the control validation report are accepted.
GIS integration
All the data layers are to be integrated in GIS environment as entire stockpiles, pit and infrastructure map data should contain GIS ready centroids and connectors wherever applicable. GIS connectors are required for all road features, creeks and drains. GIS connectors should be used to close different road types from each other. Creeks should be connected where possible to create a continuous water flow network. The same is also required for drain features. The newly captured area features must have a centroid placed inside the feature boundary. Coding of each feature class should be done according to the feature code list which contains a corresponding centroid for every area feature.
The workflow adopted for the stockpile mapping study effectively demonstrates the utility of digital photogrammetry technology for the mapping of stockpiles, pits and infrastructure areas and for the estimation of stockpile volumes with high degree of accuracy. The study also highlights the high degree of reliability of digital photogrammetry technology in cases where the ore stockpiles have to be monitored, mapped and estimated very frequently on a timely basis without any interruption to mining activity.