Journal of Geology & Geophysics
Open Access
ISSN: 2381-8719
ISSN: 2381-8719
Research Article - (2023)Volume 12, Issue 5
The process of pinpointing unconventional shale gas sweet spots demands an extensive analysis of various geological, geochemical, petrophysical, and geomechanical factors. The Amoun field, which is a vital oil and gas reserve in the northern Western Desert of Egypt's Shushan Basin, was examined in this research, specifically targeting the Upper Safa shale as a potential shale gas reservoir. The geological investigation revealed that the Middle Jurassic Upper Safa member was found at a depth range of 12,036 to 12,065 ft. The gross thickness is approximately 602-790 ft., with an average of 696 ft. The potential shale gas sweet spot of the entire Upper Safa member has a net thickness range of 132-313 ft., with an average of 222 ft. Additionally, the sweet spot intervals are characterized by average TOC values range of 1.6-3 wt.% and type III kerogen, with a little contribution to type II kerogen. The maximum Tmax values were found to range from 462 to 475°C, with average values ranging from 444.3-456°C, measured Ro% values range from 0.7 to 1.09%, with an average value of 1%, and calculated Ro values range from 1.2-1.4 % indicating that the shale already reached the stage of late maturity where it is in the peak of wet gas generation stage. Furthermore, the sweet spot intervals are characterized by excellent petrophysical properties suggesting that the Upper Safa member is conducive to shale gas production. The mineralogical composition varies considerably, with quartz content ranging from 30-63%, carbonate content ranging from 8-10%, and clay content ranging from 22-55%. NMR and Dielectric logs show favorable properties for gas production, with an average NMR porosity of 5% and permeability of 1200-1400 nD. The average water saturation values range between 51-62%, and the average hydrocarbon saturation ranges from 38-49%. The geomechanical properties of the entire Upper Safa shale indicate that the sweet spot intervals have average Brittleness Average (BA) values of 0.33-0.57. The overall findings indicate that the Upper Safa shale has significant potential as a shale gas resource, with sweet spot parameters strongly falling within the typical ranges of the top 10 global productive shale gas reservoirs, including Marcellus, Haynesville, Barnett, Fayetteville, Bossier, Eagle Ford, Muskwa, Woodford, Utica, and Montney shale reservoirs. This could make it an important addition to the global shale gas market.
Unconventional reservoir; Shale gas; Sweet spot; Geochemistry; Petrophysics; Geomechanics; TOC; Mineralogical composition; Quartz; Clay; Shale porosity; Shale permeability; Dielectric; Shale saturation; Water filled porosity; Hydrocarbon filled porosity; Brittleness; Shale gas reservoirs.
The traditional view of shale formations as either source rocks or cap rocks for hydrocarbon reservoirs led to an emphasis on geochemical analysis for many years. However, to identify the sweet spot of shale gas reservoirs, it is now recognized as crucial to evaluate petrophysical and geomechanical properties in addition to geochemical properties [1]. This integrated approach to assessing unconventional reservoirs was highlighted by Javie [2], who emphasized the increasing importance of such an approach. The producible natural gas shale resources in the United States make energy independence in natural gas a possibility for the foreseeable future. Javie compiled average geological, geochemical, petrophysical, and geomechanical parameters for the most productive shale gas reservoirs worldwide, serving as benchmarks for evaluating unconventional reservoirs.
The main objective of this study is to conduct a thorough evaluation of the potential of shale gas reservoirs in the Middle Jurassic sediments, focusing specifically on the Upper Safa member in the Shushan basin, through a detailed analysis of the Amoun field. The Upper Safa member is considered a highly attractive prospect for shale gas exploration due to its substantial thickness and abundance of organic-rich shales. To achieve this objective, the study employed comprehensive geological, geochemical, petrophysical, and geomechanical assessments. Additionally, the study aims to compare the results of these evaluations with the parameters of the top 10 productive shale gas reservoirs worldwide, which will aid in assessing the quality of our target shale.
The geological parameters include age, depth, gross thickness, and net sweet spot thickness. Additionally, the geochemical parameters include TOC content, maturity, vitrinite reflectance Ro%, and hydrocarbon index HI. Furthermore, the petrophysical parameters include the mineralogical composition of the shale, porosity, permeability, and hydrocarbon saturation. Lastly, the geomechanical evaluation includes the calculation of the brittleness average of the shale intervals. By integrating these findings, we can identify the sweet spot intervals within the shale.
The parameters listed are particularly relevant in assessing the Middle Jurassic Upper Safa shale in the Amoun field, Shushan Basin, northern Western Desert, Egypt. Amoun field is one of the most important gas and oil fields of the Shushan Basin which has numerous oil and gas potentialities and may jump soon as a great petroleum province. The Western Desert still has a significant hydrocarbon potential as recent oil and gas discoveries have suggested [3]. Perhaps 90% of oil reserves and 80% of gas reserves in Egypt are located in the Western Desert [4]. The area of study deals with this basin and lies between latitudes 30° 49’ 52”-30° 51’ 00” N and longitudes 26° 58’ 12”-27° 00’ 00” E (Figure 1).
The study extensively utilized a wide range of materials and methodologies to thoroughly investigate the shale gas potential of the Middle Jurassic Upper Safa shale in the Shushan basin, with a specific focus on the Amoun field. To gather pertinent information, the study incorporated diverse sources, including published geological literature, as well as a recent and comprehensive geochemical study conducted by Elsaqqa, et al. [5], titled "Shale Gas Geochemistry of the Middle Jurassic Upper Safa Member, Amoun Field, Shushan Basin, Western Desert, Egypt."
To evaluate the properties of the targeted shales, multiple datasets, and analyses were employed. The petrophysical evaluation encompassed an analysis of Elemental Spectroscopy logs from three wells (Amoun NE-1X, Amoun NE-2, and Amoun NE-3) to determine the mineralogical composition of the shales. Additionally, Nuclear Magnetic Resonance (NMR) and High- Frequency Dielectric (HFDT) logs from one well (Amoun NE- 3) were examined to quantify key characteristics such as shale porosity, permeability, and hydrocarbon saturation. Moreover, the geomechanical evaluation involved the calculation of the Brittleness Average (BA) using density and dipole sonic logs from four wells (Amoun NE-1X, Amoun NE-2, Amoun NE-3, and Amoun-2X) to identify zones exhibiting high brittleness. By integrating these results, potential locations with favorable conditions for shale gas were identified, employing appropriate cutoff values.
Considering that the Upper Safa member comprises both conventional Upper Safa sandstone reservoirs and the targeted shale interval, it was delineated into two distinct zones known as Upper Safa Top and Upper Safa Bottom. Furthermore, the analysis, interpretation, and mapping of the collected data were facilitated through the utilization of personal computers and various software packages, each tailored to meet the specific requirements of the respective analyses.
Previous studies
Geological investigation: Since 1961, several studies have investigated the structural and stratigraphic features of the Egyptian Western Desert, including works by Amin [6], Said [7,8], Norton [9], Parker [10], Meshref [11], Zein El-Din, et al. [4,12], and Abd El-Gawad, et al. [13].
The study area is characterized by a three-way dip-closure that has been influenced by a major fault, significantly impacting the disposition of the stratigraphic formations in the region (Figure 1). This fault likely formed during the Early Tertiary Age due to the rifting process that occurred in the northern Western Desert, specifically the Red Sea system, and trends in a North West-South East direction [14]. The northern Western Desert's generalized stratigraphic column comprises most of the sedimentary succession from the Pre-Cambrian basement complex to recent times and thickens progressively towards the north and northeast directions, ranging from about 6000 ft. in the south to about 25,000 ft. in the coastal area (Figure 2) [15]. The Upper Safa member (Middle Bathonian) which is the most important gas, condensate, and oil productive zone in the Shushan basin, is situated at a depth range of approximately 12036-12065 ft. and has an average total thickness range of approximately 602-790 ft. The Upper Safa's age is similar to that of the Haynesville and Bossier shale reservoirs, as all of them are of Jurassic age. The depth of the Upper Safa when compared to the most productive shale gas reservoirs worldwide found that it is closely matched that of the Haynesville and Woodford shale reservoirs, which have depths up to 13,500 ft. Additionally, the gross thickness of the Upper Safa matched the thickest ones of the global most productive shale gas rgeography-geophysics-Location-12-4-1103-g001eservoirs, particularly Barnett (200-1000 ft.), and Woodford (100-900 ft.).
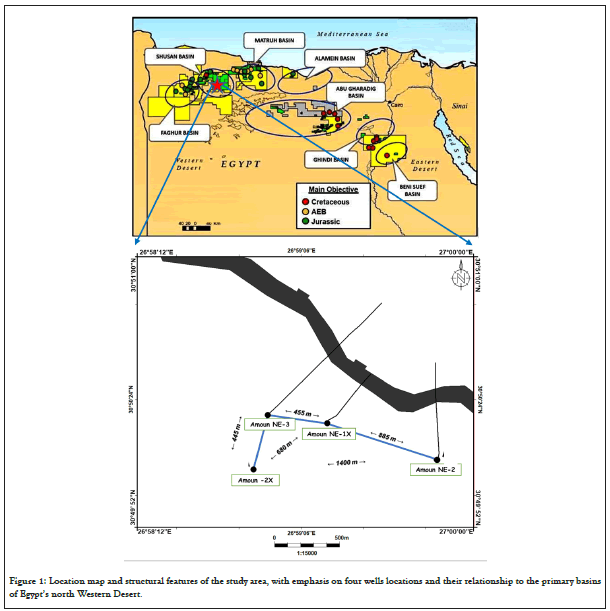
Figure 1: Location map and structural features of the study area, with emphasis on four wells locations and their relationship to the primary basins of Egypt’s north Western Desert.
Figure 2: Generalized stratigraphic column of the northern Western Desert, Egypt. [15].
Geochemical assessment
Shale gas resource systems are typically characterized by organicrich, and sufficient maturity to generate gas. The productive potential of shale gas and oil reservoirs is significantly influenced by the concentration of organic carbon, the type of organic matter present in shales, and the level of shale maturation. These factors play a crucial role in the successful exploitation of these resources [1].
The geochemical characteristics of the Middle Jurassic Upper Safa shale in the Shushan Basin, Western Desert, Egypt, were extensively examined by Elsaqqa, et al. [5], to evaluate its suitability as an unconventional shale gas reservoir. The study encompassed the assessment of various parameters including the evaluation of the measured Total Organic Carbon (TOC) content, as well as the calculation and calibration of TOC for all drilled wells in the study area. The study also assessed the kerogen type, maturity, and hydrocarbon generation. Furthermore, several 1D basin models were constructed to calculate and model the Vitrinite reflectance (Ro%), burial history, and hydrocarbon zones for all drilled wells in the study area.
The findings of Elsaqqa, et al. [5], demonstrated that the TOC values in the analyzed shale ranged from 1.31 to 80.4 wt.%, indicating a spectrum from poor to very good source rock quality, as per the classification by Peters [16]. The predominant kerogen type observed in the shale was type III, with a little contribution to type II kerogen. The shale exhibited late-stage maturity, as indicated by maximum Tmax values ranging from 462 to 475 degrees Celsius, measured %Ro values ranging from 0.7 to 1.09%, and calculated values of 1.2 to 1.4%. These results suggest that the shale is presently in the peak stage of wet gas generation. Furthermore, the 1D burial history and hydrocarbon zone models constructed in the study indicated that oil generation in the Upper Safa shales of the study area commenced during the Early Cretaceous period. Gas generation, on the other hand, began during the Middle Paleogene to the Neogene era and is ongoing up to the present time.
Lastly, the comprehensive geochemical analyses of the Middle Jurassic Upper Safa shale in the study area were compared to the top ten productive shale gas reservoirs worldwide. This comparison revealed that the shale in question falls within the typical range observed in these high-performing shale gas reservoirs. This signifies the significant potential for the exploration and development of unconventional shale gas reservoirs within the Shushan Basin in Egypt's Western Desert.
Petrophysical assessment
Due to the variable mineral composition, the petrophysical evaluation of shale gas reservoirs is complex and challenging. Mineralogy plays a significant role in controlling shale properties. The non-clay minerals especially quartz content are very important for estimating the brittleness of the rock. There is a relationship between mineralogical content and the brittleness of the shale layers [17]. Additionally, shale gas reservoirs worldwide are typically characterized by extremely low porosities and permeabilities, ranging from 1 to 14% and from 0 to 5000 nano- Darcy. Furthermore, the most productive shale gas reservoirs globally have high water saturation levels ranging from 85 to ≥ 99%, while hydrocarbon saturation is typically low, ranging from ≤1 to 15% [2].
Mineralogical composition
The interpretation of the elemental spectroscopy logs showed that the amounts of clay, quartz, and carbonate in the study shale are highly variable, which could be resulting in variable degrees of brittleness in different intervals.
For the Upper Safa Top, the Amoun NE-1X well exhibits quartz content ranges up to 84%, with an average of 35%. The Amoun NE-2 well displays quartz content ranging up to 91.5%, with an average of 55%, while the Amoun NE-3 well shows quartz content ranging up to 82%, with an average of 33%. The average carbonate content in the Amoun NE-1X, Amoun NE-2, and Amoun NE-3 wells is 8%, 10%, and 9%, respectively. The clay content also varies. The average clay content is 55 %, 35 %, and 43 % for the Amoun NE-1X, Amoun NE-2, and Amoun NE-3 wells respectively (Table 1 and Figures 3-5).
| Zone | Well name | Mineralogical content (%) | |||
|---|---|---|---|---|---|
| Quartz | Carbonate | Clay | |||
| Up to | Avg. | Avg. | Avg. | ||
| Upper Safa Top | Amoun NE-1X | 84 | 35 | 8 | 55 |
| Amoun NE-2 | 91.5 | 55 | 10 | 35 | |
| Amoun NE-3 | 82 | 33 | 9 | 43 | |
Table 1: Mineralogical content (%) of the Upper Safa Top zone in the wells of study.
Figure 3: Elemental spectroscopy log presenting the mineralogical composition of the Upper Safa Top, Amoun NE-1X well.
Figure 4: Elemental spectroscopy log presenting the mineralogical composition of the Upper Safa Top, Amoun NE-2 well.
Figure 5: Elemental spectroscopy log presenting the mineralogical composition of the Upper Safa Top, Amoun NE-3 well.
Similarly, for the Upper Safa Bottom, the quartz content in the Amoun NE-1X well shows levels up to 68% and an average of 27%, the Amoun NE-2 well displays levels up to 90% and an average of 30%, and the Amoun NE-3 well-exhibiting levels up to 77.5% and an average of 28%. The average carbonate content in the Amoun NE-1X, Amoun NE-2, and Amoun NE-3 wells is 8%, 8%, and 10%, respectively. The clay content also varies. The average clay content is 62%, 60%, and 47% for the Amoun NE- 1X, Amoun NE-2, and Amoun NE-3 wells respectively (Table 2 and Figures 6-8). Overall, the Upper Safa Top and Upper Safa Bottom zones in the study wells exhibit that the average quartz content ranges from 33% to 55% and 27% to 30%, respectively, while the carbonate content averages between 8%-10% in both zones. The clay content averages between 35% to 55% and 47% to 62% in the Upper Safa Top and Bottom zones, respectively.
| Zone | Well name | Mineralogical content (%) | |||
|---|---|---|---|---|---|
| Quartz | Carbonate | Clay | |||
| Up to | Avg. | Avg. | Avg. | ||
| Upper Safa Bottom | Amoun NE-1X | 68 | 27 | 8 | 62 |
| Amoun NE-2 | 90 | 30 | 8 | 60 | |
| Amoun NE-3 | 77.5 | 28 | 10 | 47 | |
Table 2: Mineralogical content (%) of the Upper Safa Bottom zone in the wells of study.
Figure 6: Elemental spectroscopy log presenting the mineralogical composition of the Upper Safa Bottom, Amoun NE-1X well.
Figure 7: Elemental Spectroscopy log presenting the mineralogical composition of the Upper Safa Bottom, Amoun NE-2 well.
Figure 8: Elemental spectroscopy log presenting the mineralogical composition of the Upper Safa Bottom, Amoun NE-3 well.
The Upper Safa member exhibits a mineralogical composition that bears striking resemblance to highly productive shale formations worldwide, as evidenced by studies conducted by Javie [2], on formations such as Marcellus, Haynesville, Bossier, and Barnett. For instance, Marcellus shale demonstrates an average quartz content of 37%, accompanied by clay content ranging from 20% to 60%. Similarly, Haynesville shale exhibits an average quartz content of 30%, along with clay content ranging from 40% to 70%. Bossier shale, on the other hand, features quartz content averaging between 25% and 30%, along with higher clay content compared to Haynesville. Barnett shale showcases an average quartz content of 45% and an average clay content of 25%.
Considering these comparisons, it becomes evident that the shale under study holds significant promise as a hydrocarbon reservoir. It shares notable similarities with these highly productive shale formations worldwide, including favorable brittleness properties for artificial hydraulic fracturing and the potential suitability of its porosity system for fluid mobility. These characteristics further highlight the shale's potential as a viable target for exploration and development activities.
Porosity and permeability
The NMR analysis conducted on the Upper Safa member in the Amoun NE-3 well indicates variations in both porosity and permeability. The analysis shows that the average NMR porosity and permeability values for the entire Upper Safa Top are 5.1% and 1400 nD, respectively, while the average NMR porosity and permeability values for the entire Upper Safa Bottom zone are 4.73% and 1200 nD, respectively, as depicted in Table 3 and Figures 9 and 10. To assess the significance of these values, a comparison was made between the porosity and permeability values of the entire Upper Safa member and those of the most productive shale gas reservoirs worldwide, as examined by Javie [2]. The porosity values of the entire Upper Safa member fall within the typical range observed in the top 10 productive shale gas reservoirs worldwide, which typically range from 1% to 14%. Likewise, the permeability values of the Upper Safa member exhibit a comparable range to the highest values observed in global shale gas reservoirs, such as Haynesville (ranging from 0 to 5000 nD) and Eagle Ford (ranging from 700 to 3000 nD). These findings strongly suggest that the Upper Safa shale holds significant potential as a promising shale gas play. Its porosity and permeability values align with those of highly productive shale gas reservoirs worldwide, indicating its favorable characteristics for shale gas exploration and development.
| Zone | Average NMR porosity (%) | Average NMR permeability (mD) | Average NMR permeability (nD) |
|---|---|---|---|
| Upper Safa Top | 5.1 | 0.0014 | 1400 |
| Upper Safa Bottom | 4.73 | 0.0012 | 1200 |
Table 3: NMR results, Upper Safa Top and Bottom zones, Amoun NE-3 well.
Figure 9: NMR log presenting the porosity and permeability of the Upper Safa Top, Amoun NE-3 well.
Figure 10: NMR log presenting the porosity and permeability of the Upper Safa Bottom, Amoun NE-3 well.
Fluid saturation
The interpretation of High-Frequency Dielectric (HFDT) log data conducted on the shale intervals in the Amoun NE-3 well provides valuable insights. The analysis reveals that the Upper Safa Top zone exhibits an average effective water saturation of 51% and a hydrocarbon saturation of 49%. Additionally, the water-filled porosity is estimated to be 4.2%, while the hydrocarbon-filled porosity is approximately 3%. On the other hand, the Upper Safa Bottom zone demonstrates an average effective water saturation of 62% and a hydrocarbon saturation of 38%. The water-filled porosity in this zone is estimated to be 3.7%, while the hydrocarbon-filled porosity is around 3%. These findings are presented in Table 4 and Figures 11 and 12.
| Zone | Average Dielectric Water Saturation (SWE %) | Average Water Filled Porosity (PhiW %) |
Average Calculated Hydrocarbon Filled Porosity (PhiHC %) |
|---|---|---|---|
| Upper Safa Top | 51 | 4.2 | 3 |
| Upper Safa Bottom | 62 | 3.7 | 3 |
Table 4: Dielectric results of the Upper Safa Top and Bottom zones, Amoun NE-3 well.
Figure 11: Dielectric log presenting the fluid saturation, water-filled porosity, and hydrocarbon-filled porosity for the Upper Safa Top, Amoun NE-3 well.
Figure 12: Dielectric log presenting the fluid saturation, water-filled porosity, and hydrocarbon-filled porosity for the Upper Safa Bottom, Amoun NE-3 well.
A comparison with the top 10 productive shale gas reservoirs worldwide, as studied by Javie [2], reveals that the Upper Safa shale reservoir in our study exhibits distinct characteristics. It showcases a lower amount of water saturation and higher amount of hydrocarbon saturation compared to most of the examined reservoirs. For instance, the Barnett shale demonstrates a water saturation of 90% and a hydrocarbon saturation of 10%, while the Eagle Ford shale exhibits a water saturation of 85% and a hydrocarbon saturation of 15%. In contrast, the majority of globally productive shale gas reservoirs have water saturation values of 95% or higher and hydrocarbon saturation values of 5% or lower. These comparisons highlight the favorable characteristics of the Upper Safa shale reservoir in our study, with lower amount of water saturation and higher amount of hydrocarbon saturation. Such conditions indicate the potential for enhanced gas production and suggest a promising outlook for the development of the Upper Safa shale as a productive shale gas reservoir.
Geomechanical assessment
The geomechanical analysis conducted on the shale reservoir has yielded valuable insights into its dynamic elastic properties and brittleness characteristics. This comprehensive analysis involved the calculation of key geomechanical parameters, such as Young's modulus, Poisson's ratio, Young's brittleness, Poisson's brittleness, and the Brittleness Average (BA), for all wells included in the study. These properties play a vital role in assessing and determining the production potential of shale gas wells. Notably, the analysis revealed a strong correlation between these geomechanical properties and the mineralogical composition derived from the interpretation of elemental spectroscopy data, enhancing our understanding of the shale reservoir's mechanical behavior and its implications for hydrocarbon production.
In both the Upper Safa Top and Upper Safa Bottom zones, a comprehensive analysis of the wells demonstrated a wide range of average Brittleness Average (BA) values. The values for the Upper Safa Top zone ranged from 0.24 to 0.42, while the values for the Upper Safa Bottom zone ranged from 0.25 to 0.36. These findings are summarized in Table 5 and illustrated in Figures 13-20.
| Zone | Well | Avg. BA | Zone | Avg. BA |
|---|---|---|---|---|
| Upper Safa Top | Amoun NE-1X | 0.42 | Upper Safa Bottom | 0.34 |
| Amoun NE-2 | 0.28 | 0.27 | ||
| Amoun NE-3 | 0.24 | 0.25 | ||
| Amoun -2X | 0.29 | 0.36 |
Table 5: Brittleness Average (BA) values for the Upper Safa Top and Bottom zones in the wells of study.
Figure 13: Vertical distribution log presenting the geomechanical dynamic elastic properties for the Upper Safa Top zone, Amoun NE-1X well.
Figure 14: Vertical distribution log presenting the geomechanical dynamic elastic properties for the Upper Safa Top zone, Amoun NE-2 well.
Figure 15: Vertical distribution log presenting the geomechanical dynamic elastic properties for the Upper Safa Top zone, Amoun NE-3 well.
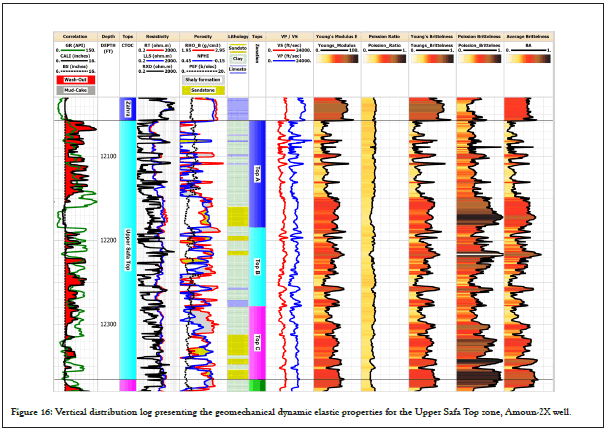
Figure 16: Vertical distribution log presenting the geomechanical dynamic elastic properties for the Upper Safa Top zone, Amoun-2X well.
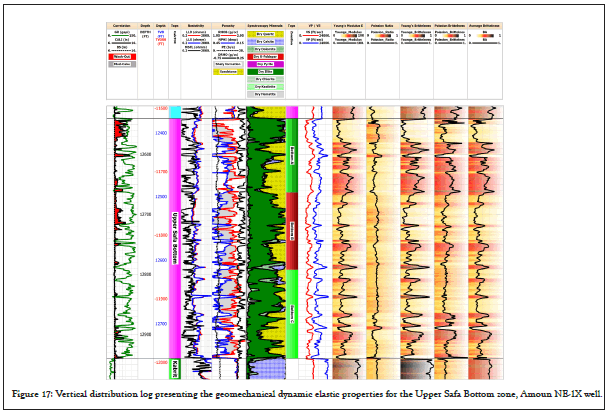
Figure 17: Vertical distribution log presenting the geomechanical dynamic elastic properties for the Upper Safa Bottom zone, Amoun NE-1X well.
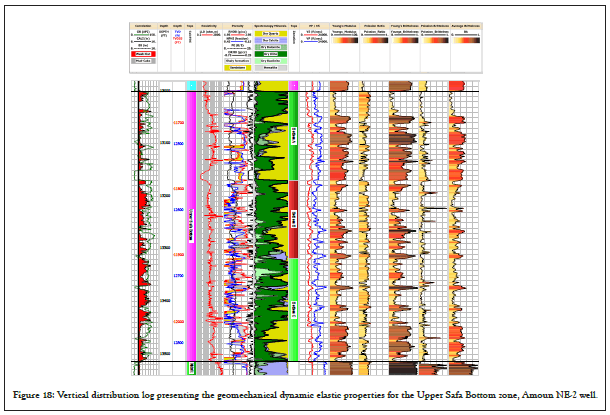
Figure 18: Vertical distribution log presenting the geomechanical dynamic elastic properties for the Upper Safa Bottom zone, Amoun NE-2 well.
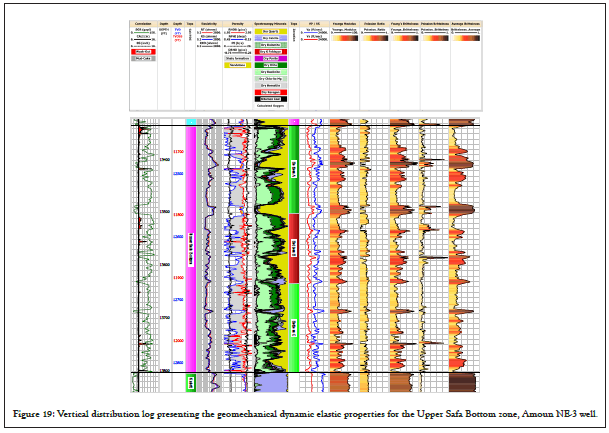
Figure 19: Vertical distribution log presenting the geomechanical dynamic elastic properties for the Upper Safa Bottom zone, Amoun NE-3 well.
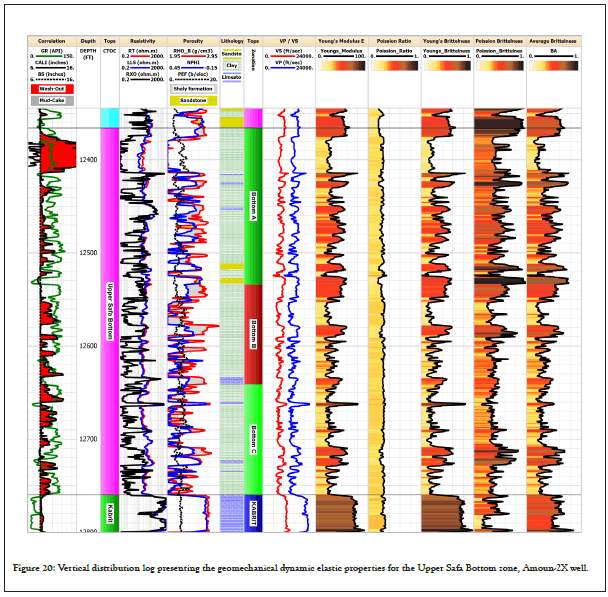
Figure 20: Vertical distribution log presenting the geomechanical dynamic elastic properties for the Upper Safa Bottom zone, Amoun-2X well.
When comparing these results with established shale gas reservoirs globally, it was observed that the mean values of Brittleness Average (BA) for the Upper Safa Top and Upper Safa Bottom zones in the studied area fall within the typical range observed in such reservoirs. This range typically spans from 0.2 to 0.8. These findings suggest that the brittleness characteristics of the Upper Safa shale reservoir are consistent with those of productive shale gas reservoirs worldwide.
The significance of these observations lies in the fact that brittleness plays a vital role in hydraulic fracturing operations and the subsequent release and extraction of shale gas. The favorable brittleness properties of the Upper Safa shale indicate its potential for efficient hydraulic fracturing and enhanced gas production.
Sweet spot identification
Various methods have been proposed and applied for determining the sweet spot in shale gas reservoirs, including a combination of geochemical, geological, petrophysical, and geomechanical factors (Figure 21) [18].
Figure 21: Unconventional shale gas resources sweet spot characteristics (modified after Baker Hughes [18]).
The study area identifies shale gas pay zones or sweet spots by employing the global minimum shale gas criteria which have been studied by many authors such as Chen, et al. [19], Wang, et al. [20], Gao, et al. [21], and Liu, et al. [22].
These zones exhibit moderate average values for the parameters of the Total Organic Carbon (TOC) content (≥ 1%), gamma ray (≥ 70 API), resistivity (≥ 5 Ω.m), brittleness average (BA) (≥ 0.2), and quartz content (≥ 12%).
The study presented results from evaluating shale gas sweet spot parameters for the Upper Safa Top and Upper Safa Bottom zones derived from the average calculations of the mentioned criteria cutoffs. The Upper Safa Top zone shale gas sweet spot intervals are characterized by a net thickness range from 50 to 114 ft., average TOC range from 1.6 to 2.6 wt.%, average quartz content range from 35 to 63 %, and average Brittleness Average (BA) range from 0.34 to 0.57. Similarly, the Upper Safa Bottom zone shale gas sweet spot intervals are characterized by a net thickness range from 82 to 199 ft., average TOC range from 2 to 3 wt.%, average quartz content range from 30.5 to 45 %, and average Brittleness Average (BA) range from 0.33 to 0.38. These results were presented in Table 6, vertically distributed in Figures 22-29.
| Parameters | Well/Zone Identifications | Well/Zone Identifications | ||||||
|---|---|---|---|---|---|---|---|---|
| Amoun NE-1X | Amoun NE-2 | Amoun NE-3 | Amoun-2X | Amoun NE-1X | Amoun NE-2 | Amoun NE-3 | Amoun-2X | |
| Upper Safa Top | Upper Safa Bottom | |||||||
| Sweet Spot Thickness (MD ft.) | 121.0 | 63.0 | 77.00 | 78.00 | 145.00 | 103.00 | 238.00 | 197.00 |
| Sweet Spot Thickness (TVT ft.) | 114.0 | 50.0 | 62.0 | 137.0 | 82.0 | 199.0 | ||
| Average TOC (wt.%) | 2.33 | 2.6 | 2.4 | 1.6 | 2.0 | 2.50 | 3.0 | 2.5 |
| Average Gamma Ray (API) | 108.00 | 96.0 | 97.0 | 97.0 | 110.0 | 95.0 | 94.0 | 87.0 |
| Average Resistivity (Ω.m) | 40.00 | 41.0 | 15.0 | 47.0 | 25.0 | 60.00 | 14.0 | 32.0 |
| Average Quartz Content (%) | 40.00 | 63.00 | 35.00 | NA | 37.00 | 45.00 | 30.50 | NA |
| Brittleness Average (BA) | 0.57 | 0.34 | 0.34 | 0.39 | 0.38 | 0.36 | 0.33 | 0.35 |
Table 6: Shale gas net sweet spot parameters of the Upper Safa Top and Bottom zones in the study area.
Figure 22: Sweet spot vertical distribution cross plot for the Upper Safa Top, Amoun NE-1X well.
Figure 23: Sweet spot vertical distribution cross plot for the Upper Safa Top, Amoun NE-2 well.
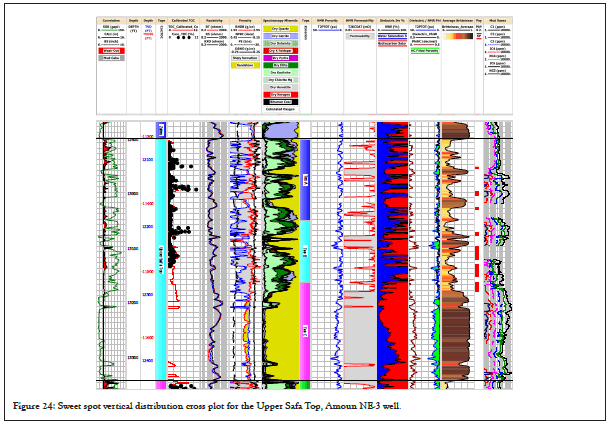
Figure 24: Sweet spot vertical distribution cross plot for the Upper Safa Top, Amoun NE-3 well.
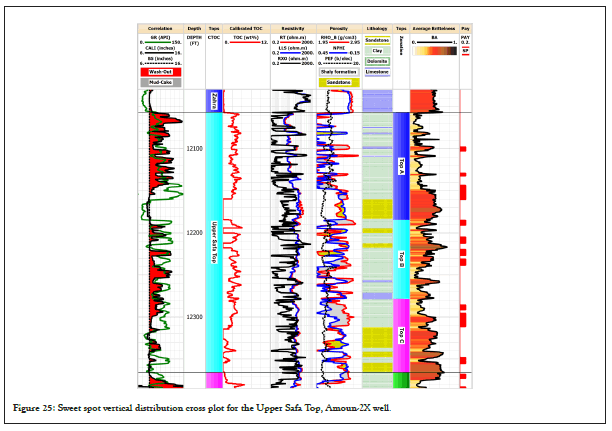
Figure 25: Sweet spot vertical distribution cross plot for the Upper Safa Top, Amoun-2X well.
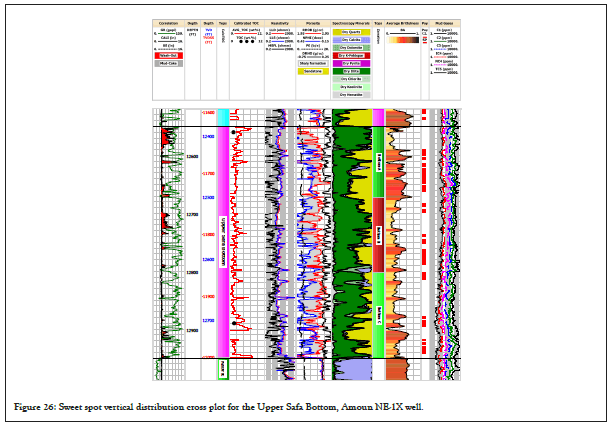
Figure 26: Sweet spot vertical distribution cross plot for the Upper Safa Bottom, Amoun NE-1X well.
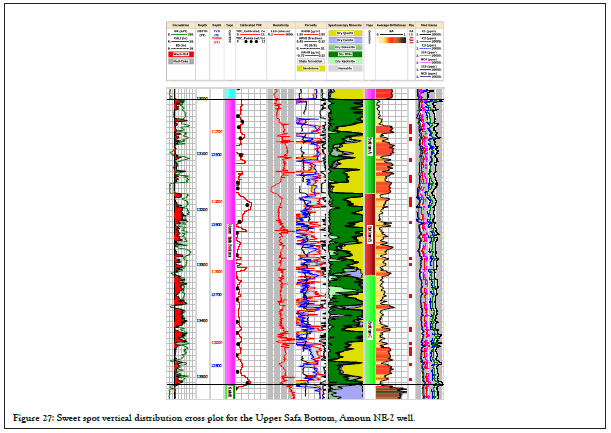
Figure 27: Sweet spot vertical distribution cross plot for the Upper Safa Bottom, Amoun NE-2 well.
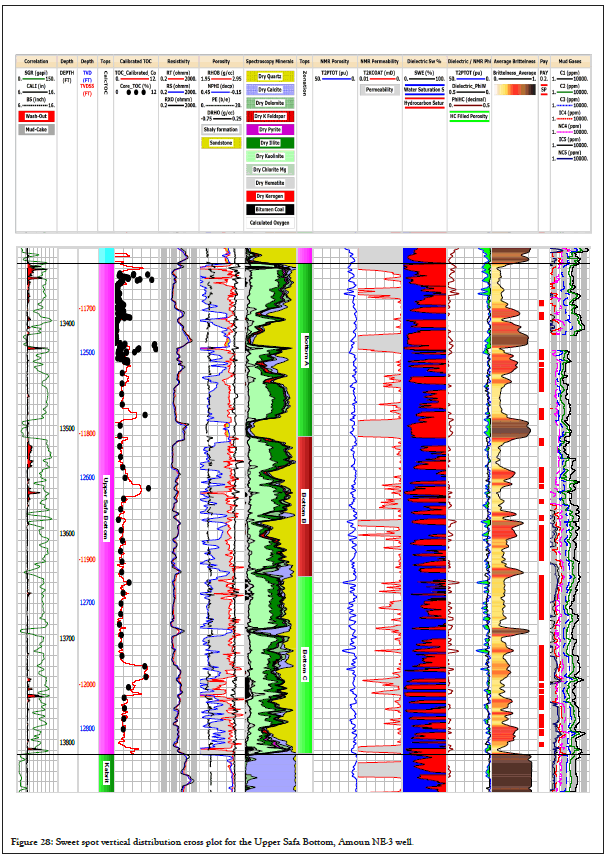
Figure 28: Sweet spot vertical distribution cross plot for the Upper Safa Bottom, Amoun NE-3 well.
Figure 29: Sweet spot vertical distribution cross plot for the Upper Safa Bottom, Amoun-2X well.
Sweet spot horizontal distribution
The isoparametric maps of the Upper Safa Top zone (Figures 30-33), indicate that the study area's central part is the most promising location for shale gas exploration, development, and production.
Figure 30: Net shale gas sweet spot thickness distribution map for the Upper Safa Top, Amoun field.
Figure 31: Average TOC distribution map for the Upper Safa Top, Amoun field [5].
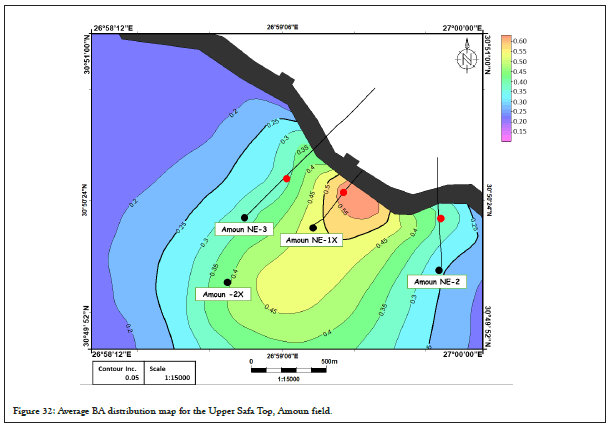
Figure 32: Average BA distribution map for the Upper Safa Top, Amoun field.
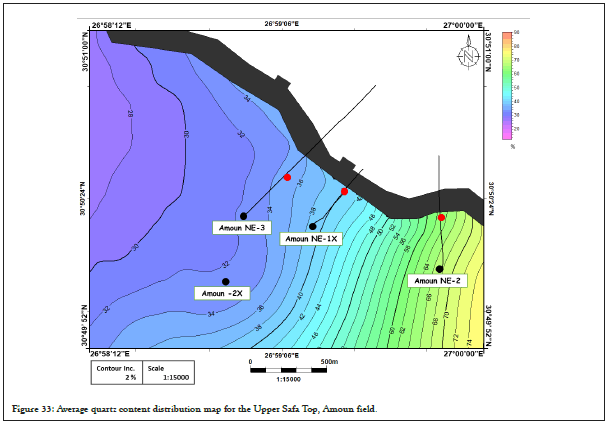
Figure 33: Average quartz content distribution map for the Upper Safa Top, Amoun field.
The sweet spot thickness, average total organic carbon content, and brittleness average maps all show that the central part along with the fault has the highest potential for shale gas production. Specifically, the Amoun NE-1X well is the most promising location, with the highest sweet spot thickness and brittleness average values among the four available wells. Moreover, the average total organic carbon content map was constructed by Elsaqqa, et al. [5], and suggested that wells located towards the fault direction have higher TOC values, implying that fault zones may have a significant role in the formation of shale gas reservoirs. These findings suggest that exploration and development efforts in the central part of the study area and near the fault zones could optimize shale gas production in the Upper Safa Top zone. Conversely, the data for the Upper Safa Bottom zone (Figures 34-37) suggests that the most promising location for shale gas production is in the western parts of the study area, particularly towards the northwestern directions near the fault zones. The Amoun NE-3 well has the highest sweet spot thickness and average TOC value in these areas. All four wells have a similar range of average BA values, with an increase in average BA values towards the central region of the study area aligned with the fault and a decrease towards the northwest direction. The Amoun NE- 1X well exhibits the highest average BA value.
Figure 34: Net shale gas sweet spot distribution map for the Upper Safa Bottom, Amoun field.
Figure 35: Average TOC distribution map for the Upper Safa Bottom, Amoun field [5].
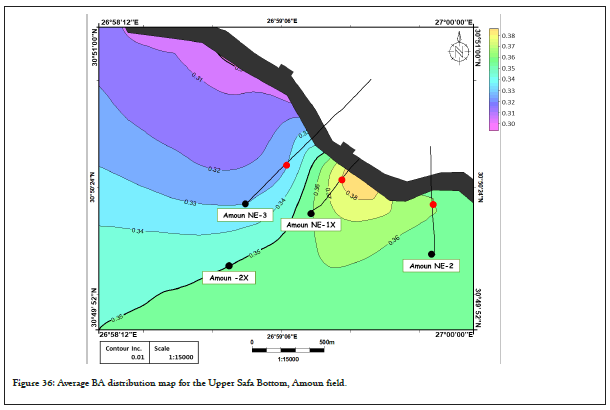
Figure 36: Average BA distribution map for the Upper Safa Bottom, Amoun field.
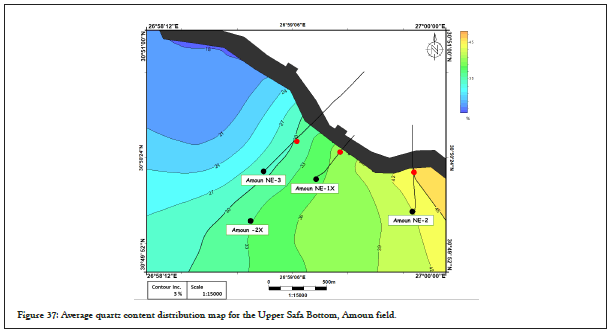
Figure 37: Average quartz content distribution map for the Upper Safa Bottom, Amoun field.
Upper Safa shale gas sweet spot’s characteristics vs. the top ten shale gas resources
In the study, a comparison was made between the sweet spot parameters of the Upper Safa member and the top ten global shale gas resources, as investigated by Javie [2]. The findings of this comparison revealed a significant alignment and correspondence between the parameters, indicating a strong similarity between the Upper Safa member and these globally recognized and productive shale gas resources. Table 7 illustrates the comparison, which revealed a remarkable similarity in the geological age of the Upper Safa and two prominent shale reservoirs, the Haynesville and Bossier shale, as all of them are of the Jurassic age. The depth of the Upper Safa (12036-12065 ft.) closely matched that of the Haynesville (up to 13,500 ft.) and Woodford (up to 13,000 ft.) shale reservoirs. The gross thickness of the Upper Safa (602.5- 790 ft.) matched the thickest ones of the top ten global shale gas reservoirs, such as Barnett (200-1000 ft.), Woodford (100-900 ft.), and Utica (300-1000 ft.). The net sweet spot thickness (132- 313 ft.) was comparable to several shale gas reservoirs, including the Marcellus (50-350 ft.), Haynesville and Bossier (200-300 ft.), Barnett (100-700 ft.), Fayetteville (20-200 ft.), Woodford (100-220 ft.), Eagle Ford (150-300 ft.), and Montney (up to 350 ft.).
| Factors | Shale Reservoir | Upper Safa (Top) | Upper Safa (Bottom) | Upper Safa (Entire) | Marcellus | Haynesville | Bossier | Barnett | Fayettville | Muskwa | Woodford | Eagle Ford | Utica | Montney | |
|---|---|---|---|---|---|---|---|---|---|---|---|---|---|---|---|
| Basin/Area | Amoun Field, Shushan Basin, northern Western Desert, Egypt | Appalachian Basin | Salt Basin, East Texas, North Louisiana | Salt Basin, East Texas, North Louisiana | Fort Worth Basin, Texas | Arkoma Basin, Arkansas | Horn River Basin, British Columbia | Arkoma Basin, Oklahoma | Eagle Ford Austin Chalk, Texas | Lowland, Quebec | W. Canada, British Columbia, Alberta | ||||
| Geological | Age | Middle Jurassic | Devonian | Late Jurassic | Late Jurassic | Mississippian | Mississippian | Devonian | Devonian | Cretaceous | Ordovician | Triassic | |||
| Depth (Range) (ft.) | 12036-2065 | 12367-12421 | 12036-12065 | 4000-8500 | 10500-13500 | 11650 | 6500-8500 | 5700 | 7000-9000 | 6000-13000 | 4000-10000 | 2300-6000 | 3600-9000 | ||
| Gross thickness (ft.) Range/(Average) | 225.5-380 (303) | 377-410 (393) | 602.5-790 (696) | 190 | 225 | 280 | 200-1000 | 50-325 | 360-500 | 100-900 | 100-300 | 300-1000 | 900-1500 | ||
| Net Sweet Spot thickness (Range) (ft.) | 50-114 | 82-199 | 132-313 | 49-350 | 200-300 | 200-300 | 99-700 | 19-200 | 399 | 99-220 | 149-300 | 500 | 350 | ||
| Geochemical | TOC Present Day (Range) (wt.%) | 1.6-2.6 | 2-3 | 1.6-3 | 2-13 | 0.5-4 | 0.5-4.2 | 3-12 | 2-10 | 1-10 | 3-12 | 2-8.5 | 0.8-5 | 0.2-11 | |
| Ro% (Range) | 0.83-1 | 0.9-5 | 1.2-2.4 | 1.1-2.4 | 0.85-2.1 | 2-4.5 | 1.4-2.2 | 0.7-4 | 0.8-1.6 | 0.8-3 | 0.9-2.5 | ||||
| HI Present Day | 50-378 | 20 | 14 | 15 | 45 | 15 | 10 | 60 | 80 | 27 | 17 | ||||
| GP=S1+S2 (mg/g) | 2.03-5.2 | 1.23 | 0.71 | 0.4 | 1.95 | 0.35 | 0.62 | 4.05 | 3.76 | 2.25 | 0.67 | ||||
| S2 (mg/g) | Up to 100 | 40.33 | 55.51 | 10.67 | 25.65 | 23.18 | 20.95 | 46.91 | 17.42 | 7.43 | 9.87 | ||||
| Petrophysical and Geomechanical | Quartz Content (%) | 35-63 | 30-45 | 30-63 | 37 | 30 | 25-30 | 45 | 35 | 60 | 55 | 15 | 12-51 | 40 | |
| Clay Content (%) | 22-50 | 40-55 | 22-55 | 35 | 30 | 35-50 | 25 | 38 | 20 | 20 | 15 | 15-26 | 15 | ||
| Porosity (Averages) (%) | 5.1 (Max. 19) | 4.73 (Max. 17.3) | 5 (Max. 19) | 4-12 | 4-14 | 7.5 | 4-6 | 2-8 | 1-9 | 5 | 6-14 | Not Reported | 4-6 | ||
| Permeability (nD) | 1400 (Max. 9500) | 1200 (Max. 9800) | 1300 (Max. 9800) | 0-70 | 0-5000 | 0-100 | 0-100 | 0-100 | 0-200 | 0-700 | 700-3000 | 0-50 | 5-75 | ||
| Water-Filled Porosity (%) | 4.2 | 3.7 | 4 | 43 | 30 | 40-70 | 1.9 | 70 | 30 | 40 | 35 | 60 | 25 | ||
| Hydrocarbon-Filled Porosity (%) | 3 | 3 | 3 | 4 | 6 | 4 | 5 | 4.5 | 4 | 3 | 4.5 | 2.9 | 3.5 | ||
| Hydrocarbon Saturation (%) | 49 | 38 | 43.5 | 1 | ≤ 1 | ≤ 1 | 10 | ≤ 1 | ≤ 1 | 5 | 15 | 5 | 1 | ||
| Brittleness (Averages Ranges) | 0.34-0.57 | 0.33-0.38 | 0.33-0.57 | 0.5-0.6 | 0.2-0.3 | 0.3-0.4 | 0.6-0.7 | 0.3-0.4 | 0.4-0.45 | 0.3-0.35 | 0.3-0.4 | 0.3-0.4 | 0.3-0.4 | ||
Table 7: Upper Safa shale gas sweet characteristics, Amoun Field, Shushan Basin, Western Desert, Egypt, Vs. the top ten global shale gas resources of Jarvie (2).
In addition, the Upper Safa sweet spots exhibited geochemical properties that are comparable to several prominent shale gas reservoirs. For instance, the measured Vitrinite Reflectance (Ro%) values of the entire Upper Safa (0.7 to 1.09%), and the calculated Ro% values (1.2-1.4 %) were within the range of Marcellus (0.9-5%), Barnett (0.85-2.1%), Woodford (0.7-4%), Eagle Ford (0.8-1.6%), Utica (0.8-5%), and Montney (0.9-2.5%). Moreover, the Hydrogen Index (HI) (50-378) was higher than almost all known global shale gas reservoirs. The Total Organic Carbon (TOC) content (1.6-3 wt.%), was found to be within the range of the top ten productive shale gas reservoirs, including Marcellus (2-13 wt.%), Haynesville (0.5-4 wt.%), Bossier (0.5-4.2 wt.%), Fayetteville (2-10 wt.%), Muskwa (1-10 wt.%), Eagle Ford (2-8.5 wt.%), Utica (0.8-5 wt.%), and Montney (0.2-11 wt.%). Furthermore, the genetic potential (GP mg/g) (2.03-5.2) was higher than that of the top ten global shale gas resources. Finally, the S2 (mg/g) was also within the range of the most productive shale gas reservoirs worldwide.
In terms of petrophysical properties, the Upper Safa sweet spots displayed an average porosity of 5% (ranging from 4.73% to 5.1%), which matched the values of several prominent shale gas reservoirs, including Marcellus (4-12%), Haynesville (4-14%), Barnett (4-6%), Fayetteville (2-8%), Muskwa (1-9%), Woodford (5%), and Montney (4-6%). The permeability (ranging from 1200 to 1400 nano-Darcy nD) was within the range of the highest known shale gas reservoirs' permeabilities, such as Haynesville (0-5000 nD) and Eagle Ford (700-3000 nD), while surpassing all other shale gas reservoirs. The hydrocarbon saturation (ranging from 38% to 49%, with an average of 43.5%) was significantly greater than that of all the top ten global shale resources. Furthermore, the quartz content (ranging from 30% to 63%) matched the highest known values reported in Marcellus (37%), Haynesville (30%), Barnett (45%), Fayetteville (35%), Muskwa (60%), Woodford (55%), Utica (up to 51%), and Montney (40%). The clay content (ranging from 22% to 55%) fell within the typical range of most global shale gas reservoirs.
Lastly, the Upper Safa shale reservoirs' brittleness (0.33-0.57), which is a key mechanical property, fell within the typical range of the most productive shale gas reservoirs worldwide, such as the Marcellus (0.5-0.6), Bossier (0.3-0.4), Fayetteville (0.3-0.4), Muskwa (0.4-0.45), Woodford (0.3-0.35), Eagle Ford, Utica, and Montney (all of the range 0.3-0.4).
These findings suggest that the Upper Safa shale reservoirs have significant potential as a shale gas resource and could be an important addition to the global shale gas market.
• Comprehensive geological, geochemical, petrophysical, and geomechanical evaluations are necessary for assessing shale gas reservoirs and identifying shale gas sweet spot intervals.
• The geochemical study findings indicate that the TOC values of the analyzed shale range from 1.31 to 80.4 wt.%, representing a range from poor to very good source rock. The kerogen present in the shale is primarily of type III, with some extent of type II. The shale has reached the stage of late maturity where it is in the peak of wet gas generation, as indicated by maximum Tmax values ranging from 462 to 475 degrees Celsius, measured %Ro values ranging from 0.7 to 1.09%, and calculated values of 1.2 to 1.4%.
• The petrophysical assessment yielded the following results: A high quartz content ranging from 27% to 55%, shale porosity averaging between 4.73% and 5.1%, and permeability averaging between 1200 and 1400 nano-Darcy (nD). The approximate water saturation values ranged between 51% and 62%, while the hydrocarbon saturation averaged between 38% and 49%.
• The geomechanical study indicated that the brittleness average (BA) of the Upper Safa Top zone falls within the range of 0.24 to 0.42, while the BA of the Upper Safa Bottom zone ranges from 0.25 to 0.36.
• In the Upper Safa Top zone, the sweet spot thickness across all analyzed wells ranges from 50 ft. to 114 ft. The average Total Organic Carbon (TOC) content falls within the range of 1.6 wt.% to 2.6 wt.%, while the quartz content ranges from 35% to 63%. The correct sentence should be: The Brittleness Average (BA) in this zone ranges from 0.34 to 0.57. On the other hand, in the Upper Safa Bottom zone, the net sweet spot thickness ranges from 82 ft. to 199 ft. The average TOC content varies from 2 wt.% to 3 wt.%, while the quartz content ranges from 30.5% to 45%. The average brittleness index (BA) in this zone ranges from 0.33 to 0.38.
• The comprehensive study conducted on the Middle Jurassic Upper Safa shale in the Amoun field, Shushan Basin, Western Desert, Egypt, unveiled a significant potential for shale gas resources in the region. The identified sweet spot parameters align with the typical range observed in shale gas reservoirs worldwide, suggesting a strong likelihood of economically viable gas production in the studied area.
The authors thank the Egyptian General Petroleum Corporation (EGPC) and Khalda Petroleum Company for providing the data and for permitting to publish this study.
Citation: Elsaqqa MA, El Din MYZ, Afify W (2023) Unconventional Shale Gas Sweet Spot Identification and Characterization of the Middle Jurassic Upper Safa Sediments, Amoun Field, Shushan Basin, Western Desert, Egypt. J Geol Geophys. 12:1103.
Received: 28-May-2023, Manuscript No. JGG-23-24499; Editor assigned: 30-May-2023, Pre QC No. JGG-23-24499 (PQ); Reviewed: 13-Jun-2023, QC No. JGG-23-24499; Revised: 20-Jun-2023, Manuscript No. JGG-23-24499 (R); Published: 27-Jun-2023 , DOI: 10.35248/2381-8719.23.12.1103
Copyright: © 2023 Elsaqqa MA, et al. This is an open-access article distributed under the terms of the Creative Commons Attribution License, which permits unrestricted use, distribution, and reproduction in any medium, provided the original author and source are credited.