Journal of Stock & Forex Trading
Open Access
ISSN: 2168-9458
ISSN: 2168-9458
Research Article - (2024)Volume 11, Issue 1
Despite being one of the most widely used techniques of financial management, stocks have drawn increasing numbers of investors during recent years. A substantial degree of risk is involved in buying stocks. The foremost concern for investors is how to minimize risks and maximize returns. One of the most common issues in the stock market is predicting a company's stock value. Volatility in individual profits and the health of the economy are negatively impacted by fluctuations in stock prices. One of the most widely held beliefs among humans is that investing in stock markets, which are supposed to produce excellent outcomes, is one of the finest ways to generate money. Volatility in stock market prices can occur for a variety of causes. It fosters an environment of uncertainty, which discourages constructive investment. Stock markets are notorious for their volatility. Those who are directly or indirectly involved in stock markets should be aware of it. It is necessary to create an intelligent system that can make forecasts based on a variety of indications such as fundamental, statistical, and technical trends. However, no single good predictive model has ever been able to consistently outperform market patterns. Traditionally, predictions for time series data have been made based on previous data and market trends, as well as historical correlation data and projections. Above all, there is no system that calculates projections based on a user's choice of investment type and risk tolerance. The main focus of this research work is on predicting stock market price changes. Instead of looking at daily changes, this research examines the price trend over specific time intervals by identifying turning points. To determine the increasing trend of price change, deep neural network model is used for accurate predictions. In this research work, an Efficient Time Series Stock Market Predictions using Time Interval Triggered Flag Attribute Model (ETSSMP-TITFA) using deep learning is proposed that predicts the lower bound and upper bound of stock market price predictions of multiple companies. The proposed model is contrasted with the traditional models and the results represent that the proposed model performance is better.
Stock market; Price prediction; Lower bound; Upper bound; Time interval triggered; Flag attribute; Time series data
The stock market does more than only mobilise new capital in a country's economy. Because of its diverse set of critical services that drive capital accumulation and contribute to productivity improvements, a strong national stock market has been regarded as critical to national economic progress [1,2]. An efficient market, along with a sound financial system, makes it possible to not only support but also predict economic growth [3]. Capitalization, liquidity, asset pricing and turnover linked to stock market activities have all been used to determine whether or not a country's economy is on solid ground [4]. Furthermore, economic expansion leads to the establishment of stock markets, which allows for the prediction of future rates of capital, productivity and per capita Gross Domestic Product (GDP) growth [5,6].
Because the stock market is one of the most important fields in which investors invest, stock market price probably true is always a hot topic for academics in both the financial and technical fields. Financial time series prediction is notoriously difficult due to the widely accepted, semi-strong form of economic efficiency and the high amount of noise. Short-term stock price prediction was also done using optimization techniques like Principal Component Analysis (PCA) [7,8]. Over time, researchers have attempted to evaluate stock market transactions such as volume burst hazards, broadening the stock market analysis study domain and indicating that this research domain still has a lot of promise [9]. Many proposed methods attempted to merge machine learning and deep learning techniques based on earlier approaches and then presented new metrics that serve as training features as artificial intelligence techniques progressed in recent years [10]. This type of prior work is in the domain of feature engineering and can be used to inspire feature extension ideas in our research.
To assess different quantitative methods in stock markets, Convolutional Neural Network (CNN) as well as a Long Short-Term Memory (LSTM) neural network based models are mainly utilized [11]. The CNN is used for stock selection and it automatically extracts features based on quantitative data and then uses an LSTM to retain time-series features in order to increase profits. In order to promote economic growth, the financial market is critical [12]. Individual investors and financial institutions can use financial time series data, such as stock market data, to move their investment toward beneficial returns [13]. Trading is as the act of buying and selling firm shares on a stock exchange in order to maximise profits [14]. Making an informed trading decision without prior knowledge is analogous to playing golf while blindfolded. Every trader or individual needs a thorough understanding of market behaviour, company performance and knowledge of how and when to invest to make wise trading decisions [15].
Every trader must choose the correct stock to trade in order to generate favourable profits. Aside from price and liquidity, volatility is an important factor to consider when choosing equities to trade [16]. The upward and downward fluctuation of the stock price is referred to as volatility. Stocks with higher volatility have a price that fluctuates considerably in either direction over a short period of time [17,18]. Stocks with low price volatility are less likely to rise or fall dramatically on any given day. Furthermore, various factors such as trading volume, news and financial reports, political events, economic conditions and investor expectations influence stock price [19,20]. High volatility equities are traditionally seen to be riskier, although swing traders frequently seek extremely volatile stocks in the hopes of generating better returns. The stock value prediction process is illustrated in Figure 1.

Figure 1: Investor expectations influence stock price.
There is no time gap between the arrival of information and its adjustment on stock price because the price adjustment is so quick. This rapid dissemination claim argues that there is no possibility to generate extra-nominal return with the knowledge available at a given time [21]. This result shows that an efficient market ensures a "fair game" in the stock return price mechanism. In other words, because all information available to market participants is included into its price, no investor is entitled to have any extra-nominal profit-generating information. In general, stock prediction approaches can be divided into three categories: technical analysis, fundamental analysis and evolutionary analysis [22,23]. The most often used method is technical analysis, which is based on statistical analysis [24].
The input data can be used to learn and analyse these statistics. However, numerous external factors influence the stock market trend, including the state of the corporation to which the shares belong, political order and global events [25]. As a result, stock market time series are frequently nonlinear and volatile. At the same time, there is a lot of volatility in the stock market. As a result, the data is quite noisy [26]. When developing a market forecast, it is critical to limit the risk to a minimum level. Deep learningbased techniques have recently demonstrated high accuracy in stock data classification. For time series data analysis, Recurrent Neural Networks (RNNs) have been frequently employed [27].
The goal of the time series stock model is to map historical stock information. To assist with the next wave of stock predictions, the historical data of stocks must be separated first. The first thing you should do with this method is collect and process data from time series [28]. Before projecting future trends in a time series, you must first observe the changes in its current trends and then determine future changes based on what you have learned about the past changes. When handling time series data, you are likely to encounter huge amounts of data, which are tedious to analyse [29]. This can be done by isolating the important trends and then separating the time series into separate parts. The initially complex data can be condensed while also reducing part of the stock sequence background noise with this division method. It is vital to not save information that is unhelpful for prediction because it allows the model to learn the variations in time series data more effectively and it makes it easier to find the time series rules.
Many financial institutions have used Artificial Intelligence (AI) approaches to predict stock market movements in recent decades. Deep learning has emerged as a dominating and popular AI technique in financial market analysis, with several promising outcomes in stock price predictions using nonlinear, data-driven and multivariate analysis [30]. In time series prediction, many deep Artificial Neural Networks (ANNs) have piqued researchers' interest. Fundamental and technical analysis is the two main techniques to making judgments in financial markets. Technical analysis derives technical indicators such as the Moving Average (MA), bollinger bands and logarithmic return from direct patterns in stock data and visual elements of charts. Fundamental analysis, on the other hand, is the process of examining the stock market at the most fundamental financial level in order to determine its intrinsic value. The vast majority of studies have concentrated on deep learning frameworks that rely on the raw dataset or a small number of characteristics. In order to deal with the complexities of the stock market, an efficient time series stock market predictions using time interval triggered flag attribute model using deep learning is proposed. As a result, technical indicators and macroeconomic variables are input into the system as a multivariate signal to estimate future stock values of multiple companies.
The stock market's impact on a country's economy goes far beyond simply mobilising capital. National economic growth is heavily dependent on a functioning national stock market because of the several critical services it provides, including capital accumulation and increased productivity. An effective banking system allows not just for economic growth, but also for economic forecasting. Various financial indicators, such as capitalization, liquidity, asset pricing and turnover, have been employed to determine whether a country's economy is on solid ground or not. Investors are always interested in the movement of the stock market; therefore, predictions about price movements are important to both the financial and technical industries.
TrevirNath, et al., [1] showed that, because of general market efficiency and significant noise, financial time series forecasting is difficult. Yaojun and Wang, et al., [5] employed artificial neural networks to forecast stock market prices and concentrated on volume, a specialised stock market attribute. They discovered that increasing the volume was not a useful way to improve forecasting results on the S and P 500 and DJI datasets. Han, et al., [7] used Support Vector Machine (SVM) models to short-term forecast stock prices. SVM was more successful than Master Limited Partnership (MLP) in most cases and these findings were also dependent on the trading techniques. While the big data flood was rushing by, financial-domain researchers used established statistical and signal processing approaches to study stock market data.
The PCA optimization approaches were also used in the short-term prediction of stock prices proposed by Qiu, et al., [9]. Researchers have long concentrated on analysing the stock price, but more recently they have begun to look at the market's transaction history, which expands the realm of stock market research and indicates it has significant potential. It has been noted that in recent years, numerous artificial intelligence solutions attempted to merge machine learning and deep learning techniques and that a novel metric used as a training feature had been proposed by Fischer, et al., [11].
Pimenta, et al., [16] suggested a CNN and LSTM-based model to examine stock market quantitative methods. The CNN may be used to increase profits by choosing stocks based on quantitative data, automatically extracting time-series characteristics and applying an LSTM to save the features for use in the future. The financial sector is a critical component in supporting the economy. Stock exchange data analysis, which includes information on personal and institutional finances, aids investors and financial institutions in directing assets to promising sources of return. Trading, in our view, can be simply defined as the purchasing and selling of a company's shares on the stock exchange in order to maximise profit.
To make effective trading judgments, users must be knowledgeable of market behaviour, company performance and know when and how to invest. Each trader must choose stocks intelligently in order to get profit. When it comes to selecting stocks to trade, liquidity and price are two important factors to consider, but volatility is the most important element. A fluctuation is the movement of the stock price up or down. In the short term, equities with high volatility can move dramatically in either way. Because of the rapid price adjustment when information arrives, there is no delay between the arrival of news and its impact on stock price. A quick spread of this belief contends that information available at a certain time is impossible to exploit to obtain a non-normal return.
External elements, such as the state of the firm and political order, have a significant impact on the stock market's movements. Since this is the case, time series in the stock market are a nonlinear and dynamic process overall. At the same time, the stock market is experiencing quite a significant upheaval. As a result, the data is highly unreliable. To ensure a low risk, it is critical to conduct an accurate market forecast. New deep learning-based classification systems have shown that they have strong accuracy for stock data classification. RNNs, especially, have been utilised in a variety of time series analyses. Shen, et al., [18] applied a deep convolutional neural network to short-term event-based stock market prediction.
A feed forward network has multiple layers having an input layer is proposed by Zubair, et al., [22] having one or more hidden layers and an output layer. The inputs correspond to the measured properties of each training sample. Inputs are sent to the input layer at the same time. The weighted outputs of these units are simultaneously supplied to the next layer of units that comprise the hidden layer. The weighted outputs of the hidden layers serve as inputs to subsequent hidden layers and so on. The number of concealed layers is an arbitrary design challenge. The weighted output of the last hidden layer serves as input to the output layer, which forecasts the networks for specific samples.
Back propagation is a learning algorithm for neural networks utilised by Thomas Fischer, et al., [25]. Back propagation networks learn by continually processing the sample set and contrasting the network prediction to the actual output. If the valuation exceeds the threshold, the weight of the interconnections is adjusted to lower the MSE between the prediction and original values. Weights are altered in the opposite way from the output layer to the first concealed layer. Back propagation is the name given to the technique since the modifications in the weights of the links are done in the opposite direction. To execute the calculations, use the back propagation procedure and compare the expected and target outputs. The anticipated value does not match the actual value; thus the weights are adjusted.
Fische Mospel, et al., [28] proposed an ensemble deep ANNs for the purpose of Chinese stock market prediction. Deep belief networks, recurrent neural networks, LSTMs and reinforcement learning are also employed for predicting stock prices. A Generative Adversarial Networks (GAN)-based stock market prediction model is also proposed by Eunsuk Chong, et al., [30]. Contrary to popular belief, the primary means of evaluating stocks is simple financial analysis, which is used to gauge a stock's inherent value. Most previous researchers have concentrated on deep learning frameworks that employ the raw data or only a few features considered. Technical indications and macroeconomic variables are integrated into a multivariate signal and supplied to the system to help us understand where stock prices will reach.
Proposed model
The ways to categorise stocks can be divided into numerous groups. Long-term investments are favoured by certain investors, while others prefer short-term investments. There are several signs of a stock price prediction that has no rules, the data is inconsistent and their models are incomplete. A typical one is a stock-related report that has average performance in stock price improvement.
The primary subject of this research is short-term price trend forecasting for a specific time for several companies. Only the time series data is considered at this point, with no descriptive labels attached. The first thing performed here is to assign data categories. To identify trends in the price of a commodity, the current closing price relative to the closing price of the commodity in n days earlier is considered, where n is defined as 1 to 15, as our research is focused on the short term. In case the price trend is on the rise, the flag is triggered and marked as 1. Otherwise, labelled as 0. More specifically, the price movement for the nth day using the indices of the previous day's indices are analysed.
The classification of valence was accomplished by the use of statistical parameters and CNN features, as illustrated in Figure 2. In the end, it was discovered that repeating the experiment produced greater performance of the classifier than using attribute values for a total of 240 samples in the first place. The input of the first CNN was consequently a 240 1 vector corresponding to around the first 2-3 layers. The convolution layers featured a one-dimensional Convolutional filter, Batch Normalisation (BN) and the max-pooling layer, which contained two-by-one filters in each of the two-by-one filters in the convolution layer. Each phase one convolution layer featured a total of 20 feature maps, enabling for cushioning of size one in each of the four convolution layers. To minimise over-fitting and boost performance, we applied a stabilised the input layer with stock prediction data. Because there were 200 nodes in the dense layer (dense1) to construct the low-dimensional features after hidden layers, it is reasonable to assume that the initial CNN had 200 features.

Figure 2: Stages in Convolutional Neural Network (CNN) framework.
The proposed model considers the dataset and then previous day fluctuations are calculated and the old value and new increased value set is maintained for every stock price prediction. The mean difference is calculated for the old value of stock and increased value. The exponential moving average is calculated for average time fluctuations and exponential moving average is calculated. The relative strength index and stochastic oscillator flag is calculated for price prediction. The price rate of change of a stock is analysed for lower bound and upper bound prediction. The proposed model framework is represented in Figure 3.

Figure 3: The exponential moving average is calculated for average time.
In time series data, Tg is considered as the time gap for fluctuations in the data and the Variables Set (VS) are considered and updated as

Where O1 is the old stock value and U1 is the updated stock value in a Time gap (Tg) which has to trigger the model for stock price updation.
The starting price of the stock of a specific organization in the starting of a day is predicted based on the previous day fluctuations and is calculated as
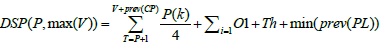
Where DSP is the day starting price, P is the previous day price, V is the difference between previous couple days, CP is the closing price, k is the threshold limit for increasing the stock price, O1 is the old stock price and PL is the profit level on previous day.
The Mean Difference (MD) of the previous day price and the starting day price of a specific organization is calculated as
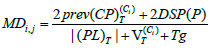
Moving Average Convergence Divergence (MACD) is an indicator that shows the trend of the price and is based on Exponential Moving Average (EMA). MACD is calculated as

Here EMA signifies the more recent updated price and 7 and 14 represents the number of days’ values considered in the analysis of price prediction. Based on the MACD calculated, the EMA is updates as

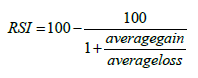
Relative Strength Index (RSI) is an oscillator-based indicator that focuses on the strengths and weaknesses of the price. It is formulated as follows:
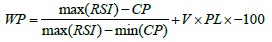
Williams Percentage (WP) is a technical indicator based on momentum. An investor can discover oversold and overbought circumstances using this indicator. The process of calculating WP is
Stochastic Oscillator Flag (SOF) is a composite measure that is based on the price's swiftness. As a general rule, momentum shifts occur before price shifts. According to a low-high range, it calculates the close price levels in real time. To calculate this Flag Attribute (FA) indicator, the process is
SOF = DSP − PL +V
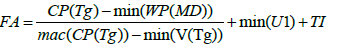
The flag attribute is triggered when there is a change in the stock price. The updating will be performed in a regular time intervals T1 and the updating are analysed for further predictions.
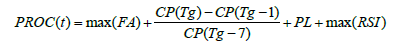
Price Rate of Change (PROC) indicates the pace at which a price changes over a specific time period that is calculated as
The stock prediction of any organization involves in calculating of lower bound and upper bound values in a day. The Lower Bound (LB) represents how lower the price will be on that day that is calculated as
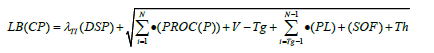
Here λ represents the flag attribute fluctuations minimum count, Th is the threshold value added for the lower bound value of the day.
The Upper Bound (UB) represents the maximum value a share can reach on a single day that is calculated based on the fluctuations flag attribute and the previous day closing value. The UB is calculated as
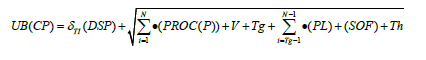
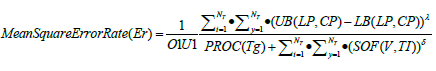
Here δ represents the flag attribute fluctuations maximum count, Th is the threshold value added for the lower bound value of the day. The error rate is measured as
The proposed model is implemented in python using Google Colab and the dataset is considered. The proposed Efficient Time Series Stock Market Predictions using Time Interval Triggered Flag Attribute model (ETSSMP-TITFA) is compared with the traditional Long Short-Term Memory (LSTM) Model. The proposed model is compared with the traditional model in terms of time series data clustering accuracy, fluctuations in price prediction accuracy levels, time series data classification time levels, lower bound prediction accuracy levels, upper bound prediction accuracy levels and market value prediction true positive rate. The results represent that the proposed model is better in its performance. The time series data clustering accuracy levels of the proposed and traditional models are represented in Figure 4.

Figure 4: Time series data clustering accuracy.  Time Series Stock Market Predictions using Time Interval Triggered
Flag Attribute (ETSSMP-TITFA) model;
Time Series Stock Market Predictions using Time Interval Triggered
Flag Attribute (ETSSMP-TITFA) model;  Memory (LSTM) model; MB: Monetary Base.
Stock market prices are affected by demand-supply economics. In simple words, when demand for a stock exceeds supply, there will be a rise in the price of a stock. The more drastic the demand-supply gap, the higher the price. The fluctuations in price prediction accuracy levels of the proposed and traditional model are represented in Figure 5. The results indicate that the proposed model prediction accuracy levels are high. The opening price of the stock considered is represented in Figure 6.

Figure 5: Opening price representation of a stock. Note: ZEEL: Zee Entertainment Enterprises Limited.

Figure 6: Fluctuations in price prediction detection accuracy levels.  Efficient Time Series Stock Market Predictions using
Time Interval Triggered Flag Attribute (ETSSMP-TITFA) model;
Efficient Time Series Stock Market Predictions using
Time Interval Triggered Flag Attribute (ETSSMP-TITFA) model;  Long Short-Term Memory (LSTM) model; MB: Monetary Base.
Organizations will have to determine their data and its level of sensitivity by defining a set of rules. Classifying data means to organise data into relevant categories in order to use and protect it better. The stock representations in opening and upper and lower bounds are represented in Figure 7.

Figure 7: Representation of stock value analysis.
The time series data is a type of data that will be updated continuously and applying classification on such data is a critical task. The time series data classification time levels of the proposed and traditional models are indicated in Figure 8.

Figure 8: Time series data classification time levels.  Time Series Stock Market Predictions using Time Interval Triggered
Flag Attribute (ETSSMP-TITFA) model;
Time Series Stock Market Predictions using Time Interval Triggered
Flag Attribute (ETSSMP-TITFA) model;  Memory (LSTM) model; MB: Monetary Base.
The lower bound minimum possible price for a call option is defined as the variation between the current price of the stock and the option's current strike price. The value of the call option cannot drop below the current stock price minus the current dividend and strike price, as long as we are sure of the pay-out. The lower bound price prediction levels of the proposed and the traditional models are represented in Figure 9.

Figure 9: Lower bound prediction accuracy levels.  Short-Term Memory (LSTM) model;
  Time Series Stock
Market Predictions using Time Interval Triggered Flag Attribute
(ETSSMP-TITFA) model; MB: Monetary Base.
Time Series Stock
Market Predictions using Time Interval Triggered Flag Attribute
(ETSSMP-TITFA) model; MB: Monetary Base.
The upper bound is the smallest value that would round up to the next estimated value. The upper bound price prediction values of the proposed and the traditional models are represented in Figure 10. The results show that the proposed model upper bound prediction levels are accurate than the traditional models [31-36].

Figure 10: Upper bound prediction accuracy levels.  Efficient Time Series Stock Market Predictions using Time Interval
Triggered Flag Attribute (ETSSMP-TITFA) model;
Efficient Time Series Stock Market Predictions using Time Interval
Triggered Flag Attribute (ETSSMP-TITFA) model;  Term Memory (LSTM) model; MB: Monetary Base.
The stock market price prediction of the proposed model is represented in Figure 11. The predictions are accurate in the proposed model.

Figure 11: Stock market predictions. 
Forecasting the price of an investment, such a stock or bond, is all about trying to predict the future value of a company. Knowing in advance how a stock will move will make you a lot of money. The proposed model performance level indicates that the stock market price prediction is more accurate when compared to traditional models. The price prediction accuracy levels of the proposed and traditional models are shown in Figure 12.

Figure 12: Market value prediction true positive rate.  Efficient Time Series Stock Market Predictions using Time Interval
Triggered Flag Attribute (ETSSMP-TITFA) model;
Efficient Time Series Stock Market Predictions using Time Interval
Triggered Flag Attribute (ETSSMP-TITFA) model;  Term Memory (LSTM) model.
The stock market predictions based on the closing price is calculated and represented in Table 1. The proposed model prediction rate is accurate when compared to the traditional models.
| Date | Adj close | Predictions |
|---|---|---|
| 24-09-2021 | 320.65 | 325.838837 |
| 24-09-2021 | 2.02 | 1.214186 |
| 27-09-2021 | 317.74 | 319.308044 |
| 27-09-2021 | 2 | 0.155734 |
| 28-09-2021 | 312.67 | 313.831665 |
| 28-09-2021 | 2.02 | 1.068909 |
| 29-09-2021 | 309.93 | 309.552124 |
| 29-09-2021 | 2.05 | 1.010513 |
| 30-09-2021 | 304.79 | 307.032562 |
| 30-09-2021 | 2.05 | 2.482316 |
Table 1: Stock market prediction rate.
It has been difficult for computers to predict the stock market since they need to do time series analysis. Deep neural networks have recently been used in numerous financial time series problems. Typically, it takes a lot of data samples to train a strong deep neural network. Despite this, the small sample size of stock market data has the unintended effect of making the networks more susceptible to over fitting. The main focus of this research is the short term prediction of stock value for multiple companies based the factors considered using an efficient time series stock market predictions using time interval triggered flag attribute model using deep learning technique. As one of the stages in constructing the proposed predictive model, clustering gathers stocks with similar behaviour. At regular time intervals, the stock values are analysed and the flag attribute is triggered if change in stock price. The past stock fluctuations are mainly considered and other parameters are also taken into account and then prediction will be performed. The proposed prediction model can aid traders in deciding which stocks to buy, increasing their trading range. It is observed that the proposed model findings improved when contrasted with the existing models. In future, the features considered can still be optimized and in less time the predictions need to be performed with improved accuracy levels.
[Crossref] [Google Scholar] [PubMed]
[Crossref] [Google Scholar] [PubMed]
Citation: Kalva S, Satuluri N (2024) Time Series Stock Market Predictions: Using Time Interval Triggered of Flag Attribute Model in Deep Learning. J Stock Forex. 11:249
Received: 20-Dec-2022, Manuscript No. JSFT-22-21026; Editor assigned: 26-Dec-2022, Pre QC No. JSFT-22-21026 (PQ); Reviewed: 09-Jan-2023, QC No. JSFT-22-21026; Revised: 16-Jan-2023, Manuscript No. JSFT-22-21026 (R); Published: 01-Mar-2024 , DOI: 10.35248/2168-9458.24.11.249
Copyright: © 2024 Kalva S, et al. This is an open-access article distributed under the terms of the Creative Commons Attribution License, which permits unrestricted use, distribution, and reproduction in any medium, provided the original author and source are credited.