Journal of Geology & Geophysics
Open Access
ISSN: 2381-8719
ISSN: 2381-8719
Research Article - (2023)Volume 12, Issue 12
The study area is located in the north-western flanks of the Red Sea hills in the Hamissana area, NE Sudan. The area is representing a basement terrain as a part of the Arabian-Nubian shield during the Pan African Oregon. Geologically and structurally the terrain is complicated and undergone multi deformational phases. The main objective of the current study is to investigate the capability of enhanced satellite gravity data for to support the accuracy of geological mapping. The method of the study is based on the integration of remote sensing techniques, geological field survey with the processed satellite gravity data to strength the surface and subsurface geological mapping as guide for mineral exploration, hence the area is considered as important zone for mineral resources. The remote sensing investigations are based on the digitally processed Landsat +7 ETM and Sentinel 2 data, which produce more appealing images suitable for geological interpretation through false color compositing and image transformations, confirm by field survey. The satellite gravity data was processed informs of Bouguer Anomaly (BA), Second Vertical Derivatives (SVD) to detect the density variations and structural features in subsurface geology. The occurrences of mafic-ultramafic rocks appear in high density anomaly, the granitic rocks and meta-sediments appeared in low density values, while the metavolcanics appeared in medium anomaly. The subtle thrusted slaps of ophiolitic melange were detected through the compilations of geological and satellite gravity data, in other way the surface appearance of some lithological units is not always reflect the actual geological setting.
Hamissana; Red sea; Remote sensing; Geological mapping; Satellite gravity
The study area is located in the north-western flanks of the Red Sea hills in the Hamissana area, as a part of Gebeit Al- Maadin district, which form a prominent physiographic feature in NE Sudan. It is bounded by approximately by latitudes: 20°26'00''-21°00'00'' N and longitudes: 34° 40'00''-35°10'00'' E (Figure 1). Topographically, the Hamissana area as a part of Red Sea hills is characterized by undulating topographic surface and high relief rocky terrains that vary in height approximately between 900 m to 540 m above mean sea level, bisected by Khors and Wadies. Generally the drainage pattern of the Red Sea hills is structurally controlled [1].

Figure 1: The location map of the study area.
The Red Sea hills characterized by a tropical arid climate, which play an effective physical barrier between the coastal plain to the east and the Nubian desert to the west. The temperature rises up to 46°C during summer (April-October) and decreases to below 20° during winter (November-February). The average annual rainfall in the area is between 10 mm and 50 mm, the prevailing arid conditions characterizing the region are clearly reflected in the scarce and poorly distributed vegetation cover. The widely scattered pushes and panel acacia are confined to the main wadies and their tributaries [2].
The Arabian Nubian Shield (ANS) represents the northern part of East African Orogen, which is formed by the collision between the east and west Gondwana at the end of the Wilson cycle during the pan African Era. The ANS is of global interest because it contains a complete record of the formation of juvenile continental crust consist of the abundance of ophiolitic rocks as the plate tectonic boundaries operated throughout the neoproterozoic. The ANS is composed of intra-oceanic island arc/back arc basin complex and micro continents welded together along north to east trending sutures. The Hamissana Zone (HZ) is one of the major high strain zones of the Pan- African ANS. Vail is the first appreciated the significance of the major N-S trending structure which now called the Hamissana Shear Zone (HSZ) [3].
The area is dominated by meta-volcanic/meta-sedimentary units and mafic-ultramafic rocks with ophiolitic affinity. These layered sequences are intruded by the syn-to late-orogenic and postorganic igneous intrusions. Mafic-ultramafic rocks having features characteristic of ophiolite sequences occur mostly in north east of the study area (kiaw). They represents the southern part of the Onib-Sol Hamid ophiolite and form an elongated surface and hilly outcrops trending in north-south direction [4].
Objectives
The main objective of the current study is to investigate the capability of enhanced satellite gravity data for to support the accuracy of geological mapping mainly considering the lithological and structural elements that controlling the mineralization, hence the area is considered as important zone for mineral resources especially gold mineralization [5].
The research methods are planned in order to achieve the objectives of the study, this consist of; office work, field work and laboratory analysis. It includes remote sensing and GIS techniques, geological, structural and geophysical investigations. Remote sensing and GIS techniques were used in this study together with field survey to makes geological mapping and to determine the surface parameters that govern the sub-surface geological conditions. The Landsat+7 ETM and Sentinel 2 images were digitally processed in order to obtain a full coverage of the study area and to produce more appealing images suitable for geological interpretation. This was conducted utilizing image mosaicking, sub-setting, false color compositing and image transformations. The post-field stage includes the different types of analyses and interpretations of field measured data including petrography, structural and geophysical data [6].
The satellite gravity data of approximately 2 km grits of the Hamissana area were obtained from University of California-San Diego Web. These data were used for to detect the density variations that helping in geological and structural mapping. Newton’s law of the universal gravitational is still used for the partial situation such as satellite motions, these satellites used to measure the height of the sea surface, from which free-air gravity was calculated. The free air anomaly is the measured gravity by m.gal after applied free air correction. The data are processed to remove all the predictable effects for to present the maps and for anomaly projections. The air anomaly already process in the data acquisition to make x-y plot contour map from free air anomaly. Bouguer anomaly is the measuring gravity by ml.gal after applying elevation correction (free air correction-Bouguer correction) [7].
Satellite image enhancement for geological mapping
Remote sensing shows an increasing role in the field of georesources development. Remote sensing provides multi-spectral, multi-temporal and multi-sensor data of the earth’s surface which are suitable for mineral explorations, water resources evaluation and environmental monitoring.
Remote sensing techniques were use in this study together with field survey for geological mapping. Digital image processing are all processes of rectifying the remotely sensed data to map projection, enhancing and classifying the data into different categories and identifying change between dates of imagery. It consists of the manipulation and interpretation of digital image with the aid of a computer [8].
In the current investigations the optical multispectral Landsat+7 ETM and Sentinel 2 data were atmospherically corrected by the Dark Object Subtraction method (DOS) and were mosaicked and fused together in order to have a regional satellite data for Hamissana terrain (Hamissana data), which gives a regional synoptic view (Figure 2) [9].

Figure 2: Mosaic image of four ETM+scenes for Hamissana region.
The digital image processing operations were conducted on a spatially sub-set of the Hamissana data that fit the spatial extent of the study area. For the purpose of lithological discrimination and geological mapping, two different color composites by applying the simple linear stretching were produced: 7, 4, 2 and 7, 5, 4 in the R, G and B, respectively (Figure 3). Band rationing forms by the division of brightness values in one band divided by the corresponding values in another band on a pixel by pixel basis. Band rationing suppresses differences in albedo, thereby materials that have different albedos but similar spectral characteristics may be indistinguishable in ratio images. Ratio images can be displayed in gray-scale or as color composites [10]. This technique was applied in order to enhance the differences between lithological units present in the study area for to improved geological mapping (Figure 4).

Figure 3: Colour composite of bands: 7,4, 2 (left) and 7, 5, 4 (right) in RGB, respectively.

Figure 4: Sultan ratio color composite of band ratios: RGB=7/5, 5/1, 5/4*3/4.
Satellite gravity
The gravity is a non destructive (potential field) geophysical method that measures differences in the earth’s gravitational field at specific locations. The success of the gravity method depends on the different earth materials having different bulk densities (mass) that produce variations in the measured gravitational field [11].
The free-air correction: Since the earth's gravitational attraction is nearly of a sphere with central symmetry, it attracts as though its mass were concentrated at the center. Thus, as one rises (increases) in elevation above sea level, the gravitational attraction will decrease as the inverse square of the distance to the center of the earth. Since possible elevation changes on the earth are only on the order of 0.1% of the earth’s radius [12]. The effect of a change ΔZ (m) in elevation is determined in terms of the resultant change in gravity by;
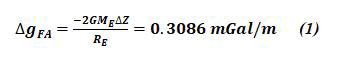
This is termed the free-air effect and the mean vertical gradient of (g) above the surface of the earth. The data are processed to remove all the predictable effects to present the maps. The air anomaly is already process in the data acquisition make from free air anomaly in contour map and x-y plot explained the anomaly (Figure 5) [13].

Figure 5: The contour map and x-y plot explained the free air anomaly.
The Bouguer correction: Bouguer anomaly is the measuring gravity by ml.gal after elevation correction (free air correction- Bouguer correction). When one increases elevation on the earth, it usually implies that there is an additional mass between the original level and the new level. This additional mass itself will exert a positive gravitational attraction, which acts to reduce the free-air (negative) gravity change [14]. The Bouguer gravity effect ΔgB is calculated on the basis of the gravitational attraction of a horizontal slab, of infinite extent and of thickness equal to the elevation difference, in accord with equation;
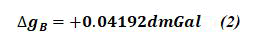
Where d is the mean density of the slab in g/cm3.
For gravity measurements beneath the surface of the earth, the Bouguer effect will be negative. Bouguer anomaly=free air anomaly-(0419 × density × elevation). The contour map and x-y plot explained the Bouguer anomaly was produced (Figure 6) [15].

Figure 6: Contour map for Bouguer anomaly covers the study area.
Anomalies separation and filtering: Bouguer anomaly measurements include the effect of regional gravity and residual gravity. Grant defined the regional gravity anomaly as “the field that is too broad to suggest the object of exploration and it is generally assumed to be smooth and regular, suggesting characteristically the field due to a deep-seated disturbance” [16]. Skeels, defined the regional gravity as “the interpreter's concept of what the Bouguer gravity should be if the anomalies were not present” and the residual gravity as "what remains of Bouguer gravity after subtraction of a smooth regional effect". However, the regional gravity can be expressed as follows:
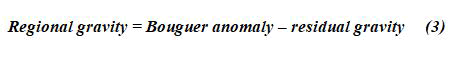
Residual gravity equals Bouguer gravity after subtraction of a smooth regional effect [17]. Various methods elaborated to perform the separation of the anomalies in the order to emphasize the important and interesting features and to suppress the others such as; polynomial and second derivatives methods [18].
Polynomial method, used regional and residual separation and mainly depends on the best fitting styles as flow: (y=a+bx+cx2+ …).
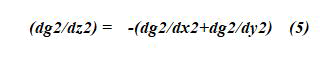
Second derivative method: It is second partial derivative of any potential field (gravitational magnetic, electric, etc) which satisfied the following Laplace’s equation;
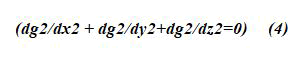
G = gravity field
The most commonly used second derivative is the second vertical derivative which may be found from the above equation as follows:
Generally, the more popular form of second derivative is;
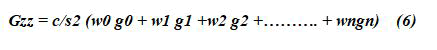
Where:
Gzz is the second derivative or residual at point o, c is the constant for particular system, s is the grid spacing, W0, W1, …..=weighting factors, g0 is the gravity at the point of calculation, g1, g2 ….=average values around the successive ring.
The weighting factors are of positive (+ve) and negative (-ve) signs are the sum of the factors:
Based on the above theoretical knowledge the second derivative map was illustrated in Figure 7.

Figure 7: Second derivative contour map for the study area.
As mentioned in the methodology section, the geological mapping was carried out through the digital image processing of remotely-sensed data, field checkup and petrography investigations. The digital images after being processed and digitally enhanced were imported to the GIS framework [19]. Likewise, the results of petrography investigation were imported and plotted in their proper locations, where the rock samples have been collected. Structural measurements of known locations were also plotted in the GIS database. On-screen digitization was carried out to delineate the contact between various lithological units guided by their spectral appearance which controlled by the results of petrography. This process resulted in the preparation of the surface geological map of the study area (Figure 8) [20].

Figure 8: The produced surface geological map of the study area.
For subsurface mapping the satellite gravity data were used after processing. Gravity data could be presented as a map or as x-y plot. The interpretation of gravity data may be classified as:
• Qualitative interpretation
• Quantitative interpretation
Qualitative interpretation: This may be achieved by dividing the contour map or the x-y graph to different anomaly zones with the available geological constrain, these maps or graphs may be interpreted in terms of different lithological or structural unites [21].
In the north eastern part of the Hamissana area (Kiaw) shows high anomalies of free air and Bouguer values, this is may be attributed to the crust and mantle effects. This phenomenon in the study area may refer to the presence of ultra-mafic rocks in this portion which relatively of high density compared to metavolcano- sedimentary rocks in the other parts [22].
Quantitative interpretation: From second vertical derivatives and polynomial filtering there are three types of anomalies. From field observations the high density values represents ultramafic rocks or due to the existence of mafic meta-volcanics or due to the occurrences of basic dykes. Moderate anomalies are referred to the present of intermediate meta-volcanics rocks and the low anomalies attributed to the represent of meta-sediments [23]. The circular shapes of low gravity values are represent the acidic post orogenic intrusions. Sub surface geological map was prepared from second vertical derivatives anomalies to separate in detail the density variations within the lithological facies (Figure 9).

Figure 9: Conducted subsurface geological/structural map depend on second vertical derivatives.
In some locations were the ultra-mafic rocks existed at the surface appear in low anomaly. This interpreted as thrusted thin layers of ultra-mafic rocks underline by meta-sediment layers of low density. On the other hand in some locations, granitic intrusions appear in high anomalies which indicate shallow emplacement of granitic rocks within the mafic/ultramafic masses that behind the appearance of high anomalies [24]. Form second vertical derivatives the zero lines represent fault plains between high positive and low negative anomalies (Figure 9).
The emplacement of different rocks will strongly affect on mineral exploration view, where different mineral resources are restricted to certain lithological facies controlled by distinctive structural frame. The gold mineralization in the study area is mainly related to the syn-orogenic intrusions and mafic/ ultramafic rocks in quartz veins [25]. The Gossanic ores are related to acid and intermediate meta-volcanics.
This study represents comprehensive integration of different aspects of geology including geological mapping, structural manifestation through remote sensing techniques and field survey supported by the processed satellite gravity data. The methods of the study are includes; office work, field work and laboratory analysis, for to study surface and sub-surface geological and structural setting. The geological mapping was carried out through the digital image processing of remotelysensed data, field checkup and petrography investigations. The satellite gravity geophysical method was applied to detect the subsurface geology through the density variations for to enhance the geological mapping and to recognize the extensions of the common geological structures. The area is dominated by metavolcanic/ meta-sedimentary units and mafic-ultramafic rocks with ophiolitic affinity. These layered sequences are intruded by the syn-to late-orogenic and post-organic igneous intrusions. The integration of these methods was used for to strength the surface and subsurface geological mapping as guide for mineral exploration. The gold mineralization is mainly related to the synorogenic intrusions and mafic/ultramafic rocks in quartz veins. The Gossanic ores are related to acid and intermediate metavolcanics.
The authors are deeply acknowledging the respective support from Orshab Mining Company during the field survey that make the mobilization and camping possible for the study team. The thanks are also extended to the faculty of petroleum and minerals Al Neelain University for laboratories and field facilities support.
Citation: Elsheikh AEM, Ali OMM, Khidir SOE (2024) The Use of Satellite Gravity to Enhance the Geological Mapping, Southern Hamissana Area, Red Sea Region, Sudan. J Geol Geophys. 13:1174.
Received: 11-Apr-2023, Manuscript No. JGG-24-30117; Editor assigned: 14-Apr-2023, Pre QC No. JGG-24-30117 (PQ); Reviewed: 28-Apr-2023, QC No. JGG-24-30117; Revised: 27-Feb-2024, Manuscript No. JGG-24-30117 (R); Published: 26-Mar-2024 , DOI: 10.35248/2381-8719.24.13.1174
Copyright: © 2024 Elsheikh AEM, et al. This is an open-access article distributed under the terms of the Creative Commons Attribution License, which permits unrestricted use, distribution, and reproduction in any medium, provided the original author and source are credited.