Journal of Geology & Geophysics
Open Access
ISSN: 2381-8719
ISSN: 2381-8719
Research - (2023)Volume 12, Issue 7
The characteristics of a centrifugal pump-pipeline system are investigated in relation to the rheological characteristics of field emulsions. In this study, a new processing method is proposed that can be used to calculate these characteristics. During the process, demulsifiers were taken into account to affect emulsion rheology. Furthermore, it was considered to pump highly watered crude to a preliminary water removal unit from the booster pump station. This study found that smaller-diameter pipes are more effective at reducing viscosity rapidly in collection pipelines. Pipelines with large diameters are most effective at pressure pipelines because they have low shear rates and, therefore, low effective viscosities.
Centrifugal pump; Pipeline; Rheology; Demulsifiers; Viscosity; Shear rate
Typically, emulsions coming from wells and Group Metering Units (GMU) to Booster Pumping Stations (BPS) contain a demulsifier, which partially exfoliates in the buffer tank during its stay [1-4]. Due to this, the rheological properties of the liquid entering the pump intake change during pumping. Initially, after the next turn on of the pump, free and/or released water is pumped out. Then the intermediate layer is pumped out, characterized by high water cut and viscosity [5-8]. The oil is pumped out last with finely dispersed emulsified water remaining in it. Consequently, during pumping, the viscosity of the fluid can vary widely and may be many times greater than the viscosity of water and oil. It must be considered both when choosing a Centrifugal Pump (CFP) and an electric motor for it, and in the future, for example, when trying to find the optimal mode of operation for the BPS as an integral part of the CFP-pipeline system [9-12].
For inverse emulsions, the viscosity depends on the content of emulsified water. The viscosity of emulsified water increases with decreasing droplet size, at least for droplets with diameters between 100 mm and 20 mm [13-16]. When the content of emulsified water is higher than 20-40%, the dependence of viscosity on shear rate appears and increases [17-20]. The lower the shear rate, the more non-Newtonian properties and the steeper the rheological curve (Figure 1). In the region of high shear rates, the rheological curve flattens out and the viscosity changes insignificantly.

Figure 1: The dependence of the viscosity of an emulsion with a water
cut of 43% on the shear rate. Note:  Rheological curve;
  Measured viscosity.
Microscopic monitoring
At the late stage of field development, high-water emulsions of a complex type are supplied to the BPS. Studying the dynamics of the sludge and its dispersion under a microscope and its rheological characteristics in the field and in the laboratory led to the conclusion that these are not classical emulsions of two immiscible liquids, but rather complex multilevel disperse systems. Moreover, due to a strong decrease in interfacial tension caused by surfactants used in production and in the collection system, as well as due to the small size of droplets, coalescence in such emulsions is difficult, and dispersion, on the contrary, is facilitated. Observations in an optical microscope showed that both water and oil are saturated with tiny particles. At high magnification, these particles turn out to be associates, easily disintegrating under any, even a weak perturbation. The presence in both phases of a large number of particles of colloidal sizes leads to the fact that phase separation is accompanied by the formation of a relatively loose interface. Moreover, the emerging oil is easily re-dispersed, passing into the aqueous phase. This easy formation of an emulsion lends support to the idea that the settled oil is a colloidal system made up of tiny oil droplets packed together in a dense pack that readily dissolves in water.
Figure 2 shows the rheological characteristics of oil taken from the BPS after the pump. Oil water cut is 42%. The oil contained a DF-70 demulsifier in the amount of 140 g/t of oil. At low shear rates, the viscometer readings were unstable. Accordingly, Figure 2 shows the minimum and maximum values, and the average values are calculated from them (see the solid line).

Figure 2: Dependence of viscosity on shear rate for oil taken from the
BPS after the pump. Note: Average value; ,  Minimum
and maximum measured values.
Minimum
and maximum measured values.
As a result of the redispersion effect, measuring the viscosity of an emulsion with a high demu
lsifier content is difficult [21-25]. The excess of the demulsifier, combined with the increased shear rate, leads to the destruction of droplet associates and/or crushing of large droplets, which increases the number density of particles and, consequently, the viscosity of the liquid. The situation is the opposite for the oil samples from the GMU. With an increase in the shear rate, droplets coalesce, the number density of particles decreases, and, accordingly, the viscosity of the liquid decreases. If the oil water cut and demulsifier consumption are not very high, this behaviour of viscosity can be preserved after BPS.
Dependence of viscosity on share rate
For an analytical description of the dependence of the viscosity μ on the shear rate G, we use the power-law model [26-28]:
μ =μo Gα……. (1)
Where μo, α are the model parameters, the values of which are shown in Figure 3. According to Figure 3, the power model can legitimately be used to determine field emulsions.

Figure 3: The dependence of viscosity on the shear rate in logarithmic
coordinates. Note: Oil sampled from the GMU;  Oil taken
from the BPS; Linear trend.
Oil taken
from the BPS; Linear trend.
For a pipeline, the shear rate on the wall G is determined from the condition that the friction force is equal to the pressure force [29-32]:
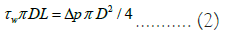
Where D, L are the inner diameter and length of the pipeline; Δp is the pressure drop; τw is the friction stress on the wall.
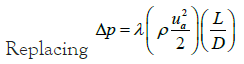
Where ua is the average flow velocity, ρ is the fluid density, τw=μG,
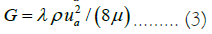
For the laminar flow regime 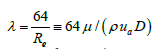 which after
substitution into (3) gives the following formula:
which after
substitution into (3) gives the following formula:
Where Re is Reynolds number, λ is pipe friction coefficient at laminar flow.
The same result is obtained by differentiating the parabolic velocity profile in a round pipe:
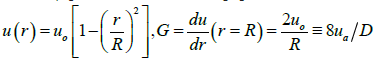
Where R=D/2, uo=2ua is the velocity on the pipe axis.
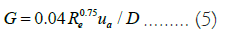
The shear rate (maximum at the walls) becomes so high with increasing flow velocity that the continuity of the medium is broken. There is a transition from laminar flow to turbulent flow. In the case of a developed turbulent flow regime,
λ=0.3164/Re0.25, which gives the shear rate:
For a non-Newtonian fluid, the viscosity included in the right side
of expression (5) through the Reynolds number itself depends on
the shear rate. Replacing the Reynolds number in equation (5)
with its expression  and solving the resulting
equation for G, we find:
and solving the resulting
equation for G, we find:
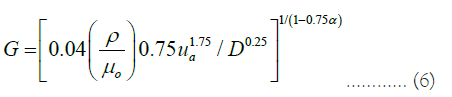
In turbulent flows, the viscosity, velocity profile, shear rate, and friction stress lose their original deterministic meaning due to the lack of continuity of the medium [33-36]. As deterministic equations can already describe the correlations between these random variables, such as equation (6), they should be interpreted as statistical estimates of the corresponding random variables.
The calculation of the pressure drop Δp required for pumping liquid from the BPS to the Preliminary Water Discharge Unit (PWDU) is performed by the formula
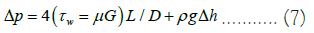
Where Δh is the height difference; g=9.8 m/s2; μ, G are determined by formulas (1), (4), (6). The values of the rheological model parameters are determined from the results of viscosity measurements, for example, using Excel (Figure 3).
Consider an oil gathering section consisting of a BPS with an OG-200 buffer tank connected to two TsNS-180–297 pumps, of which one is a standby one, and a pressure pipeline with a diameter D=0.25 m, a length L=14420 m and a height difference Δh=200 m. A total of 900 m3 of oil is pumped out per day with a water cut of 85%. Pumping is carried out automatically: The working pump turns on when the upper limit level is reached and turns off if the liquid level in the buffer tank drops to the lower limit level. In water, the density and viscosity are 1070 kg/m3 and 1.34 MPa.s, respectively; in oil, these values are 880 kg/m3 and 20 MPa.s, respectively.
The processing method
Characteristics of the pump-pipeline system are built as follows:
1. Oil water cut is set
2. The oil flow rate is set
3. The flow velocity is calculated
4. The shear rate on the wall is calculated using formula (4)
5. Viscosity is calculated according to formula (1)
6. The Reynolds number is calculated
7. If the Reynolds number is greater than 2320, then the shear rate and viscosity are recalculated using formulas (6) and (1)
8. The pressure loss in the pipeline is calculated according to the formula (7)
9. The pressure loss is recalculated in meters of water column (H=Δp/1000/9.8)
10. On the graph of pump variables head-flow, the corresponding point is placed on the curve of the pipeline
11. The shear rate in the pump is calculated (G=πn/30, where n is the rotation speed, rpm)
12. Viscosity is calculated according to the formula (1)
13. The coefficients of the influence of viscosity on the flow CQ and the pump head CH are determined according to the graph given in [37-40]. When working in Excel, it is more convenient to calculate the coefficient values using the following formulas:
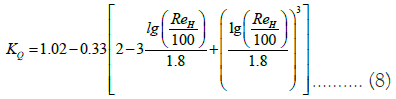
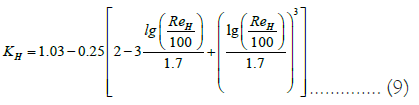
Where the Reynolds number of the pump is calculated by the formula
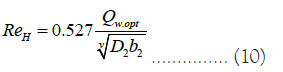
Where Qw.opt is the pump flow corresponding to the maximum efficiency (efficiency factor) when working on water; ν is the kinematic viscosity of the liquid; D2, b2 are the outer diameter and width of the impeller blades given in [41-44] (Table 1).
| Pump brand | Flow rate, m3/h | D2, mm | b2, mm |
|---|---|---|---|
| CFP 300 | 300 | 435 | 26 |
| CFP 180 | 180 | 360 | 19 |
| CFP 105 | 105 | 225 | 14 |
| CFP 60 | 60 | 176 | 14 |
Table 1: Pump characteristics.
14. Pump characteristics Q=CQ·Q and H=CH·H are calculated
15. On the graph of pump variables head-flow, the corresponding point is placed on the curve of the pipeline
16. Steps 2-15 are repeated for a new flow rate
As shown in Figure 4, the pump-pipeline system has the following characteristics. In the case of water and oil with a water cut of up to 30%, the pump characteristic is the same (see the upper curve). The intersection point of the A1 curves for the pump and pipeline determines the pumping mode. This mode of the BPS-the pipeline system is implemented with a well-established technology. With the optimal dosing of the demulsifier at remote GMU, during the time the liquid stays in the buffer tank of the BPS, it has time to break down without forming a significant volume of the intermediate layer. It is common for separated water to contain a significant amount of finely dispersed oil when there is a high water cut and a high consumption of demulsifiers [45-49]. At the same time, we have a rheology of the type that was presented in Figure 2. The ratio of circumferential speed to wheel radius can be used to estimate the shear rate in the pump.

Figure 4: Characteristics of the system centrifugal pump-pipeline.
For the rotation speed n=3000 rpm, we obtain the value G=(n/60) π D2/(D2/2)=π n/30 ≈ 300 s–1.
The viscosity value calculated by formula (1) is 42.127/300– 0.3224=0.265 Pa.s=265 mPa.s.
The pumping mode is shifted to point A2. In relation to the previous case, the pumping pressure increases slightly, and the pump flow drops sharply.
In the case that a demulsifier is not supplied, or supplied but poorly selected, or supplied and well selected, but its specific consumption is insufficient and does not ensure the destruction of well emulsions, we have rheology similar to that shown in Figure 1.
In this case, the pump curve is plotted for a viscosity of 2935/3000.3674=361 mPa.s. The pumping mode is shifted to point A3. As a result, pumping becomes impossible. This situation actually arises in the fields, for example, when the dispenser fails for a long time.
By implementing the new methodology of processing, the centrifugal pump-pipeline system characteristics were investigated in relation to emulsion rheological properties, and the following outcomes were obtained. Generally, small-diameter pipelines are the most effective in field practice for collecting pipelines since they guarantee a rapid viscosity reduction. Pressure pipelines, on the other hand, are generally constructed of pipes of increased diameter in order to have a low shear rate and, as a result, a low effective viscosity. In spite of their importance, technological aspects of the studied tasks are often overlooked when designing and operating field pipelines and BPS. It is therefore strongly recommended to consider these aspects in future studies.
Citation: Al Obaidi SH (2023) The Influence of Emulsion Rheology on Centrifugal Pump-Pipeline Systems in Hydrocarbon Fields. J Geol Geophys. 12:1123.
Received: 07-Jul-2023, Manuscript No. JGG-23-25423; Editor assigned: 10-Jul-2023, Pre QC No. JGG-23-25423 (PQ); Reviewed: 24-Jul-2023, QC No. JGG-23-25423; Revised: 31-Jul-2023, Manuscript No. JGG-23-25423 (R); Published: 07-Aug-2023 , DOI: 10.35248/2381-8719.23.12.1123
Copyright: © 2023 Al Obaidi SH. This is an open-access article distributed under the terms of the Creative Commons Attribution License, which permits unrestricted use, distribution, and reproduction in any medium, provided the original author and source are credited.