Cell & Developmental Biology
Open Access
ISSN: 2168-9296
ISSN: 2168-9296
Research Article - (2013) Volume 2, Issue 3
Procalcitonin mRNA is abundantly synthesized in the thyroid gland in mammals. In recent years, procalcitonin or its posttranslational product calcitonin, has been identified in numerous non-thyroidal adult tissues. Nevertheless, little is known about the implications of procalcitonin in development. We have previously discovered that chick embryo expresses procalcitonin in the developing floor plate and the dorsal rhombencephalon from the early stages of embryogenesis. This finding focused our attention on investigating whether procalcitonin is present in the nervous system of mammalian embryos. In a previous study by our laboratory, the central expression of calcitonin was not found in rat embryos when isotopic deoxyoligonucleotides were used as probes for in situ hybridization analyses. In this study, the expression of procalcitonin mRNA was detected in rat embryos from 11 to 18 days post-coitum when analyzed using techniques such as RT-PCR. In situ hybridization histochemistry with riboprobes revealed the expression of procalcitonin mRNA in the roof of the diencephalon from 12 to 16 days post-coitum and this expression was quantified by Ribonuclease Protection Assay technique. The immunohistochemical analysis confirmed the presence of the protein in this region and in the roof (velum medullare) of the rhombencephalon. Notably, numerous microglial cells were present in the developing diencephalon only during the period during which the expression of procalcitonin was detected. These findings suggest roles for procalcitonin not only in diencephalon development but also in the process of microglial colonization of the central nervous system.
<The Calcitonin (CT) gene is composed of six exons with two different polyadenylation sites, which are at the end of exons 4 and 6. This gene organization generates two tissue-specific mRNAs by alternative splicing: i) Procalcitonin (PCT) mRNA, which is mainly expressed in the C-cells of the thyroid gland [1,2]; and ii) ProCGRP (pro-calcitonin gene-related peptide) mRNA, which is present in the nervous system [3]. The product of these mRNAs are two precursor proteins, PCT and pro-CGRP, which generate CT and CGRP, respectively after posttranslational cleavage.
CT, a peptide of 32 amino acids, is a hypocalcemic hormone that is highly produced in the thyroid gland and inhibits osteoclastic bone resorption in response to high levels of calcium in the plasma [4,5]. There are other non-thyroidal tissues where CT is present. For instance, CT has been detected in the prostate, where it seems to act as a stimulatory growth factor and could be involved in the metastatic processes of this organ [6,7]. In the rodent uterus, at early stages of pregnancy, CT exerts its function in the surrounding tissues to accommodate blastocyst implantation [8-10]. In the Central Nervous System (CNS) CT is also present. Salmon CT-like immunoreactivity was detected in human and rat brain extracts [11,12], and the mRNA and protein of CT were also described in the rat pituitary gland, where CT could participate in silencing the prolactin gene and in regulating the proliferation of lactotrope cells [13-16].
Some studies suggest that CT plays a role, or roles, in vertebrate development. In amphibians, Burgess [17] described the existence of alterations during the gastrulation of Xenopus embryos that were treated with CT, which were explained by altered cellular adhesion. In birds, our laboratory discovered the expression of PCT mRNA in the CNS of chick embryos as early as stage 15 (approximately 2.5 days of incubation) and up to the last stages of embryonic development. The expression was circumscribed principally to some areas of the neural tube, which included the floor plate and the dorsal-lateral rhombencephalon [18]. In mammalian embryos, CT has been described in the thyroid glands of rat embryo from the 18th day postcoitum (E18) [19,20] and also in the brain of mouse embryo, from E14 to newborn and also in the adult life [21].
In the present study, we have analyzed whether mammals embryos express PCT in the developing CNS in a similar way as was observed in the chick. The fact that CT peptide does not cross the placental barrier [22] strongly suggests that mammalian embryos must synthesize this peptide for proper development. We used rat embryos from E11 to E18 to analyze the expression of PCT mRNA by RT-PCR, Ribonuclease Protection Assay and in situ hybridization with radioactive riboprobes. The results of the study show that PCT mRNA is expressed in discrete areas of the rat diencephalon from the E12 to E16 stages. The PCT protein was also detected in the same places with a specific antibody against the PCT pro-hormone, which confirmed the spatio-temporal pattern that was observed for its mRNA.
Embryos
Fifteen Wistar rats (Charles River Laboratory, Barcelona) were used in this study. Females and males were mated overnight and vaginal smears were examined the next morning. Day 0 of pregnancy (E0) corresponds to the day when the presence of sperm was detected. Rats were euthanized with CO2, and death was ensured by decapitation. Embryos from E11 to E18 were collected in PBS, dissected and frozen immediately at-80º C until RNA extraction. The adult thyroid gland from the mother was also recovered for use as a positive control. Housing and experimental procedures conform to the European Convention for the Protection of Vertebrate Animals used for Experimental and Other Scientific Purposes (Council Directive 86/609/EEC). The Animal Ethics Committee of the University of Zaragoza approved all procedures.
RNA extraction
Total RNA from the complete embryos (E11), the heads of embryos (E12-E17) and the encephalons of embryos (E18) were extracted using a QuickPrep Total RNA Extraction Kit (GE Healthcare Biosciences Life Sciences, Buckinghamshire, UK), according to the manufacturer’s instructions. The isolated RNA was incubated with DNase-I (Ambion, Austin, Texas, USA) to eliminate the genomic DNA, and the integrity of the RNA was checked by formaldehyde-agarose gel electrophoresis.
RT-PCR
The cDNA was synthesized from the total RNA, by reverse transcription with a SuperScript First-Strand Synthesis for RT-PCR kit (Invitrogen, Paisley, UK), according to the manufacturer’s instructions. Two PCR reactions were performed, one of them to amplify the cDNA of PCT (fragment of 398 bp) with primers rCT231U22 and rCT628L22 (Table 1), and the other one to amplify the cDNA of β-actin, as the internal standard (fragment of 232 bp), with primers T7rAct19U42 and T3rAct209L40 (Table 1). The PCR conditions were as follows: 1x PCR Reaction Buffer, 0.02 U/μL Platinum Taq DNA Polymerase (Invitrogen), 1 μL cDNA, 1.5 mM MgCl2, 0.2 mM of each deoxynucleotide triphosphate and 0.2 μM of each primer (for primer sequences Table 1). The amplification conditions were as follows: an initial denaturation step for 2 minutes at 94°C; 34 amplification cycles that included denaturation for 30 seconds at 94°C, 30 seconds of annealing step (for temperature Table 1), extension for 1 minute at 72°C; and a final extension for 10 minutes at 72ºC. Amplicons were analyzed by agarose gel electrophoresis, stained with ethidium bromide and visualized in a Gel Doc 1000 (Bio-Rad Laboratories, Hercules, CA, USA).
| Amplified Gene | Primer Names | 5’→3’ Sequences | Annealing Temperature (°C) | Product Length (bp) | GenBank Accession Number |
|---|---|---|---|---|---|
| Rat CT | rCT231U22 rCT628L22 |
F:AGTGAAGAAGAAGCTCGCCTAC R:TTTGCCTCATGAAAGTAACCCA |
56 | 398 | NM_017338 |
| Rat β-actin | T7rAct19U42 T3rAct209L40 |
F:GTAATACDACTCACTATAGGGCGCGAGTACAACCTCCTTGCA R:AATTAACCCTCACTAAAGGGATCACACCCTGGTGCCTAGG |
60 | 232 | NM_031144 |
| Rat β-actin | T7rAct19U42 T3rAct269L40 |
F:GTAATACDACTCACTATAGGGCGCGAGTACAACCTCCTTGCA R:AATTAACCCTCACTAAAGGGGATGCCTCTCTTGCTCTGGG |
62,5 | 293 | NM_031144 |
Table 1: Pairs of Primers used in this study: sequence, conditions, product size and GenBank accession number.
Sequencing
The PCR amplicon of PCT cDNA from the E18 encephalon mRNA was purified with a Microcon kit (Millipore, Bedford, MA, USA). The DNA fragment was sequenced with an ABI Prism Big Dye Terminator Cycle Sequencing Reaction kit (version 3.0). These reactions were analyzed by capillary electrophoresis in an automatic sequencer ABI Prism (model 3100; Applied Biosystems, CA, USA). The primers used for DNA sequencing were rCT231U22 and rCT628L22.
In situ hybridization (ISH)
Probe generation: A riboprobe specific against exon 4 of PCT mRNA was generated. Firstly, we prepared a DNA template by cloning into pBluescript II KS (Stratagene, La Jolla, CA, USA) the sequenced fragment of DNA, produced by RT-PCR with primers rCT231U22 and rCT628L22 (Table 1), this plasmid was named pBSCT; after this, the region of the plasmid containing exon 3 was removed by digestion/ excision of a 136 bp fragment with Bgl II and Eco RI, with posterior ligation, the new plasmid was named pBSCT4. The antisense probe was obtained by the in vitro transcription, using the T3 phage RNApolymerase promoter of digested pBSCT4, with the following reagents: 50 μCi of [α-32P]CTP (800 Ci/mmol, 20 μCi/μL (GE Healthcare Biosciences Life Sciences); 500 μM unlabeled ribonucleotides ATP, GTP, and UTP; RNase inhibitor (Roche, Mannheim, Germany); and 10 units of T3 RNA polymerase (Roche). The incubation was performed at 37º C for 1 h. The sense probe, which was used as a negative control of specificity, was generated in a similar in vitro transcription that used the T7 phage RNA-polymerase promoter and T7 RNA polymerase (Roche). Both riboprobes were treated with RNase-free DNase I (GE Healthcare Biosciences Life Sciences), phenol-extracted, and doubly purified, first, with a MicroSpin G-25 Column (GE Healthcare Biosciences Life Sciences), and second, by precipitation in 2 M ammonium acetate/75% ethanol.
Preparation of samples: Specimens (E11 rat embryos, E12-E17 heads and E18 brains) were fixed overnight in 4% paraformaldehyde/ PBS, washed in 0.5 M sucrose/PBS, and stored at –80º C until sectioning. Serial coronal and horizontal sections (14 μm thick) were obtained on a microtome cryostat (Microm HM 505 E), thaw-mounted onto gelatincoated slides, air-dried, and re-fixed by immersion for 30 minutes in 4% paraformaldehyde/PBS. Slides were then washed twice in PBS (5 minutes) and twice in water (30 seconds).
ISH protocol: ISH was performed using a modified protocol of the SureSite II System kit (Novagen, Madison, WI, USA). Slides were treated with 5 mM EDTA/50 mM Tris/1 μg/mL proteinase K (10 minutes), washed twice in water (30 seconds) and dipped in the equilibration solution (Novagen) (15 minutes) and, subsequently, in the prehybridization solution (Novagen) at 50ºC in a bath (2 hours). Labeled probes were added to the hybridization solution (Novagen), with a final specific activity of 2×10⁴ cpm/μL, and a total of 1.5-2×10⁶ cpm of this solution was added per slide; the incubation was performed for 16 hours under Nescofilm coverslides (Roth, Karlsruhe) in a humid chamber at 50º C. Then, sections were washed in SSC (2X, 30, min 50º C; 2X/RNase A (20 μg/ml), 30 min, 37ºC; 2X/formamide (1:1), 30 min, 50ºC; 1XSSC\sodium pyrophosphate (0.066%), 30 min, 50ºC. After washes, slides were dehydrated in ammonium acetate/ethanol. Finally, slides were exposed to a Kodak BioMax MR film or dipped into Hypercoat LM-1 emulsion (GE Healthcare Biosciences Life Sciences). Films and emulsions were developed in Kodak D-19, with times of exposure ranging from 3 to 20 days. Films were analyzed in a stereomicroscope (Wild Makroskop M420, Heerbrugg, Switzerland), and the images were acquired using a Nikon Coolpix 995 camera; the analysis and image processing of emulsions were made using dark-field microscopy in an Olympus BX60 microscope that was fitted with a DP-50 camera (Olympus, Hamburg, Germany). Undipped slides were stained with hematoxylin-eosin or basic toluidine blue according to standard procedures and were then dehydrated, mounted with Eukitt or DPX and examined under bright-field microscopy.
Ribonuclease Protection Assay (RPA)
RPA was used to quantify PCT mRNA levels in the complete embryo of E11, the head of E14, and the encephalon of E18. To synthesize a riboprobe against PCT RNA we used as DNA template the previously described plasmid pBSCT (Including exon 3 and 4). Antisense RNA probe was prepared by in vitro transcription using T3 phage RNApolymerase promoter; 250 ng of Not I-digested pBSCT; 50 μCi of [α-32P] CTP (800 Ci/mmol, 20 μCi/μL from GE Healthcare Biosciences Life Sciences); 500 μM unlabeled ribonucleotides ATP, GTP, and UTP; RNase inhibitor (Roche, Mannheim, Germany); and 10 units of T3 RNA polymerase (Roche) at 37º C for 1 h. A rat antisense ß-actin riboprobe was used as a housekeeping control, ß-actin template for this riboprobe was obtained by amplification of a DNA fragment from cDNA of E18 rat embryo using the pair of primers T7rAct19U42 and T3rAct269L40 (Table 1). Because ß-actin expression is very abundant, a low activity antisense riboprobe was synthesized using nucleotide CTP in a labeled:unlabeled ratio of 1:10,000. Both PCT and ß-actin riboprobes were treated with RNase-free DNase I (GE Healthcare Biosciences Life Sciences), phenol-extracted, doubly purified with a MicroSpin G-25 Column (GE Healthcare Biosciences Life Sciences), and precipitated in 2 M ammonium acetate/75% ethanol.
Hybridization with RNA and digestion of the riboprobes were performed with a RiboQuant Multi-Probe RNase Protection Assay System kit (PharMingen, San Diego, CA, USA): 2×10⁴ cpm of PCT probe and 400 cpm of ß-actin probe were hybridized overnight at 56º C with total RNA from each analyzed specimen; non-hybridized transcripts were digested for 45 minutes at 30º C with a RNase cocktail containing RNase A (0.4 ng/μl) and RNase T1 (1.25 U/μl). As a positive control, 5 μg of total RNA from adult rat thyroid were hybridized with 2×10⁴ cpm of PCT probe and processed as other samples. As negative controls, 20 μg of yeast tRNA were hybridized with 2×10⁴ cpm of PCT riboprobe and 400 cpm of ß-actin riboprobe.
Protected fragments (samples and controls) were separated in a 5% polyacrylamide 8 M urea gel. A radioactive DNA molecular-weight marker was prepared by end-labeling pBR322 (Hpa II digested) with [γ-32P] ATP (3000 Ci/mmol, 10 mCi/ml, GE Healthcare Biosciences Life Sciences) and T4 polynucleotide kinase (QBiogene, Carlsbad, CA, USA). The gel was dried in a Gel Dryer 583 (Bio-Rad Laboratories) and exposed to a Biomax MS film (Kodak) for 24 hours. The intensities of the bands were analyzed in a Gel Doc 1000 (Bio-Rad Laboratories) using Molecular Analyst software (Bio-Rad Laboratories). A standard curve was constructed for absolute quantification of PCT RNA expression. For this purpose, a sense PCT RNA fragment of 510 bp was generated in a standard in vitro transcription reaction using Hind III-linearized pBSCT and T7 phage RNA-polymerase. After accurate quantification of this transcript, four quantities (1520 fg, 1064 fg, 608 fg, and 152 fg) of this RNA were processed for RPA and the intensities of the bands were determined to construct a standard curve with these four points (Figure 3). Sample masses were obtained after extrapolation from the intensity/mass relationship and normalization with the corresponding ß-actin signal.
Immunohistochemistry
Immunohistochemistry was performed as follows: Fetuses were fixed overnight in Bouin’s fluid [23], washed in PBS, dehydrated, embedded in paraffin, and serially sectioned in coronal and sagittal orientations at 10 μm thick. Sections were rehydrated, and the endogenous peroxidase was blocked by incubating for 30 minutes in 1% hydrogen peroxide in PBS. Blocking was performed with 5% Normal Goat Serum (NGS) in PBST (PBS that contained 0.5% Triton X-100) for 30 minutes. Slides were incubated overnight at 4º C with a rabbit polyclonal antibody against human PCT (H66, ref.: sc-20725 from Santa Cruz Biotechnology, Santa Cruz, CA, USA) that was diluted (1:50) in PBST. After washes, slides were incubated with a goat anti-rabbit biotin conjugate antibody (Sigma, St. Louis, MO, USA), which was diluted 1:200 in 5% NGS/PBST, for 1 hour at room temperature. An avidin-biotin-peroxidase complex (Vectastain ABC kit from Vector Laboratories, Burlingame, CA, USA) was added, and the peroxidase activity was visualized with 3,3’-diaminobenzidine (Sigma), which was diluted (0.7 mg/ml) in 50 mM Tris-HCl (pH 7.4) that contained 0.0165% H2O2 for 20 minutes. Immunostained sections were dehydrated and coverslipped with DPX or Eukitt. The microscopic analysis and image processing were performed as described above. Experiments for control conditions included consecutive slides that were incubated with a primary antibody that was previously adsorbed with recombinant human PCT (Brahms, Berlin, Germany) in a ratio of 1:10 for antibody mass:antigen mass. Adult thyroids, which contained C-cells, were processed for immunohistochemistry using the anti-PCT antibody as a positive control.
A lectin from Bandeiraea simplicifolia was used (BS-I Isolectin B4 Biotin conjugated from Sigma, ref.: L2140) as a marker of microglial cells in embryonic brains. Adjacent sections to those sections that were immunostained for PCT were processed for lectin histochemistry. This processing was performed as described above for immunohistochemistry; however, the primary and secondary antibodies were replaced with lectin, which was diluted in PBS (1:50), and sections were slightly counterstained with hematoxylin.
The Identification of PCT Mrna in Rat Embryos by RT-PCR
The expression of PCT mRNA in embryos was initially determined by RT-PCR. The mRNAs of embryos at three stages were analyzed. The E11 (whole embryos), E14 (heads) and E18 (encephalons and spinal cords) stages were used. Primers rCT231U21 and rCT628L22 amplified a 398 bp fragment in all analyzed fractions, which presumably belonged to the PCT cDNA (Figure 1). To confirm this point, the amplification product from E18 encephalon was sequenced and found to be identical to the published sequence of rat PCT cDNA (GenBank accession number NM_017338). As an internal control, the cDNAs of all samples were amplified for β-actin, and all amplicons had similar band intensities, which indicated an adequate and comparable reverse transcription process (Figure 1).
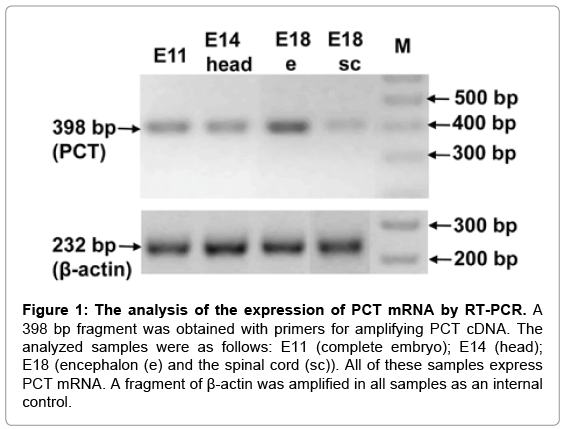
Figure 1: The analysis of the expression of PCT mRNA by RT-PCR. A 398 bp fragment was obtained with primers for amplifying PCT cDNA. The analyzed samples were as follows: E11 (complete embryo); E14 (head); E18 (encephalon (e) and the spinal cord (sc)). All of these samples express PCT mRNA. A fragment of β-actin was amplified in all samples as an internal control.
T??he Spatio-Temporal Analysis of the Expression of PCT Mrna by In Situ Hybridization
The spatio-temporal expression of PCT mRNA from E11 to E18 was analyzed by in situ hybridization using a radioactive riboprobe specific against exon 4 of PCT mRNA. Slides with adult rat thyroid glands, where PCT mRNA is highly expressed in C-cells, were used as controls, which displayed a strong signal when they were incubated with the antisense riboprobe (Figure 2M). A sense riboprobe, which was used as a negative control, did not hybridize with the thyroid gland slices (Figure 2N) or with the embryo tissues.
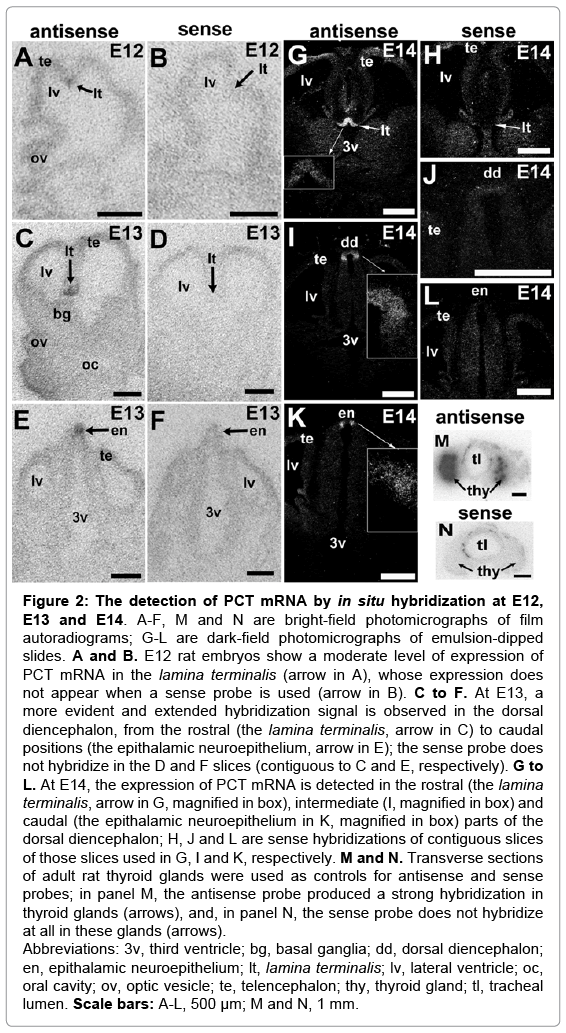
Figure 2: The detection of PCT mRNA by in situ hybridization at E12, E13 and E14. A-F, M and N are bright-field photomicrographs of film autoradiograms; G-L are dark-field photomicrographs of emulsion-dipped slides. A and B. E12 rat embryos show a moderate level of expression of PCT mRNA in the lamina terminalis (arrow in A), whose expression does not appear when a sense probe is used (arrow in B). C to F. At E13, a more evident and extended hybridization signal is observed in the dorsal diencephalon, from the rostral (the lamina terminalis, arrow in C) to caudal positions (the epithalamic neuroepithelium, arrow in E); the sense probe does not hybridize in the D and F slices (contiguous to C and E, respectively). G to L. At E14, the expression of PCT mRNA is detected in the rostral (the lamina terminalis, arrow in G, magnified in box), intermediate (I, magnified in box) and caudal (the epithalamic neuroepithelium in K, magnified in box) parts of the dorsal diencephalon; H, J and L are sense hybridizations of contiguous slices of those slices used in G, I and K, respectively. M and N. Transverse sections of adult rat thyroid glands were used as controls for antisense and sense probes; in panel M, the antisense probe produced a strong hybridization in thyroid glands (arrows), and, in panel N, the sense probe does not hybridize at all in these glands (arrows).
Abbreviations: 3v, third ventricle; bg, basal ganglia; dd, dorsal diencephalon; en, epithalamic neuroepithelium; lt, lamina terminalis; lv, lateral ventricle; oc, oral cavity; ov, optic vesicle; te, telencephalon; thy, thyroid gland; tl, tracheal lumen. Scale bars: A-L, 500 μm; M and N, 1 mm.
At E11, an excess of background prevented an acceptable resolution of the hybridization signal; however, the dorsal areas of the CNS still appeared more marked than the rest of the embryo. At E12, embryos displayed a weak reliable hybridization signal at the roof of the diencephalon (Figure 2A), only in the lamina terminalis. At E13, the signal was more intense and wider and appeared as a narrow band of reliable signal through the middle roof of the diencephalon that extended caudally from the lamina terminalis (Figure 2C) to the epithalamic neuroepithelium (Figure 2E). At E14, the expression of PCT mRNA remained in the roof of the diencephalon and was detected in rostral (lamina terminalis, Figure 2G), mid (Figure 2I), and caudal regions (epithalamic neuroepithelium, Figure 2K). Nevertheless, at E14, the expression of PCT mRNA began to decrease so that not all areas of the roof of the diencephalon expressed PCT mRNA as occurred at previous stages.
At E15 and E16, the abundance of PCT mRNA fell dramatically. At E15, a weak expression was only found in the most rostral and caudal regions of the diencephalic roof, and at E16 only a faint hybridization signal that flanked the primordium of the pineal gland was detected. Finally, no PCT mRNA was detected in the encephalon or spinal cord at E18.
Quantification of PCT mRNA by RPA
By ISH we determined that the presence of PCT mRNA in rat embryos was circumscribed to CNS, to quantify this transcript in the developing rat CNS, total RNA of the whole E11 embryo, the head of E14, and the encephalon of E18 was analyzed by RPA. RNAs were hybridized with PCT and β-actin anti-sense riboprobes and processed as described in the Materials and Methods section. The PCT riboprobe was 539 nucleotides (nt) long, 399 nt of which were complementary to PCT mRNA (i.e., the size of the protected fragment, as shown in Figure 3B); the ß-actin probe was 273 nt long, and 251 nt were protected (Figure 3C). In the three RNA samples analyzed, a protected band of 399-nt long, corresponding to PCT mRNA was observed (Figure 3B), thereby confirming the expression of PCT mRNA appreciated by RT-PCR in the whole E11, in the head of E14, and in the encephalon of E18. Quantification of the level of PCT expression was made by extrapolation in the standard curve generated and normalization with the intensities of ß-actin RNA protected bands, as it has been explained above. The amounts of mRNA obtained are shown in Table 2. PCT mRNA expression ranged from 75 to 172 attomoles per mg of total RNA analyzed, while an abundant gene, as ß-actin RNA, is about 72 femtomoles of mRNA per mg of total RNA (Ambion Technical Bulletin #151, 2007). PCT mRNA levels show a tendency to decrease as development advances. In some additional results obtained with RPA we observed the presence of PCT mRNA in the E11 mother’s uterus, and that expression increased sharply as gestation progresses; on the other hand, the lung of E18 embryos expressed similar quantities of PCT mRNA than the encephalon of the same stage; whereas in either the liver of E18, the placentas of E11, E14 and E18, or the muscleskeletal system of E14 and E18 it was not possible to see any signal of expression with this technique.
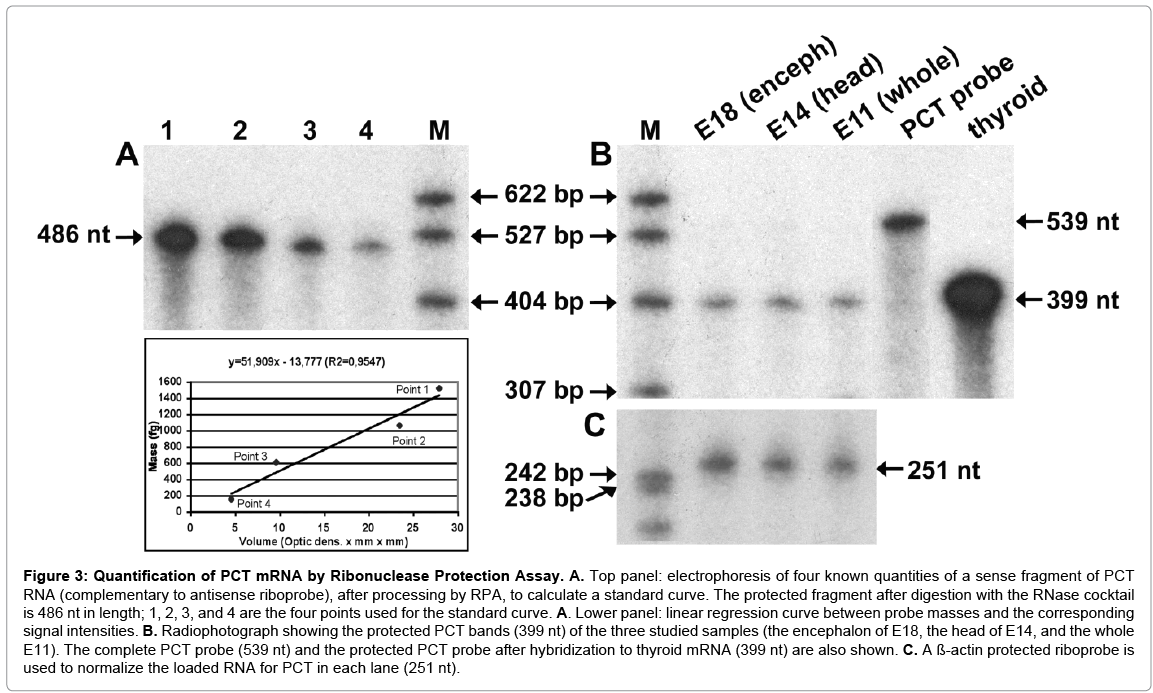
Figure 3: Quantification of PCT mRNA by Ribonuclease Protection Assay. A. Top panel: electrophoresis of four known quantities of a sense fragment of PCT RNA (complementary to antisense riboprobe), after processing by RPA, to calculate a standard curve. The protected fragment after digestion with the RNase cocktail is 486 nt in length; 1, 2, 3, and 4 are the four points used for the standard curve. A. Lower panel: linear regression curve between probe masses and the corresponding signal intensities. B. Radiophotograph showing the protected PCT bands (399 nt) of the three studied samples (the encephalon of E18, the head of E14, and the whole E11). The complete PCT probe (539 nt) and the protected PCT probe after hybridization to thyroid mRNA (399 nt) are also shown. C. A ß-actin protected riboprobe is used to normalize the loaded RNA for PCT in each lane (251 nt).
| Analyzed Sample | Total RNA Analyzed | PCT mRNA mass per mg of total RNA | Attomols of PCT mRNA per mg of total RNA |
|---|---|---|---|
| E11 (whole) | 15 µg | 59.5 pg | 172 attomols |
| E14 (head) | 20 µg | 41.5 pg | 120 attomols |
| E18 (encephalon) | 20 µg | 26.2 pg | 75 attomols |
Table 2: Quantities of PCT mRNA obtained by Ribonuclease Protection Assay.
The Immunohistochemical Analysis of the Expression of the PCT Protein
The expression of the PCT polypeptide was also determined by immunohistochemistry using the H66 anti-PCT antibody. Two areas of the developing encephalon from E11 to E14 showed immunoreactivity for PCT: (i) the lamina terminalis and adjacent medial telencephalon, which was in the same location where PCT mRNA was observed (Figure 4A, C, E, G, H, and I); (ii) in the neuroepithelial layer of the velum medullare of the rhombencephalon, which included the area that will generate the choroid plexus of the fourth ventricle (Figure 4B, D, E, F, J and K).
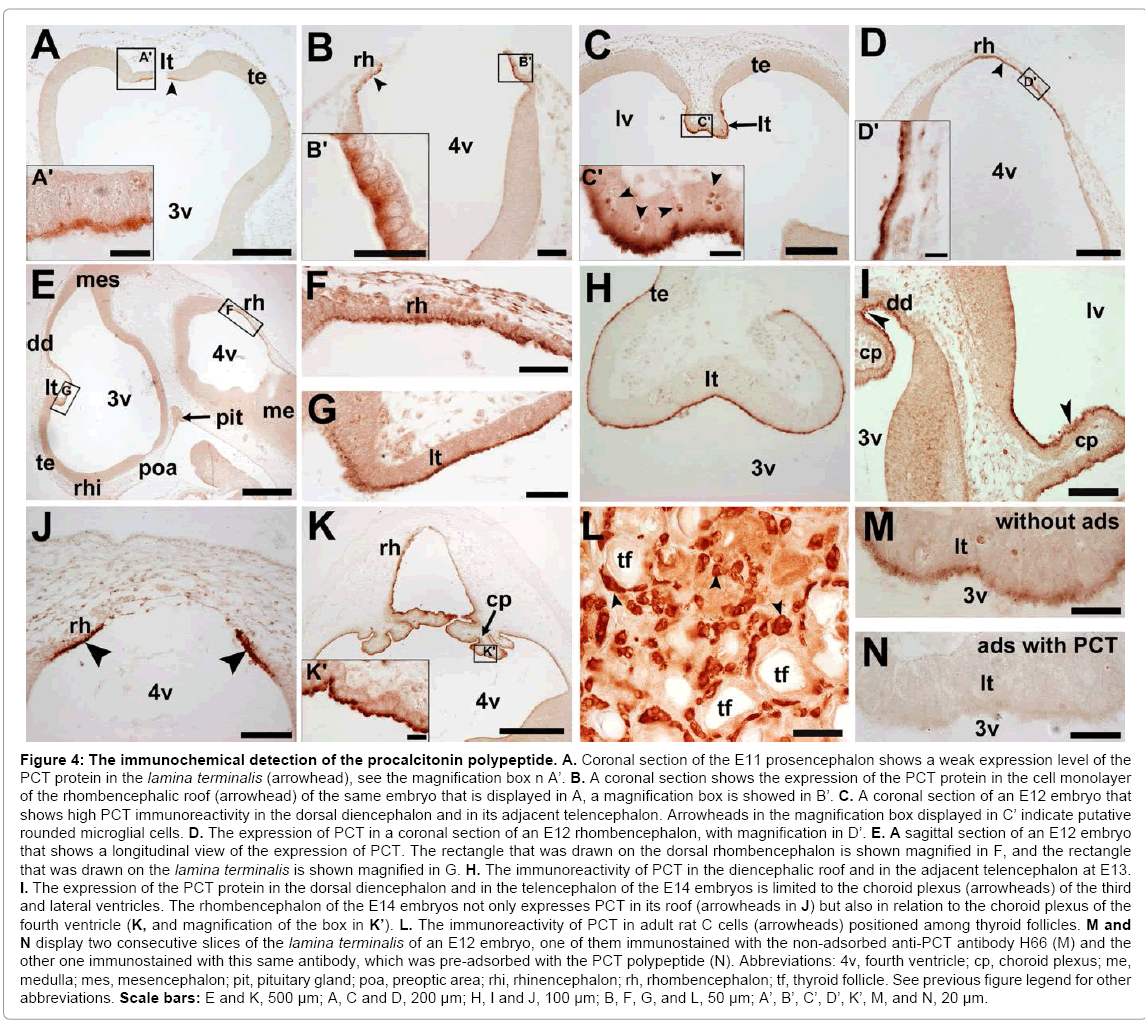
Figure 4: The immunochemical detection of the procalcitonin polypeptide. A. Coronal section of the E11 prosencephalon shows a weak expression level of the PCT protein in the lamina terminalis (arrowhead), see the magnification box n A’. B. A coronal section shows the expression of the PCT protein in the cell monolayer of the rhombencephalic roof (arrowhead) of the same embryo that is displayed in A, a magnification box is showed in B’. C. A coronal section of an E12 embryo that shows high PCT immunoreactivity in the dorsal diencephalon and in its adjacent telencephalon. Arrowheads in the magnification box displayed in C’ indicate putative rounded microglial cells. D. The expression of PCT in a coronal section of an E12 rhombencephalon, with magnification in D’. E. A sagittal section of an E12 embryo that shows a longitudinal view of the expression of PCT. The rectangle that was drawn on the dorsal rhombencephalon is shown magnified in F, and the rectangle that was drawn on the lamina terminalis is shown magnified in G. H. The immunoreactivity of PCT in the diencephalic roof and in the adjacent telencephalon at E13. I. The expression of the PCT protein in the dorsal diencephalon and in the telencephalon of the E14 embryos is limited to the choroid plexus (arrowheads) of the third and lateral ventricles. The rhombencephalon of the E14 embryos not only expresses PCT in its roof (arrowheads in J) but also in relation to the choroid plexus of the fourth ventricle (K, and magnification of the box in K’). L. The immunoreactivity of PCT in adult rat C cells (arrowheads) positioned among thyroid follicles. M and N display two consecutive slices of the lamina terminalis of an E12 embryo, one of them immunostained with the non-adsorbed anti-PCT antibody H66 (M) and the other one immunostained with this same antibody, which was pre-adsorbed with the PCT polypeptide (N). Abbreviations: 4v, fourth ventricle; cp, choroid plexus; me, medulla; mes, mesencephalon; pit, pituitary gland; poa, preoptic area; rhi, rhinencephalon; rh, rhombencephalon; tf, thyroid follicle. See previous figure legend for other abbreviations. Scale bars: E and K, 500 μm; A, C and D, 200 μm; H, I and J, 100 μm; B, F, G, and L, 50 μm; A’, B’, C’, D’, K’, M, and N, 20 μm.
At E11, when telencephalic vesicles start to differentiate from the prosencephalon, the lamina terminalis showed weak immunoreactivity without affecting its adjacent telencephalic neuroepithelium (Figure 4A). A similar immunoreactive intensity was found in the dorsal cellular monolayer of the rhombencephalon (Figure 4B). At E12 and E13, embryos exhibited stronger immunostaining, which affected the roof of the diencephalon and the contiguous telencephalon (Figure 4C and H). The expression patterns of the PCT protein in the rhombencephalon of E12 and E13 were similar to that observed at E11, as displayed in Figure 4D for an E12 embryo.
Consistent with the ISH findings, the E14 embryos showed a lower level of expression of the diencephalic PCT protein than in previous stages. A weak signal was evident in the lamina terminalis (data not shown) and in the developing choroid plexus area of the third and lateral ventricles (coronal section in Figure 4I). In the rhombencephalon, the PCT protein maintained the expression that was described for the previous stages (Figure 4J), which included the immunoreactivity in the choroid plexus of the fourth ventricle (Figure 4K). At stages E15, E16 and E18, the diencephalon and rhombencephalon did not show clear PCT immunoreactivity, in accordance with results that were obtained by ISH. The neural cell populations that expressed the PCT protein were always in the ventricular face of the neuroepithelia, and immunoreactivity was concentrated in the apical (ventricular) pole of the cells (Figure 4A, B, C, D, F, G, and K).
Notably, a characteristic population of rounded microglial cells, with pyknotic figures inside them, was in the diencephalic and adjacent telencephalic neuroepithelium (the lamina terminalis) of embryos at E11 to E14. B4 isolectin of Bandeiraea simplicifolia was used to identify microglial cells on slides of the dorsal diencephalon of E11, E12, E13, E14 and E16. A high concentration of rounded microglia was confirmed in the lamina terminalis from E11 to E14. microglial cells at E13 (Figure 5). This cellular location coincides with the expression of PCT in this area at these stages (Figure 5C). The expression of PCT disappears in the midline of the most rostral part of the lamina terminalis, precisely caudal to the septum (Figure 5F). In this area, there are numerous microglial cells (Figure 5E). Curiously, inclusions inside these cells were sometimes immunoreactive to PCT (Figure 4C’). In contrast, at E16, PCT is not expressed in the dorsal diencephalon (Figure 5H), and B4 isolectin only detects endothelial cells (Figure 5G). A spatio-temporal coincidence between the presence of numerous microglial cells (Figure 5A, B and E) and the expression of PCT in the lamina terminalis (Figure 5C, D and F) exists. Likewise, those microglial cells disappear when the expression of PCT drastically decreases from E15-E16 (Figure 5G and H).
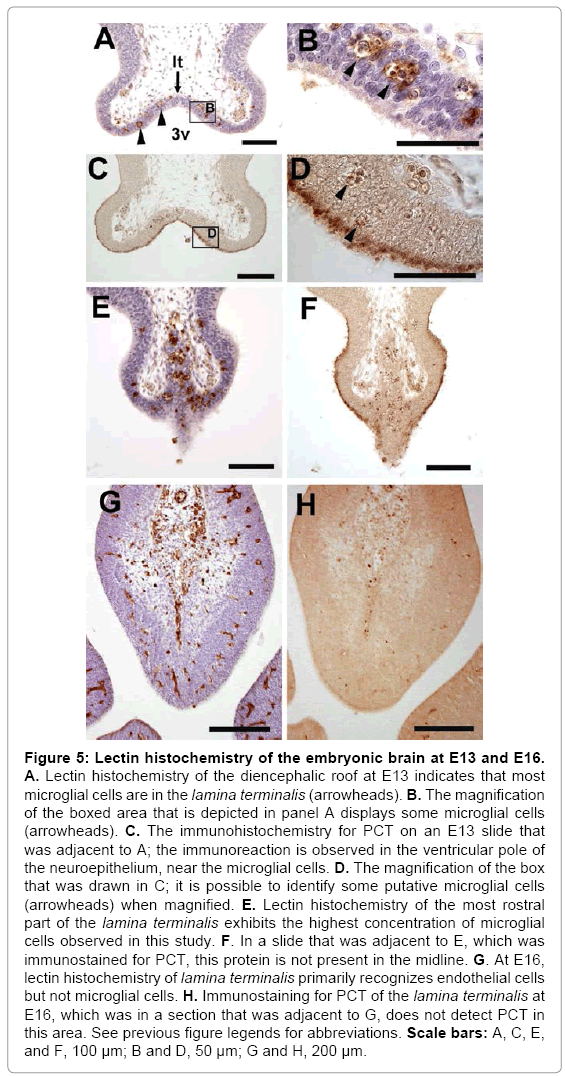
Figure 5: Lectin histochemistry of the embryonic brain at E13 and E16. A. Lectin histochemistry of the diencephalic roof at E13 indicates that most microglial cells are in the lamina terminalis (arrowheads). B. The magnification of the boxed area that is depicted in panel A displays some microglial cells (arrowheads). C. The immunohistochemistry for PCT on an E13 slide that was adjacent to A; the immunoreaction is observed in the ventricular pole of the neuroepithelium, near the microglial cells. D. The magnification of the box that was drawn in C; it is possible to identify some putative microglial cells (arrowheads) when magnified. E. Lectin histochemistry of the most rostral part of the lamina terminalis exhibits the highest concentration of microglial cells observed in this study. F. In a slide that was adjacent to E, which was immunostained for PCT, this protein is not present in the midline. G. At E16, lectin histochemistry of lamina terminalis primarily recognizes endothelial cells but not microglial cells. H. Immunostaining for PCT of the lamina terminalis at E16, which was in a section that was adjacent to G, does not detect PCT in this area. See previous figure legends for abbreviations. Scale bars: A, C, E, and F, 100 μm; B and D, 50 μm; G and H, 200 μm.
C cells of the thyroid gland of adult rats were used as a positive control for the PCT immunohistochemical technique (Figure 4L). To assess the specificity of the reaction, immunohistochemistry was also performed using an anti-PCT H66 antibody adsorbed with the recombinant human PCT polypeptide. Immunostaining of the lamina terminalis of E12 was thus prevented, thereby indicating the specificity of the immunoreaction (Figure 4M and N).
In this study, we investigated the expression of PCT mRNA and protein during the embryonic development of the CNS of the rat. The results of this study demonstrate for the first time that PCT is expressed in the CNS of rat embryos from E11 to E18. We used different techniques to determine the presence of PCT mRNA and protein. By RT-PCR, we analyzed three stages (E11, E14 and E18) and found that PCT mRNA was present in all of them, which indicated that the PCT gene was expressed during the analyzed period. By ISH, we studied the spatio-temporal pattern of PCT mRNA in the rat embryo during stages E11 to E18 and found that the PCT mRNA has its highest expression, in dorsal areas of diencephalon, from E11 to E14, been this expression weaker at E15-E16 and nonexistent in the brain of E18. The apparent discrepancy in the RNA expression as it was analyzed using the different techniques in our study can be explained by the fact that detection by ISH is only effective when expression is high in a specific area, while RT-PCR and RPA are able to detect the same amount of RNA even when it is distributed sparingly.
The quantification of PCT mRNA by RPA showed a progressive decrease in the amount of RNA across embryo development. The results showed that the level of PCT mRNA in the whole E11 was 1.43 times higher than in the E14 head, and it was 2.3 times higher than in the E18 encephalon. This trend in decreasing PCT mRNA expression in the CNS along rat embryo development is consistent with those obtained by ISH, where only in the earliest analyzed stages (from E12 to E14) we could achieve a specific, circumscribed signal of hybridization in the diencephalic roof, from the lamina terminalis to the epithalamic neuroepithelium. In this sense, Rezaeian et al. [21] also quantified levels of PCT mRNA in the brain of mouse embryo, by real-time PCR, with results very similar, both in the values of mass determination of PCT transcript and in the decrease of this expression along development of these rodent embryos, this coincidence of results, achieved by two techniques very different (RPA and real-time PCR), reinforces accuracy of the data.
The immunohistochemical study revealed that the PCT protein was present in the same areas where the mRNA expression was detected by ISH, primarily in the lamina terminalis and in the adjacent telencephalon of embryos from E11 to E14. Moreover, we also found the expression of the PCT polypeptide in the rhombencephalic roof (velum medullare), a finding that was not observed using ISH because the fine monocellular layer of velum medullare was lost during the sectioning process that was used for ISH (frozen embryos in a microtome cryostat).
The physiological relevance of the expression of PCT in the lamina terminalis and in the adjacent telencephalon might be related to development of telencephalic commissures. Perhaps PCT plays a role in the guidance of axons that cross to the opposite hemisphere, as Terrado et al. [1] proposed when they found a high level of expression of PCT in the floor plate of the brain stem and spinal cord of the chick embryo, which is an area of the neural tube that is also implicated in axon guidance. However, it remains to be determined whether PCT is a signaling molecule in the axon guidance process.
The expression of PCT in the ventricular pole of neuroepithelial cells in the roof of the diencephalon and rhombencephalon strongly suggests that PCT is secreted to the ventricular lumen, given that PCT is a protein that is synthesized in the secretory pathway. In contrast, the spatial and temporal coincidence between the expression of PCT in the lamina terminalis and numerous rounded microglial cells in the thickness of this area suggests that some mechanistic relation could exist between the presence of PCT and the development of microglia in such a developing brain area. This idea is supported by the fact that the mesoderm is the most likely origin of microglia [24], and precursors must enter the nervous parenchyma either from monocytes that leave the blood stream or from hematopoietic cells that reach the nervous parenchyma from the ventricles or from the meninges [25].
The observed PCT-immunostained inclusions inside the microglial cells of the lamina terminalis could also be a significant finding. These inclusions could most likely arise because of the phagocytic function of microglia in response to the production of cellular debris and cell death by apoptosis in this particular area [25-28].
Furthermore, Tolcos et al. [29] analyzed the expression of calcitonin receptors during rat embryogenesis and found that the isoform C1a is expressed at early stages (the same stages in which we have observed a high expression of PCT) in the neuroepithelium that outlines the ventricles at the level of the preoptic area, the hypothalamus, the pons, the medulla, and in the spinal cord. Thus, PCT, or its derived product calcitonin, after being secreted by neuroepithelial cells into the ventricular lumen, might reach the cells that express their receptors through the cerebrospinal fluid to carry out their currently unknown functions in the developing CNS.
In summary, our study shows for the first time that PCT is expressed in the developing CNS of rat embryos between E11 and E18 and that this expression is in the diencephalic and the rhombencephalic roofs. Further research is necessary to ascertain the role of PCT in mammalian CNS development.
The authors are grateful to Dr. Luis Dominguez (deceased) for his significant contributions to this article and for his generous support and to Dr. J. Struck from BRAHMS for providing a generous sample of the procalcitonin polypeptide.
Spanish Ministry of Science (PM99-0086 and SAF2003-08444-CO2-01 to MS); Government of Aragón, Spain (Group A09 to MS); Spanish Ministry of Education (pre-doctoral grant AP200-2126 to JC).