Journal of Biomedical Engineering and Medical Devices
Open Access
ISSN: 2475-7586
ISSN: 2475-7586
Research Article - (2022)Volume 7, Issue 9
The choice of activation functions is very important in deep learning. This is because activation functions are capable of capturing non- linear patterns in a data. The most popular activation function is the Rectified Linear Unit (ReLU) but it suffers from gradient vanishing problem. Therefore, we examined the modifications of the ReLU activation function to determine its effectiveness (accuracy) and efficiency (time complexity). The effectiveness and efficiency was verified by conducting an empirical experiment using x-ray images that contains pneumonia and normal samples. Our experiments show that the modified ReLU, ReLU6 performed better in terms of low generalization error (97.05% training accuracy and 78.21% test accuracy). The sensitivity analysis also suggests that the ELU is capable of correctly predicting more than half of the positive cases with 52.14% probability. For efficiency, the GELU shows the lowest training time when compared with other activation functions. This will allow practitioners in this field to choose activation functions based on effectiveness and efficiency.
Deep learning; Activation functions; ReLU; X-ray images
The role of activation functions in image classification problems cannot be overemphasized. This is because activation functions play a huge role in calculating the values for every activation in each layer [1]. Within the hidden layers, it accepts some input values, introduce some non-linear properties then produce an output node, which is passed to the next layer of the network as inputs. The non-linear properties introduced by the activation functions are capable of learning complex patterns in images, sounds, videos, and words/sentences [2]. Without these activation functions, the model is akin to a classical linear regression model which has limited power and does not perform well most of the times [3]. Some activation functions have been proposed but there is no designated one for a general case. The performance of the neural network could depend on the type of activation function and data type [4], number of dense layers, learning rate. Yet, one of the activation functions that have gained popularity in the deep learning field is the Rectified Linear Unit (ReLU).
Empirical studies have shown that the ReLU have proved to be the best per-forming activation functions in terms of convergence rate and faster learning [1,5]. Also, the ReLU solves the problem of vanishing gradient during back- propagation [6]. Going forward, the ReLU has its own limitations. For example, during the training stage, some gradients might die; hence the learning process will stop at that point [7]. To resuscitate these dead neurons, some modifications were made to the ReLU. Soric et al., applied three variations of the ReLU for a chest x-ray classification task [8]. Their results showed that the PReLU is an upgrade of the ReLU.
For this work, we will consider other variants of the ReLU activation function. We will also evaluate their performances in terms of their generalization error (training and test errors). In addition, their training execution times will be monitored for comparison as well. The rest of the paper is structured as follows, section 2, we will examine the Convolution Neural Network (CNN) architecture used for this paper. Section 3 is dedication to the variations of the ReLU activation functions we used. In section 4, the different regularization we used to reduce the effect of overfitting. We will also discuss some of the evaluation metrics in section 5. Lastly, section 6 is reserved for summary, conclusion, and further improvements to the work if any. In a deep neural network, several activation functions have been proposed by different authors. Some of these activation functions have trainable parameters while some are fixed [9].
Due to the drawbacks of the ReLU activation function, two novel activation functions were proposed based on approximation of the maximum function [9], namely the Smooth Maximum Unit (SMU and SMU-1). The experiment was done using the CIFAR100 dataset with ShuffleNet V2, PreActResNet-50, ResNet-50, and SeNet-50 models respectively. Their results showed a signifi- cant improvement on the classification accuracy using the proposed activation functions when compared with the ReLU and its variants.
The influence of the activation function in brain tumor type classification was examined by [10]. A new activation function called parametric scaled hyperbolic tangent (PSTanh) was compared with eight standard activation functions namely, tanh, ReLU, Leaky-ReLU, PReLU, ELU, SELU, Swish, ReLU-Memrister-Like Activation Function (RMAF).The experiments were conducted using MNIST, fashion-MNIST, CIFAR-10, CIFAR-100, and ImageNet datasets trained on CapsNets models and deep CNN models (i.e., AlexNet, SqueezeNet, ResNet50, and DenseNet121). The proposed PSTanh activation achieved better performance than other functions.
Farheen et al., compared the Swish activation function with Adaptive Piecewise Linear unit to get a broader understanding of the role of activation function and its importance in image classification [11]. The dataset used for the work is the Skin cancer MNIST: HAM10000. The Swish activation function showed to perform better than the Adaptive Piecewise Linear unit in terms of classification accuracy.
Soric et al., applied the CNN to classify Chest X-ray images [8]. They used the ReLU activation function and its variants, Leaky ReLU and PReLU. The hyperparameter of the Leaky ReLU was set to 0.3 and 30 respectively. But the model showed to have achieved better accuracy using the PReLU activation function.
Experimental setup
The platform of this experiment: the operating system is MacBook Pro (13- inch, 2020, Four Thunderbolt 3 ports); the processor model is 2 GHz Quad- Core Intel Core i5, the graphics card model is Intel Iris Plus Graphics 1536 MB; the memory size is 16 GB 3733 MHz LPDDR4X; the Python version is 3.7; the Pytorch version is 1.11.
Training process
The training process involves several hyper-parameters such as the number of epochs, batch size, learning rate and the optimization algorithm. For our work, we trained our model with a batch size of 32 for 12 epochs. For optimization process, we applied the Adam stochastic optimization algorithm with a learning rate of 0.01. These processes were used for each activation function.
Data
The data was collected from Kaggle repository. It consists of two categories of X-Ray images (Pneumonia/Normal). The dataset is organized into 3 folders (train, test, val) and contains subfolders for each image category (Pneumo- nia/Normal). The training set contains 3876 images of pneumonia and 1342 healthy images while the validation and test sets contains 624 and 18 of both healthy and pneumonia images respectively. Chest X-ray images (anterior- posterior) were selected from retrospective cohorts of pediatric patients of one to five years old from Guangzhou Women and Children’s Medical Center, Guangzhou.
Convolution
Convolution is mathematical operation that is applied to an input image to filter the information and produce a feature map [12]. This filter is also called a kernel, or feature detector, and its dimensions can be, for example, (Figure 1).

Figure 1: Our proposed CNN architecture.
3 × 3 to perform convolution, the kernel goes over the input image, doing matrix multiplication element after element. For three channels, we calculate the convolution for each colour (Red, Blue, Green), then sum them up. Mathematically speaking, the convolution is a linear operation defined as:
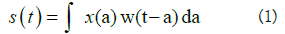
Eq. 1 can be re-written as:

Where the first term is the input, the second term is called the kernel and * is the convolution operation.
Kernel
A Kernel is a filter that is used to extract the features from the images [13]. It is a matrix that moves over the input data, performs the dot product with the sub-region of input data, and gets the output as the matrix of dot products. Figure 2 shows the convolution operation of a 6 × 6 image with a kernel size of 3. Our input data contains resized images of 180 × 180 with three channels (R, B, G). Hence, to extract features from the chest X-ray images, we applied kernel with a size of 3. The output of the projected map is given below, only if we considered the kernel size only:

Figure 2: Convolution operation with a kernel size of 3.
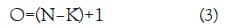
Where N is the image size, K is the kernel size and O is the output size (Figure 2).
Stride
Suppose we have a 6 × 6 input image as shown in Figure 3, if we apply the default stride of 1 in the convolution operation, we have a 4 × 4 output only. What if we increase the stride to 2, then we have a 2 × 2 output only. Hence, stride provides extra opportunity to reduce the number of parameters in image classification task [14]. The filter is moved across the image left to right, top to bottom, with a one-pixel column change on the horizontal movements, then a one-pixel change on the vertical movements. The output size of an image can be formalized mathematically below for a given stride size:

Figure 3: Convolution operation with stride of 1 and 2 respectively.
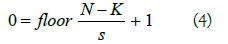
Where N is the image size, K is the filter size, S is the stride size.
Padding
During the striding process, some important features in the images especially at the edges and corners might not be captured. To overcome this problem, we apply zero padding at the border of the images. This helps to preserve the information at the borders by bringing them to the middle of the padded image. We can extend eq. 4 with the equation below, if we consider the zero-padding.
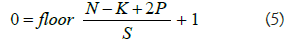
Where N is the image size, K is the filter size, S is the stride size and P is the number of the layers of the zero-padding.
Pooling
Pooling is a dimension technique used in CNN to reduce the dimensions of the feature maps. Thus, it reduces the number of parameters to learn and hence increasing the computational efficiency in the network (Figures 3 and 4).

Figure 4: Convolution operation with P=1 and S=1.
Two common pooling techniques are average pooling and max pooling that summarizes the average presence of a feature and the most activated presence of a feature respectively. The most commonly used method in CNN is the max pooling with size of 2 × 2, [14]. The choice of max-pooling is because it helps in extracting low-level features like edges, points [15]. Therefore, we applied a max-pooling of size, 2 × 2 for the chest x-ray image classification task. The output size with max-pooling (2 × 2) is given by:
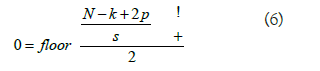
Where N is the image size, K is the filter size, S is the stride size and P is the number of the layers of the zero-padding (Figure 5).

Figure 5: Convolution operation with pooling size of 2 × 2.
Fully connected layer
The output from the final (and any) pooling and convolutional layer is flattened and then fed into the fully connected layer as described in Figure 6. After passing through the fully connected layers, the final layer uses the softmax activation function which is used to get probabilities of the input being in a particular class (classification) (Figure 6).

Figure 6: Fully connected layer.
It is also note-worthy that we added the batch normalization and dropout layers in the CNN architecture. The batch normalization is a regularization technique that helps to prevent overfitting [16]. This process is important because it improves the speed, performance, and stability of training. It does this by normalizing each layer’s inputs by squashing the values to a zero mean and unit variance in the current batch. Dropout layer was also implemented per-layer in the network. During training 50% of the layer outputs were randomly ignored (dropped out), this helps prevent overfitting as well (Table 1).
| Layer | Layer name | Layer properties |
|---|---|---|
| 1 | Image Input | 180 × 180 × 3 images with ’zerocenter’ normalization |
| 2 | Convolution | Input size=3, output feature size=16, kernel size=3, stride=1, padding=1 |
| 3 | Batch Normalization | Batch normalization, 16 |
| 4 | ReLU or its variants | ReLU or its variants |
| 5 | Max Pooling | 2 × 2 max pooling with stride [2 2] and zero-padding. Output size =16 × 90 × 90 |
| 6 | Drop-out | Drop-out (0.5) |
| 7 | Convolution | Input size=16, output feature size=16, kernel size=3, stride=1, padding=1 |
| 8 | Batch Normalization | Batch normalization, 16 |
| 9 | ReLU or its variants | ReLU or its variants |
| 10 | Max Pooling | 2 × 2 max pooling with stride [2 2] and zero-padding. Output size =16 × 45 × 45 |
| 11 | Drop-out | Drop-out (0.5) |
| 12 | Convolution | Input size=16, output feature size=16, kernel size=3, stride=1, padding=1 |
| 13 | Batch Normalization | Batch normalization, 16 |
| 14 | ReLU or its variants | ReLU or its variants |
| 15 | Max Pooling | 2 × 2 max pooling with stride [2 2] and zero-padding. Output size =16 × 22 × 22 |
| 16 | Dropout | Dropout (0.5) |
| 17 | Fully Connected | 7744 fully connected layer |
| 18 | Softmax | SoftMax |
| 19 | Classification Output | Crossentropy |
Table 1: The manually designed CNN architecture.
Activation functions
At the activation layer, we apply a set of activation functions which we used for this work. Let us assume we have an activation function acting on a set of weight matrix, input vectors and bias terms as showed below (Figure 7).

Figure 7: Activation function acting on the input, weight, and bias matrices.
The Rectified Linear Unit (ReLU) is one of the most widely used activation functions proposed by [17]. It solves the vanishing gradient problem exhibited by the tanh and sigmoid activation functions [18]. Also, its overall computation speed makes it better than the sigmoid function. The ReLU activation function is given by:

One of the drawbacks of ReLU is that it is sometimes fragile during training, thereby causing some of the gradients to die during training [19]. This causes the weight update not to be activated because of the dead neurons [20]. To fix this problem, some modifications were made which resulted to some of the vari- ants of the ReLU activation function. These activation functions include: Leaky ReLU [21], SELU [22], PReLU [23], GELU [24], ELU [25], RReLU [26], CELU [27] and RELU6 [28].
In Table 2, on training set, we can observe that the GELU has the best traning accuracy but with a lower test accuracy. It indicates that GELU may suffer from severe overfitting issue. We also observe that RELU6 has the best test accuracy when compared with other activation functions. This means, it has the capacity to predict unseen data. On the execution time, the GELU showed superiority in terms of completion time followed by PReLU. The Leaky ReLU did not perform well in terms of efficiency (Table 2).
| Activation function | Training accuracy | Test accuracy | Training loss | Test loss | Execution time (seconds) |
|---|---|---|---|---|---|
| ReLU | 0.9747 | 0.7772 | 0.1036 | 0.5647 | 3184.74 |
| Leaky ReLU | 0.9757 | 0.7115 | 0.0588 | 1.3752 | 4317.64 |
| SELU | 0.9603 | 0.6907 | 0.1049 | 1.6662 | 3314.29 |
| PReLU | 0.9791 | 0.7099 | 0.0576 | 1.1298 | 1917.75 |
| GELU | 0.984 | 0.7644 | 0.0545 | 1.0716 | 1897.99 |
| ELU | 0.9755 | 0.7244 | 0.0672 | 1.6081 | 2747.24 |
| RReLU | 0.9739 | 0.7404 | 0.0628 | 1.0027 | 2154.24 |
| CELU | 0.9762 | 0.7644 | 0.063 | 0.9922 | 2609.3 |
| ReLU6 | 0.9705 | 0.781 | 0.0844 | 0.9527 | 2828.26 |
Table 2: Accuracy, loss and estimation times for the different activation functions.
In terms of being able to predict correctly true positives and negatives, we considered the sensitivity and specificity measures as displayed in Table 3. As seen in the table, the ELU activation function has the largest sensitivity value of 52.14%, which means it was able to predict more than half of the pneumonia images correctly. With the SELU activation function, all the healthy images were correctly predicted, but performed pooly in predicting the unhealthy patients. We expect to predict correctly the number of positive cases to a certain degree of accuracy because if our model fails to predict unhealthy cases correctly and treated, the resultant effect is that it could lead to early death (Table 3).
| Activation function | Sensitivity | Specificity |
|---|---|---|
| ReLU | 0.4487 | 0.9744 |
| Leaky ReLU(0.1) | 0.2393 | 0.9949 |
| SELU | 0.1752 | 1 |
| PReLU | 0.235 | 0.9949 |
| GELU | 0.3889 | 0.9897 |
| ELU | 0.5214 | 0.9795 |
| RReLU | 0.3162 | 0.9949 |
| CELU | 0.4017 | 0.9821 |
| ReLU6 | 0.4487 | 0.9821 |
Table 3: Sensivity and specificity values for the different activation functions.
In this paper, we analyzed nine rectified activation functions. We also compared their performances in terms of efficiency. Our findings suggest that ReLU6 outperformed other activation functions in terms of test accuracy. We also observed that the GELU had the lowest execution time.
Therefore, future work should be geared towards increasing the test accuracy scores. This can be done by tuning several hyperparameters. For example, in terms of the CNN architecture, we can either increase or decrease the number of hidden layers compared with the one we used. At the training stage, we could change our batch size and number of epochs. Lastly, at the optimization stage, we can try other optimizers while fine-tuning their learning rates.
We declare that the authors have no competing interests.
The authors contributed equally in this work.
[Crossref][Google Scholar][PubMed].
[Crossref][Google Scholar][PubMed].
Citation: Nworu CC, Ekpenyong JE, Chisimkwuo J, Okwara G, Agwu OJ, Onyeukwu NC (2022) The Effects of Modified ReLU Activation Functions in Image Classification. J Biomed Eng Med Dev.7:237.
Received: 26-Sep-2022, Manuscript No. BEMD-22-19368; Editor assigned: 29-Sep-2022, Pre QC No. BEMD-22-19368; Reviewed: 13-Oct-2022, QC No. BEMD-22-19368; Revised: 20-Oct-2022, Manuscript No. BEMD-22-19368; Published: 27-Oct-2022 , DOI: 10.35248/2475-7586.22.07.237
Copyright: © 2022 Nworu CC, et al. This is an open-access article distributed under the terms of the Creative Commons Attribution License, which permits unrestricted use, distribution, and reproduction in any medium, provided the original author and source are credited.
Competing interests: The authors have declared that no competing interests exist.