Gynecology & Obstetrics
Open Access
ISSN: 2161-0932
ISSN: 2161-0932
Research Article - (2015) Volume 5, Issue 2
Objective: This study was conducted to assess the social-demographic characteristic and the effect of maternal fasting serum lipids between trimesters and its effect on maternal blood pressure and fetal birth weight.
Materials and methods: A prospective cohort study was designed for recruiting pregnant women who were in their 1st trimester at a primary maternal child health center (KKIA). The study involved taking fasting serum lipids (FSL), blood pressure (BP) measuring and urine albumin in every trimester.
Results: Fasting serum triglyceride (TG), low density lipoprotein (LDL), high density lipoprotein (HDL) and total cholesterol (TC) were significantly (p<0.05) increased as the gestational age increased. There were no significant changes in blood pressure and urine albumin throughout the pregnancy. Serum lipid did not statistically influence the birth weight (P=0.922). Meanwhile serum triglyceride level was double (4.5 mmol/L) in one patient who developed eclampsia
Conclusion: Serum lipid increase in parallel to increase in gestational age however it does not influenced the maternal blood pressure and birth weight. Further study with larger sample size is required to confirm the factors associated with PE.
Keywords: Maternal fasting serum lipids; Normal pregnancy; Pregnancy induce hypertension; Pre-eclampsia
Hypertensive disease in pregnancy is one of the major health problems in pregnant women. It is one of the leading causes of perinatal morbidity and mortality. PE has an incident rate of 5-10% worldwide [1]. In our tertiary centre, an incidence rate of 5-7% has been noted [2]. Among 567 patients admitted in year 2012, 32 (5.6%) of them were PE and 14 (0.1%) cases of eclampsia.
Although little is known about its etiology, evidences indicate a disturbance in normal endothelial cell function could be the primary starting point in the pathogenesis of PE and studies found an association of abnormal serum lipids with PE [3-6]. Plasma serum lipid has been found to increase during normal pregnancy could be related to elevation in certain hormones, such as estrogen, progesterone and human placenta lactogen [7,8]. During pregnancy, maternal TC and TG concentrations increase mainly during second and third trimesters. A PE patient experiences higher elevations in lipids, especially serum TG compared to normotensive pregnant women [9].
We conducted the present study to find out the incidence and associated risk factors for PE in local health set up. Our objective was to investigate the relationship between serum lipid profiles in each trimester with fetal birth weight and maternal blood pressure.
We conducted this prospective cohort study at KKIA Jalan Gambut, Kuantan, Pahang between 1st February 2013 and 31st January 2014. Study population included all pregnant women who came for antenatal check up during the study period. They were screened by the KKIA staffs and given appointment, if they fulfill the inclusion criteria. All patients were consented prior this study, and information leaflets regarding the objective and aim of this study were also distributed. Women with underlying medical illness, such as familial hypercholesteronaemia, essential hypertension, diabetic complicating pregnancy, multiple pregnancy, connective tissue diseases and heart diseases, were excluded from this study. Women who refused to participate in this study were also excluded.
The estimated sample size was 146 based on the local prevalence of PE (5%), confidence interval (CI) of 95% (standard value of 1.96) and error of margin of 5% (standard value of 0.05). Due to, we only recruit in one center so the design effect of the study normally set at 2. The formula used was
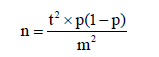
Where:
n = required sample size (times 2 because the recruitment involved only one center).
t = confidence level at 95% (standard value of 1.96).
p = estimated prevalence of PE in the project area at 5% (0.05).
m = margin of error at 5% (standard value of 0.05).
First visit was scheduled in between 10th and 12th week after amenorrhea (POA). During this visit, patient’s demographic data and brief history were taken. Blood pressure was measured manually using sphygmomanometer. FSL, fasting blood sugar (FBS), renal profile, urine for protein and ultrasonography (USG) were performed for fetal growth. Subsequent visits were scheduled at 22-26 weeks and 32-36 weeks POA. The same investigation and examination were repeated during each visit except for FBS and renal profile. Follow-up was discontinued once subject had miscarriage. Figure 1 describes the complete process in a flow chart.

Figure 1: Study Flow Chart.
Data analyses were performed with Statistical Package for the Social Sciences (SPSS) version 17. Citation manager Endnote X6 was used for citation management.
Basic descriptive statistics and frequency calculations were performed on all the variables. Apart from mean, standard deviation, percentage, Pearson’s Chi-square test and simple regression test was also performed. P values of <0.05 were considered statistical.
Among 532 pregnant women visiting the center during the study period, only 123 were eligible and agreed to participate in the study. Most of them would like to continue their antenatal care at their own hometown and were not keen for blood sampling. Majority of the pregnant women visited KKIA were Malays and with low parity (Table 1). The mean age was 28 ± 4 years. The mean booking body mass index (BMI) was 23 ± 4.3 kg/m2. Most of the babies were delivered at term (87.9%) with normal birth weight (85.7%).
| N= 123 | Mean | SD | |
| Age (years) | 28 | 4 | |
| BMI (kg/m²) | 23.0 | 4.3 | |
| N= 91 | Freq | % | |
| Gestational Age(Weeks) | <37 | 13 | 14.3 |
| ≥37 | 78 | 85.7 | |
| Birth weight (kg) (N=91) | <2.5 | 10 | 11.0 |
| 2.5-3.9 >4.0 |
80 1 |
87.9 1.1 |
|
| Race | Malay | 87 | 70.7 |
| Chinese | 24 | 19.5 | |
| Indian | 5 | 4.1 | |
| Others | 7 | 5.7 | |
| Parity | 0 | 67 | 54.5 |
| 1 | 29 | 23.6 | |
| 2 | 17 | 13.8 | |
| 3 | 6 | 4.8 | |
| 4 | 4 | 3.3 | |
Table 1: Socio-Demographic characteristics of respondents.
After the first visit, 13 women experienced miscarriage, 19 were dropout due to various reasons, e.g. defaulted, migrate to other states and refuse to participate after one or two visits. Fasting serum lipid of women who aborted was within the expected value. One patient developed PE at 25 weeks POA, subsequently progress to eclampsia and delivered prematurely at same POA.
Only two women developed proteinuria during third trimester; however, the result is not statistically different (p >0.05) as shown in Table 2. There is no statistically significant difference in systolic and diastolic blood pressures measured at each trimester, except for one female (1.09%) who developed PE at 25 weeks POA (Table 3). As evident from Table 4, all components of FSL (TC, HDL, LDL and TG) were significantly raised throughout pregnancy.
| 1st trimester | 2nd trimester | 3rd trimester | P value | ||||
| N=123 | (%) | N=91 | ( %) | N=90 | (%) | ||
| Nil | 107 | (87.0) | 80 | (87.9) | 80 | (88.9) | >0.05 |
| Trace | 13 | (10.6) | 8 | (8.8) | 8 | (8.9) | |
| 1+ | 3 | (2.4) | 1 | (1.1) | 1 | (1.1) | |
| >1+ | 0 | (0.0) | 2 | (2.2) | 1 | (1.1) | |
Table 2: Urine albumin in each trimester.
| 1st trimester | 2nd trimester | 3rd trimester | P value | ||||
| Mean | (SD) | Mean | ( SD) | Mean | ( SD) | ||
| SBP*(mmHg) | 119 | (8) | 120 | (7) | 121 | (5) | P=0.27 |
| DBP*(mmHg) | 78 | (6) | 79 | (5) | 81 | (4) | P=0.005 |
Table 3: Mean systolic and diastolic blood pressure in each trimester.
| Trimester | 1st Mean (SD) | 2nd Mean(SD) | 3rd Mean(SD) | p |
| Study group TC (mmol/L) TG (mmol/L) LDL (mmol/L) HDL (mmol/L) |
5.0 (0.8) 1.2 (0.5) 2.8 (0.6) 1.7 (0.4) |
6.3 (0.9) 2.1 (0.7) 3.7 (1.0) 2.0 (0.1) |
7.4 (1.0) 3.0 (1.0) 4.2 (1.0) 2.1 (0.4) |
<0.001 <0.001 <0.001 <0.001 |
| Marzurkiewicz et al TC (mmol/L) TG (mmol/L) LDL (mmol/L) HDL (mmol/L) |
5.5 1.4 3.2 1.7 |
6.2 2.0 3.3 2.0 |
7.1 2.5 4.0 1.9 |
Table 4: Maternal lipid profile in each trimester.
Figure 2 shows the changes in the FSL component in each trimester. The components of FSL shows increasing trend in each trimester. The most prominent changes were observed for TC, with total increment of 2.4 mmol/L followed by TG (1.8 mmol/L) then LDL (1.4 mmol/L). There was minimal increment in HDL level (0.4 hmmol/L) throughout pregnancy.

Figure 2: Maternal serum lipid between trimesters. Values are presented as mean ± SD.
Only one patient (1.09%) developed PE at 25 weeks POA and subsequently progress to eclampsia and delivered a 750 gram bay girl via caesarean section. This was her first pregnancy with maternal weight of 63.5 kg (BMI = 26.8 kg/m2). FSL was taken when she was diagnosed with PE at second trimester. Serum TG increased significantly compared to the mean of the normotensive women at second trimester. However, other component of FSL namely TC, HDL and LDL did not show such changes (Table 5).
| Patient | Normal | |
| TC (mmol/L) TG(mmol/L) LDL(mmol/L) HDL(mmol/L) |
6.2 4.5 3.1 1.3 |
6.3 2.1 3.7 2.0 |
Table 5: Fasting Lipid of patient with PE at second trimester.
There was no significant association between baby’s birth weight and all component of FSL during each trimester (Table 6). The ANOVA test indicates that regression model was not statistically significant to predict fetal weight (P=0.922). There was only one baby with birth weight of more than 4.0 kg (LGA). Mother of this LGA baby did not show increased in the maternal TG level throughout all three trimesters (TG levels were 5.7 mmol/L, 5.1 mmol/L, and 6.9 mmol/L, respectively) compared to those with normal birth weight (Table 7).
| Variables | β coefficients | P value |
| 1st trimester | ||
| TC | .073 | .881 |
| HDL | -.180 | .729 |
| TG | -.002 | .995 |
| LDL | -.030 | .949 |
| 2nd trimester TC |
.015 | .837 |
| HDL | -.067 | .654 |
| TG | -.024 | .835 |
| LDL | .006 | .924 |
| 3rd trimester TC |
-.110 | .268 |
| HDL | .059 | .667 |
| TG | .070 | .412 |
| LDL | .020 | .838 |
Table 6: Simple Linear regression test on birth weight with maternal fasting lipid.
| Model | Sum of Squares | df | Mean Square | F | Sig. |
| Regression | 1.075 | 12 | 0.09 | 0.477 | 0.922b |
| Residual | 14.077 | 75 | 0.188 | ||
| Total | 15.152 | 87 | |||
| a. Dependent Variable: fetal weight; b. Predictors: (Constant) : Fasting serum lipid |
|||||
Table 7: ANOVAa.
Total 123 pregnant women participated in our study; however, only 90 of them completed all three follow-up. Nineteen of them were discontinued from follow-up due to various reasons, while 13 experienced first trimester miscarriage. Only one of them developed PE making the incidence of PE in our population 1.09%. Most of the participants were young primigravida with normal BMI.
In this study, we found that for normotensive pregnant women, all the components of FSL were significantly increased in each trimester (P ≤ 0.05) with the highest increase in TG and TC, followed by LDL and HDL. Wiznitzer et al. [10-17] reported similar findings in his prospective study conducted on 9991 Israelis pregnant women. Our local normotensive pregnant population reported similar value of TC, TG, LDL and HDL in each trimester compared to Marzurkiewicz et al. study [18] as shown in Table 4.
Currently, there are a lot of studies about the role of lipid metabolism on development of PE. As we know, lipid changes causes damage in the endothelial lining, with these, it inhibits endothelial prostacycline synthesis and inactivate the endothelial derives relaxing factor. It also stimulate the synthesis and release of endothelial hormone which had smooth muscle contracting effect [3]. There are 22 studies showed that the maternal plasma TG rised in pregnant women who develop PE [5]. TG was associated with four fold higher risk of developing PE, as compared to normal TG level. High TG level will increase the risk of placenta vascular disorders, which in turn will lead to endothelial dysfunction, arthrosclerosis and thrombosis. When atherosclerosis developed in the placenta spiral arteries of PE women, this indicated that there are elevated TG [4].
Ware-Jauregui et al. [9] reported that the PE women had higher serum TG as compared to normotensive pregnant women (3.39 ± 0.11 to 2.81 ± 0.07; P<0.001). Other studies have also reported an association of PE with elevated TG [1,7,9,17,19-22]. All these studies found that the onset of hypertriglyceridaemia occurred just before patients developed PE. Hyperlipidemia also appeared much earlier compared to other known circulating factors which associated with PE such as soluble Flt-1 or soluble endoglin [3]. Theoretically with this association it is very clinically attractive. By measuring TG level which is easily done and cheap, we may detect PE earlier, so preventive measures can be taken. These findings were similar to our study, although there is only one patient from our study develop PE and subsequently went into eclampsia at 25 weeks POG. This patient 2nd trimester TG was significantly increased as compared to normotensive women (4.5 mmol/L in PE and 2.1 mmol/L in normotensive women) while her HDL and LDL were similar to those normotensive women. Due to only one patient in our study develop PE, so we were unable to prove whether the changes were statistically significant.
Other important factor affecting PE is the BMI level of pregnant women. Few studies reported that pregnant women with high BMI are most likely to developed PE [19-23]. This indicates obesity is one of the risk factors of PE. Almost all the pregnant women participated in our study were from normal BMI group except for the one who developed PE. Therefore, again we cannot conclusively correlate BMI with increase in lipid profile.
Maternal age is another important factor in developing PE. Most of the reports available in the literature show parallel increase in PE incidence with age. This could be due to older pregnant women having higher risk of developing concurrent medical problem, i.e. hypertension and diabetes pre pregnancy. Such preexisting conditions may cause derangement of lipid profile, thus increase the risk of PE [24-30]. However, the correlations between maternal age and changes of lipid profile could not be seen in this study because of young studied population age.
Regarding fetal weight, Schaefer et al. reported a rise in maternal TG level was related to large for gestational age baby. But other component of lipid profile has no influence for fetal weight [16]. Maternal hypertriglyceridemia is a characteristic feature of pregnancy. Although maternal circulating TG does not directly cross the placenta, but with the presence of lipoprotein receptors, fatty acid– binding proteins, and different lipase activities in the placenta allow the efficient transfer of maternal fatty acids to the fetus. The concentration of TG in the third trimester is a strong predictor of birth weight. We did not find any significant correlation between fetal weight and FSL, because there was only one baby born with the birth weight more than 4.0 kg in our study. Moreover, we did not observe any significant difference in TG level during three trimesters as the study population was young (mean 28 years) with normal BMI (mean 23 kg/m2).
We encountered with some limitations while conducting this study. We only recruited patients from a single center in Kuantan. Patients were included during their first trimester, and a significant number of them ended up with miscarriage due to chromosomal abnormalities. As a result, the sample size reduced to a small number.
Therefore, further study with a larger sample size involving all the KKIA in Kuantan district would be appropriate. Additionally, instead of recruiting patients from first trimester, recruiting patients from second trimester onward would reduce sample loss due to miscarriage.
Lipid profile increased steadily with the progression of pregnancy, especially the total cholesterol and TG with a slight increase in LDL. In young women with normal BMI, rise in lipid level does not affect the maternal blood pressure and birth weight.
1. Sister Hanizah from Department of Biochemistry and Sister Salina from Obstetrics and Gynecology department, International Islamic University Malaysia.
2. All staffs from KK Jalan Gambut, Kuantan Pahang.