Journal of Geology & Geophysics
Open Access
ISSN: 2381-8719
ISSN: 2381-8719
Research Article - (2016) Volume 5, Issue 6
Viterito states in his paper that increasing seismic activity for the globe’s high geothermal flux areas (HGFA) is correlated with the average global temperature from 1979 to 2015 with a correlation factor r of 0.785 and that this explains 62% of the variation in the earth’s surface temperature. This makes the geothermal activity the most significant element in the change in temperature of the earth at this time. Knowing that this is the cause of a major concern for so many and a critical piece to understanding our earth and its processes, the mechanisms surrounding the seismic activity was investigated. It was found that there is a high positive correlation (r=0.935) between the speed of the North Magnetic Dip Pole motion and the seismic activity during this time period.
Keywords: Seismic activity, Geothermal forcing, Magnetic poles
Viterito [1] studied the interaction between the temperature of the globe and seismic data to address a point of difference within the scientific community as to assigning the proper percentages of temperature change to the known factors that add heat to the globe. In the past the majority of the heat was attributed to the addition of CO2 to the atmosphere due to anthropogenic activity. He derived that in actuality 62% of the heating could be attributed to geothermal heating induced by introducing heat to the oceans through seismic activity in areas of the spreading tectonic plates in the oceans. This raises a question of if there is a correlation to any activity below the surface of the earth which could be the cause of this increased activity or being affected by this activity. One of the major unusual activities since 1860 has been the motion of the North Magnetic Dip Pole (NMDP).
This paper looks at the relationship between this geological activity and the motion of the NMDP. That is, the locations where inclination is 90 degrees, i.e. where the field is perpendicular to Earth’s surface; the Black dots in Figure 1. This is not the geo-magnetic poles which define a theoretical dipole arrangement that is the sum of all the magnetic anomalies due to the earth’s complex magnetic field. The geo-magnetic field is shown in red dots.
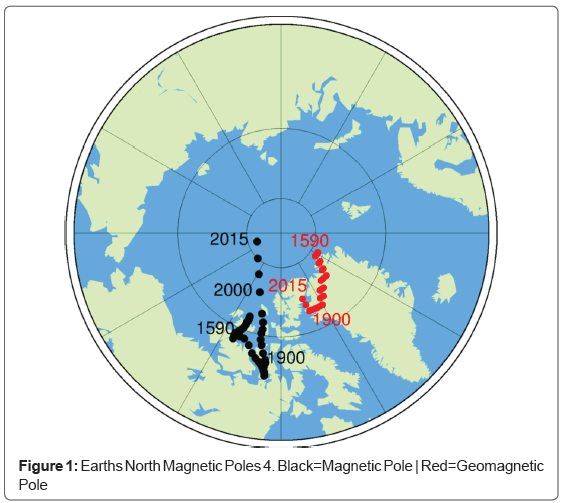
Figure 1: Earths North Magnetic Poles 4. Black=Magnetic Pole | Red=Geomagnetic Pole
The geological activity values were taken from the paper by Viterito [1]. The position of the NMDP was retrieved from NOAA [2] geomagnetic data as was the South Pole [3] position. Using the latitude and longitude values, the distance between each year’s positions was calculated as well as the distance from the rotational pole using first order true spherical distance calculations. From these values the rate of change for the pole was calculated on a yearly basis for both the absolute distance moved and the distance moved relative to the North Rotational Pole (NRP).
Referring to Figure 2, from 1591 until 1974 the NMDP was moving at an average of around 6.9 Km per year with a low of 0.34 Km/yr and a high of 16.4 Km/yr. And from 1975 until 1996 the North Magnetic Pole was moving at an average of around 12 Km/yr with a low of 11.8 Km/ yr and a high of 17 Km/yr. The position of the NMDP (Black Dots) as it moved is shown in Figure 1.
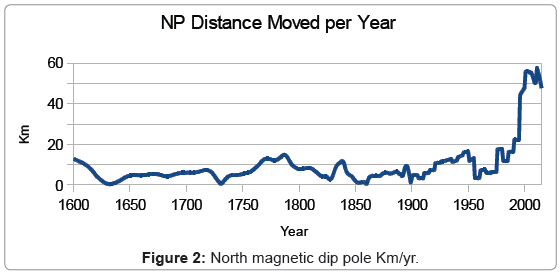
Figure 2: North magnetic dip pole Km/yr.
Then inexplicably, in 1996 the rate of travel doubled from its 1995 value to 44.1 Km/yr. In addition its average has been 3 times the 1975- 1995 average.This rate of motion coincides with the change in geological activity with a correlation of 93.45%. This indicates an extremely close correlation and a strong probability of causal interaction [4].The high degree of correlation between the NMDP speed and the geological activity can be seen in Figure 3. By looking at Figure 3 it would seem that the geological activity began to rise in 1994 and then the poles speed increasing a year later in 1995, but a fit for a one year offset is only 91.27% correlation, 2.2% less than a one to one correlation.
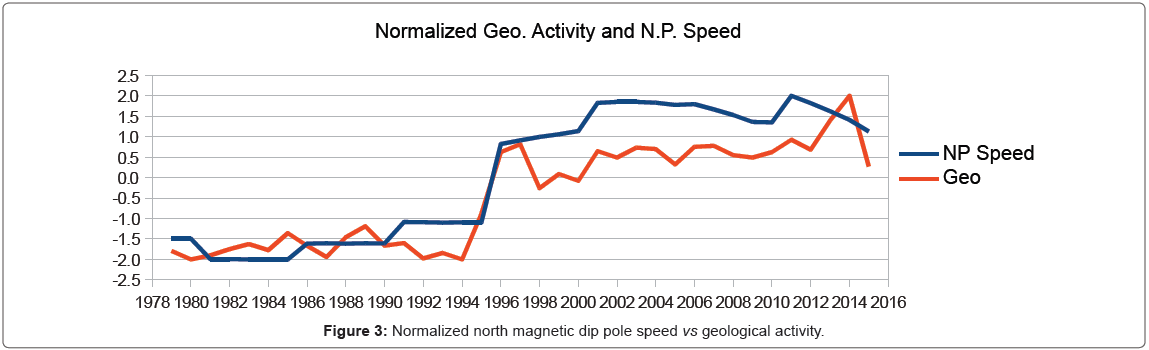
Figure 3: Normalized north magnetic dip pole speed vs geological activity.
This would indicate that we cannot tell which causes which, at least not without further analysis or more finely separated data, i.e. on a monthly basis or even finer [5]. But there is an indicator in the data that says it is more likely that the geological activity is driving the poles motion and not the other way around.
When you look at the graphs in Figure 4 and 5 you will notice that at low geological activity the speed acts in a quantum way. In other words the Pole speed is grouped into 4 distinct speeds at 12 Km/yr, 16.25 Km/yr, 17.5 Km/yr and 22.2 Km/yr. The Geological activity at 12, 16.25 and 17.5 Km/yr varies from 175 to 325 Km/yr, and at 22.2 Km/yr it varies from 175 to over 600.
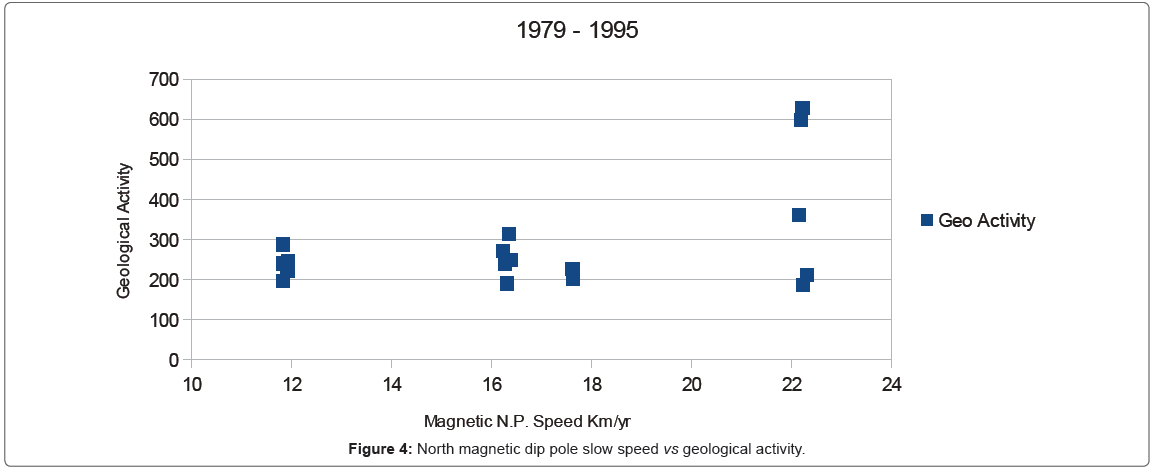
Figure 4: North magnetic dip pole slow speed vs geological activity.
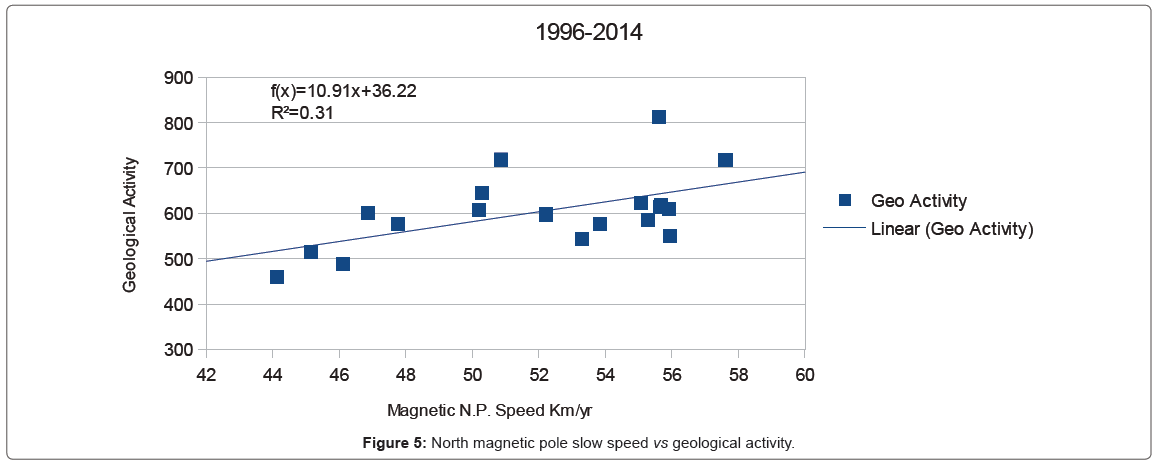
Figure 5: North magnetic pole slow speed vs geological activity.
The actual data shows the NMDP speed was 22.2 Km/yr ± 0.1 Km/yr in the years 1991 to 1995, inclusive. The geological activity was around 200 for the first 2 years then jumped to 361 and then to around 600 then 627 before the speed broke away in 1996 to 44.1 Km/yr. All of this type of activity would indicate some kind of a strong inertial or ‘frictional’ holding mechanism which prevented the magnetic pole from changing position until there was sufficient geothermal activity to overcome the holding mechanism and allow a speed change.
From a dynamo theory of the magnetic poles [6] we assume that the poles are set up following something similar to the Glatzmaier-Roberts model, which simulates convection and magnetic field generation in a fluid outer core surrounding a solid inner core. And in this case one of the driving forces would be the temperature and motion of the mantle. Geological activity would affect several factors in this model including the temperature of local areas of the mantle which would affect the conductivity of the material in these areas as well as the viscosity of the materials, both of which will have an effect on the resulting magnetic field.
One possible scenario is that the cooling effect of the release of heat from the mantle into the oceans would increase localized areas viscosity, which would tend to hold it in place, acting as a frictional force. But, its cooling would also cause its resistance to decrease, causing the regenerating fields in this area to grow stronger while other areas grow weaker. The increased electron flow would then increase the resulting motor action until a tipping point is reached. In this case when the cooling is causing the movement to be over 22 km/year the driving force of the motor action overcomes the drag from increased viscosity and the pole acts more in a linear manner. That is not to say this will be a universal condition under all circumstances, just that it is the way the present configuration is responding.
Figure 6 shows the 88.24% correlation between the distances of the NMDP to the NRP with the geological activity increasing as the NMDP gets closer to the NRP. There are several physical processes which can explain this. If a significant component, such as the rate of relative motion caused by the mantle’s rotation relative to the core, then one would expect that the maximum effect would be when the rotating members are aligned with the rotational axis, any offset from direct alignment would reduce the relative B X V velocity. Where B is the magnetic field strength, V is the relative velocity between the material cutting the B field and X is the vector multiplication operator. Since V is a velocity, speed with a vector direction, the absolute value of the magnitude of the induced currents will be a function of the sine of the angle between the motion and field direction. Motion in this case does not have to be relative motion between the mantle and the core. It can be just the direction of the magnetic current within the mantle.
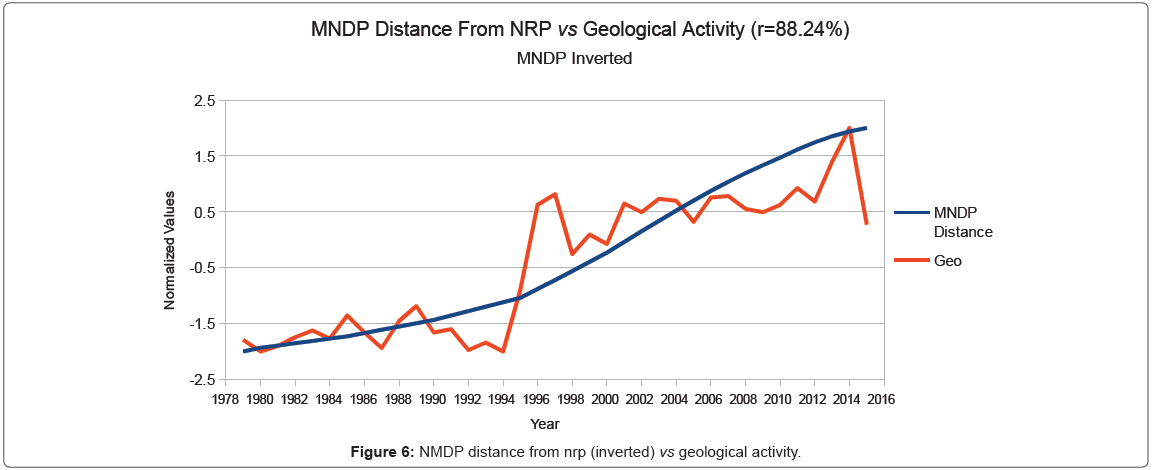
Figure 6: NMDP distance from nrp (inverted) vs geological activity.
It could also be that under the existing conditions the magnetic field is being driven towards the NRP because of where the geological activity is occurring. In the geological past and future, because the continental plate boundaries were not in the same place and will not stay in the same place, similar heat dissipation may produce dissimilar results due to where the heat loss is occurring.All of these considerations and many more must be taken into consideration and analyzed before definitive answers can be arrived at. But just knowing that these particular characteristics exist is the first step in determining their cause and their ultimate effects on both the atomic and macroscopic scales.
The amount of work necessary to derive these answers is not within the scope of this paper and will require many man hours and many people to solve. The references in [6] and [5] is an indication of the complexity of the earth’s magnetic field and the long hard work that has gone into understanding what we know at present and the amount of work it will take to understand it more fully.
This research was independently conducted, and was not funded by any corporation, government agency, or non-profit organization.