Journal of Cell Science & Therapy
Open Access
ISSN: 2157-7013
ISSN: 2157-7013
Research Article - (2015) Volume 6, Issue 5
Introduction: Diabetes is a chronic metabolic disorder that has no definitive cure till present. Currently; regenerative medicine using Mesenchymal Stem Cells (MSCs) offers promising treatment. Meanwhile, Nigella Sativa Oil (NSO) shows effectiveness for medication of various illnesses.
Objective: This study compares the antidiabetic effect of MSCs vs. NSO on streptozotocin induced type 1 diabetes (T1D) in rat model.
Methods: Human cord blood samples were collected. Isolated mononuclear cells were cultured and incubated to isolate MSCs. For experimental animals; after induction of T1D using multiple low dose streptozotocin (MLD-STZ), diabetic rats were divided into 6 groups (n =10); diabetic group 1 and 2 (sacrificed 15 and 30 days post-induction, consequently), NSO treated groups 1 and 2 (received daily NSO I.P. injection, sacrificed 15 and 30 days postinduction, consequently), MSCs treated groups 1 and 2 (72 hours post-induction, animals were treated with twice intravenous injection of 1×10⁶ cells/rat, 24 hours apart, without immunosuppression, sacrificed 15 and 30 days of induction, consequently).
Results: Low blood glucose levels were detected in both MSCs and NSO groups, which reached near normal levels within 15 days. This was accompanied by improvement of the histopathological changes and increase in the immunreactive insulin secreting cells, obviously detected after 30 days.
Conclusion: MSCs and NSO exerts comparable antidiabetic effects on Streptozotocin induced T1D.
Keywords: Immunohistochemistry; MSCs; NSO; Pancreas; Rat; Streptozotocin; T1D
Mscs: Mesenchymal Stem Cells; NSO: Nigella Sativa Oil; T1D: Type 1 Diabetes; MLD-STZ: Multiple Low Dose Streptozotocin; I.P.: Intraperitoneal; HUCB: Human Umbilical Cord Blood; TQ: Thymoquinone; CPD: Citrate Phosphate Dextrose; MEM: Modified Eagle’s Medium; FBS: Fetal Bovine Serum; PBS: Phosphate- Buffered Saline; Mncs: Mono-Nuclear Cells; H and E: Hematoxylin and Eosin; PCR: Polymerase Chain Reaction
Diabetes is one of the most recognizable endocrine metabolic disorders characterized by chronic hyperglycemia. It occurs either when the pancreas doesn’t produce enough insulin or when the body cannot effectively use insulin. Over time, it increases the risk of heart disease, stroke and diabetic nephropathy and blindness [1].
Type 1 diabetes (T1D) is characterized by an initial autoimmune targeting of the islets [2]. Its targeting is due to a defect in the immune system resulting in a loss of self-tolerance and inflammatory destruction of the insulin producing β-cells [3,4]. Exposure to a trigger is the first step resulting in stimulation of the immune system and initiation of autoimmune damage. This is followed by “insulitis”, an inflammatory reaction characterized by invasion of islets by mononuclear cells leading to death of β-cells [3].
So far; there is no definitive cure for diabetes because insulin injection does not mimic the precise regulation of β-cells on glucose homeostasis and does not prevent development of complications [4]. However; cell therapy has become a favorable approach and MSCs are offering a promising tool. As they are multipotent non-hematopoietic progenitor cells, their therapeutic potentials have recently been brought into many fields of research because of their wide regenerative capabilities and immunomodulatory properties [5].
MSCs are derived from marrow and non-marrow tissues; such as umbilical cord blood [6]. Studies have shown that human umbilical cord blood (HUCB) contains hematopoietic stem cells and MSCs, both of them can be used as alternative sources [6,7,8]. HUCB is preferred because of its easy availability, low potential for graft-versus-host disease, low tumorigenicity and limited infectious complications. Furthermore; no immunosuppression is required after transplantation [8].
MSCs have shown the possibility that they could modulate autoimmunity [9,10]. They suppress T-cell proliferation and also significantly reduce the expression of certain activation markers on stimulated lymphocytes [11].
Meanwhile; the seeds and oil of nigella sativa, among other herbal medicines with potent antioxidant effects, have attracted the interest of medical scientists to rationalize their therapeutic uses.
Nigella sativa belongs to the Ranunculaceae family, which is an annual herbaceous plant with black seeds. The black seeds of nigella sativa have been safely used as a spice and a natural remedy in Egypt and other Middle East countries [12]. Emerging studies have demonstrated that black seed oil and its different components, such as thymoquinone (TQ), manifest anti-inflammatory, anti-tumour, immunopotentiating, antioxidant and antidiabetic properties [13]. Hence, this study was designed to compare the antidiabetic effect of MSCs vs. NSO on streptozotocin induced T1D in rat model, in a step to provide scientific knowledge supporting their clinical use.
Approval of the research committee at the Faculty of Medicine- Suez Canal University was taken for ethical consideration.
Experimental animals
This study was conducted on adult female albino rats, weighing 130- 150 grams at the beginning of the experiment. The animals were acclimatized to their new place for one week before the start of the experiment. They were housed four/cage, with free access to food and water. Animals were anaesthetized before scarification. The experiment was performed in the Histology department, Faculty of Medicine, Suez Canal University.
Study design
All experimental animals were divided into 7 groups (n = 10) (i) control group (G1): received I.P. injection of 2 ml saline, daily for 5 consecutive days; (ii) diabetic group 1 (G2.1): sacrificed after 15 days of diabetes induction in the way described below, (iii) diabetic group 2 (G2.2) : sacrificed after 30 days of diabetes induction, (iv) MSCs treated group 1 (G3.1): after 72 hours of diabetes induction animals were treated with twice intravenous injection of 1×10⁶ cells/rat, 24 hours apart, without immunosuppression, sacrificed after 15 days of diabetes induction, (v) MSCs treated group 2 (G3.2): received the same dose of MSCs, sacrificed after 30 days of diabetes induction, (vi) NSO treated group1 (G4.1): received 8 ml/Kg/day I.P. injection of NSO [14] 72 hrs after induction of diabetes, for 15 days, then sacrificed, and (vii) NSO treated group2 (G4.2): received the same dose of NSO for 30 days then sacrificed. The NSO used in this study was manufactured by Technoaromatic company, Egypt.
Induction of diabetes
For the diabetic groups, T1D was induced using daily I.P. injection of MLD-STZ in a dose of 40 mg/Kg [15], dissolved in citrate buffer pH 4.5, for 5 consecutive days. Blood glucose levels were measured before the induction of diabetes, after the induction and then every 3 days and for 30 days, using one Touch Glucometer (MDSS GmbH, Germany). The measurement was done through puncturing the tail vein to obtain a blood drop. Animals considered diabetic, when random blood sugar is ≥ 250 mg/dl [16].
Preparation of MSCs
Collection of blood: The HUCB was collected from normal volunteers at the Obstetric Emergency Room of Ismailia General Hospital after getting their informed consent. Full term pregnant women with full term normal vaginal delivery of male baby were included. Females with known history of hepatitis, infectious diseases, diabetes mellitus or severe hypertension, were excluded. The collections were made prior to the expulsion of the placenta. Using strict aseptic techniques, the umbilical vein was cleansed with alcohol followed by betadine. Blood was collected in 50 ml graded sterile plastic Falcon tube containing 10ml of citrate phosphate dextrose (CPD) anticoagulant. Immediately after the cord cutting, the blood was allowed to flow into the tube by gravity. The blood was then stored at 4°C till processing within less than 24 hours.
Preparation of the culture Media [17]: The culture media used in this study was MEM (Modified Eagle’s Medium) (Biowest company). The media was supplemented with 10% FBS (Fetal Bovine Serum) (Lonza Bioproducts, Belgium) and 1% Penicillin-Streptomycin (Biowest). The prepared complete media was as following; 500 ml MEM + 50 ml FBS + 5 ml Penicillin-Streptomycin, then the prepared media was divided into aliquots of 50 ml in different sterile falcon tubes and were stored at 8c.
Processing of umbilical cord blood samples [18]: blood samples were diluted in a proportion of 1:1 in a Dulbeco’s PBS (Biowest), then were layered drop by drop into sterile centrifuge tube (50 mL, Greiner Bio-One, Germany) containing 15 ml Ficoll-Hypaque solution (lymphosep, lymphocyte separation media, Biowest), and exposed to density gradient centrifugation at 2500 rpm for 20 minutes at room temperature in order to isolate the buffy coat containing the low-density Mono-Nuclear Cells (MNCs). The MNCs were transferred carefully to a new sterile tube and washed twice with PBS through centrifugation at 2000 rpm for 10 minutes.
Culture of MSCs from mononuclear cells [19]: Isolation of MSCs was possible due to its capacity of adhesion to the plastic flasks, differently from the non-adherent hematopoietic stem cells, which were eliminated from the culture during the procedures of media change.
Subculture of mesenchymal stem cell [19]: trypsin (Biowest) was allowed to thaw in room temperature. When the cells reached 80% confluence, media was discarded from the flask, the adherent cells were washed twice with pre-warmed PBS, and then the wash solution was discarded. Two milliliters of trypsin were added, and the flask was gently rocked to ensure dispersing the trypsin solution over the cells. The flask was incubated at 37° C for 5 minutes, monitored periodically for cell detachment by observing the cells under the inverted microscope. Once cells started to be round and detach, tapping the side of the flask was done to aid more cells detachment. Once > 90% of cells detached or 10 minutes passed, the trypsin was neutralized by equal amounts of pre-warmed prepared media. The cell suspension was centrifuged at 2000 rpm for 5 minutes at room temperature. The cell pellet was ready to be injected.
At the end of the experiment, all animal were sacrificed according to each group schedule; the pancreas was extracted and fixed in formalin, paraffin processed and sectioned for histological and immunohistochemical assessment.
Hematoxylin and Eosin (H and E) stained paraffin sections, 5 μm thick, were prepared. Five high power fields (X400) were examined in five serial sections from each animal to assess the following: cell degeneration and necrosis, pancreatic islets diameter, islets number, cellular infiltration of the islets and congested dilated blood capillaries. The mean total number of the pancreatic islets cells, the percentage of the damaged cells, the mean number and diameter of the islets were calculated. Also, Masson’s trichrome stained sections were prepared to identify the amount and distribution of collagen fibers. All measurements were performed using (Image pro-plus) image analysis program.
Immunohistochemical assessment
Labeled Streptavidin-Biotin technique was used for Immunostaining of pancreatic tissue using mouse monoclonal anti insulin antibody 6. Paraffin sections were collected on superfrost plus slides purchased from Neomarkers Company. The antibody was purchased from Thermo Fisher Scientific Company, USA. Positive reaction was indicated by brown staining of the cytoplasm of β-cells only, with negative nuclear reaction. The mean optical density of the brown stained cytoplasm was measured using (Image pro-plus) image analysis program to determine the content of β-cells inside the islets.
Polymerase chain reaction (PCR) analysis of male-specific SRY gene
PCR analysis, performed to detect human male SRY gene sequence in the pancreas of the female rats, was adopted from Patelia et al. [20]. The following sequences were used to identify donor-derived cells in female recipients. [21]
Forward sequence: 5’-GAA TAT TCC CGC TCT CCG GA-3’
Reverse sequence: 5’-GCT GGT GCT CCA TTC TTG AG-3’
The PCR was done in Biotechnology center, Suez Canal University, Ismailia, Egypt.
Statistical analysis
Data were expressed as mean ± SEM and analyzed using the Statistical Package of Social Sciences (SPSS) program version 17, (Chicago, IL, USA). Comparisons among groups were carried out using one-way ANOVA. All p values reported are two-tailed and p < 0.05 was considered significant.
Clinical observations
At the beginning of the experiment; all animals weighed between 130- 150 grams, gradually increased to reach 200 gm in the control group but progressively decreased in the diabetic groups to range between 80 to 100 grams at the 30th day of the study. Water intake and urination were increased in diabetic animals with progressive decrease in animal activity. In MSCs and NSO all the previous signs observed in diabetic group were gradually improved starting from day 9 and animals became normal at the 15th day.
Blood glucose level measurement
For the control group; blood glucose levels were normal (100 to 120 mg/dl) throughout the experiment, whereas they were 250 – 500 mg/dl in the diabetic groups until the end of the experiment. In MSCs and NSO groups, animals were diabetic during the first week after induction, then blood glucose levels gradually decreased starting from day 9 and became normal by day 15 (Table 1). These results were statistically significant when compared to the diabetic groups.
| Groups | Before Ind. | After Ind. | 1st D after ttt | 3rd D | 6th D | 9th D | 12th D | 15th D | 18th D | 21st D | 24th D | 27th D | 30th D |
|---|---|---|---|---|---|---|---|---|---|---|---|---|---|
| G 1 | - | - | 107.5 ± 11.2 | 107.3 ± 11.1 | 109.7 ± 8.1 | 109.2 ± 12.0 | 106.5 ± 9.9 | 116.3 ± 3.3 | 111.5 ± 6.8 | 111.8 ± 8.5 | 112 ± 7.7 | 106.8 ± 8.9 | 111.7 ± 11.3 |
| G 2 | 124.8 ± 15.2 | 448.3 ± 144.7a | 448.3 ± 144.7a | 470.0 ± 94.9a | 441.5 ± 104.1a | 402.5 ± 108.7a | 451.8 ± 112.0a | 411.8 ± 122.9a | 409.8 ± 103.1a | 512.2 ± 59.0a | 470.5 ± 94.0a | 432.7 ± 77.0a | 470.5 ± 94.0a |
| G 3 | 111.5 ± 9.7 | 406.3 ± 127.1a | 353.5 ± 115.0a | 335.5 ± 124.8 | 313.8 ± 97.9 | 214.8 ± 40.2 | 238.5 ± 53.3 | 207.7 ± 21.6b | 196.2 ± 20.0b | 118.8 ± 17.2b | 123.3 ± 22.7b | 114.2 ± 9.4b | 103.0 ± 13.8b |
| G 4 | 119.8 ± 13.0 | 398.5 ± 101.0a | 447.3 ± 117.7a | 300.0 ± 104.8 | 297.5 ± 84.3 | 237.5 ± 46.6 | 194.5 ± 40.3b | 161.3 ± 33.4b | 140.2 ± 30.5b | 141.3 ± 21.9b | 118.3 ± 4.3b | 115.0 ± 5.7b | 104.3 ± 7.6b |
Note: Values are of the mean ± SEM (n=10 rats/group).
Ind: Induction of diabetes; D: Day.
ap<0.05 compared to G1.
bp<0.05 compared to G2.
Table 1: The mean and standard deviation of blood glucose levels in the different experimental groups.
Histological assessment
In the H and E stained sections; the control animals showed the normal architecture of the pancreas; made up of the rounded to oval pancreatic acini surrounding the paler well demarcated islets of Langerhans. Islets were formed of cords of polygonal cells separated by blood capillaries. The cells in the core of the islets (β-cells) appeared bigger than that in the periphery (Alpha cells). No congestion or infiltration was observed (Figure 1). The mean number of the islets was 13.6 ± 3.3 (Table 2), with a mean diameter of 88.7 ± 17.2 (Table 2). The mean total number of the islets cells was 2000.70 ± 90.19 (Table 3).
| Groups | Number of the islets | Diameter of the islets |
|---|---|---|
| G1 | 12.4 ± 3.1 | 85.4± 18.2 |
| G2.1 | 10.9± 2.6 | 66.3± 12.3a |
| G2.2 | 6.1± 2.3a | 64.6± 11.1a |
| G3.1 | 11.0± 1.8 | 71.9± 15.4 |
| G3.2 | 14.4± 3.3c | 85.5± 12.4c |
| G4.1 | 13.8± 3.5c | 85.6± 14.4c |
| G4.2 | 15.2± 4.5c | 90.9± 16.3b,c |
Values are of the mean ± SEM (n=10 rats/group).
ap<0.05 compared to G1; bp<0.05 compared to G2.1; cp<0.05 compared to G2.2.
Table 2: The mean and standard deviation of the number and diameter of the pancreatic islets in the different experimental groups.
| Groups | Total cells | Damaged cells | Percentage (%) |
|---|---|---|---|
| G1 | 2000.70 ±130.19 | 10.30 ± 1.42 | 1.69 ± 1.13 |
| G2.1 | 1017.90 ± 76.63a | 570.50 ± 12.30a | 52.17 ± 6.62a |
| G2.2 | 900.40 ± 33.06a | 760.70 ± 13.87a | 84.80 ± 16.41a |
| G3.1 | 1036.80 ± 65.44a | 210.50 ± 13.83a,c | 17.16 ± 3.27a,b,c |
| G3.2 | 2002.40 ± 65.07c | 100.50 ± 6.80a,b,c | 5.79 ± 1.14b,c |
| G4.1 | 1226.70 ± 58.33 | 200.80 ± 7.87a,c | 18.11 ± 4.74a,b,c |
| G4.2 | 2061.60 ± 79.85b,c | 96.50 ± 5.17a,b,c | 6.80 ± 1.22b,c |
Values are of the mean ± SEM (n=10 rats/group).
ap<0.05 compared to G1; bp<0.05 compared to G2.1; cp<0.05 compared to G2.2.
Table 3: The mean and standard deviation of the total number of pancreatic islets cells, and mean percentage and standard deviation of the damaged cells (%).
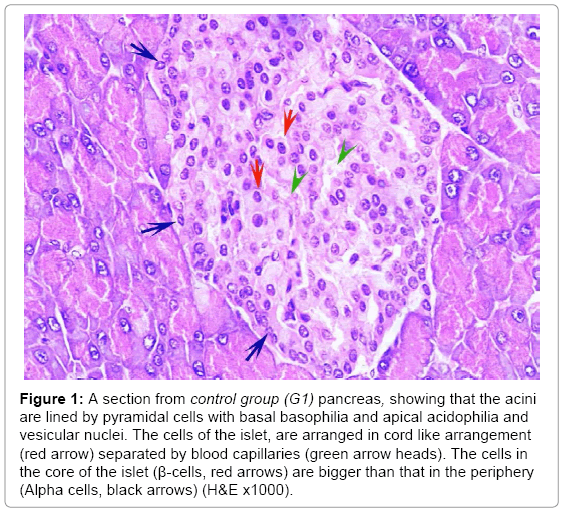
Figure 1: A section from control group (G1) pancreas, showing that the acini are lined by pyramidal cells with basal basophilia and apical acidophilia and vesicular nuclei. The cells of the islet, are arranged in cord like arrangement (red arrow) separated by blood capillaries (green arrow heads). The cells in the core of the islet (β-cells, red arrows) are bigger than that in the periphery (Alpha cells, black arrows) (H&E x1000).
In the diabetic groups, islet cells showed necrotic changes and the cord arrangement was lost. Blood capillaries were congested and dilated with lymphocytic infiltration in between the cells. The condition was worse in G2.2 than G2.1 (Figures 2 and 3). The mean number and diameter of the islets and the mean total number of islets cells were decreased (Tables 2 and 3), while the mean percentage of damaged cells was increased (Table 3).
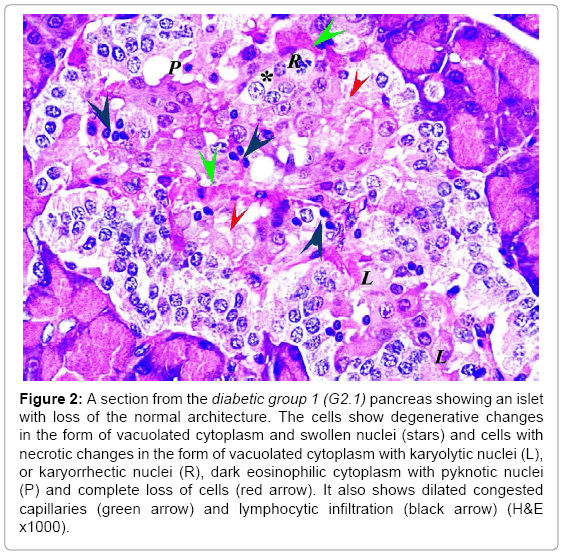
Figure 2: A section from the diabetic group 1 (G2.1) pancreas showing an islet with loss of the normal architecture. The cells show degenerative changes in the form of vacuolated cytoplasm and swollen nuclei (stars) and cells with necrotic changes in the form of vacuolated cytoplasm with karyolytic nuclei (L), or karyorrhectic nuclei (R), dark eosinophilic cytoplasm with pyknotic nuclei (P) and complete loss of cells (red arrow). It also shows dilated congested capillaries (green arrow) and lymphocytic infiltration (black arrow) (H&E x1000).
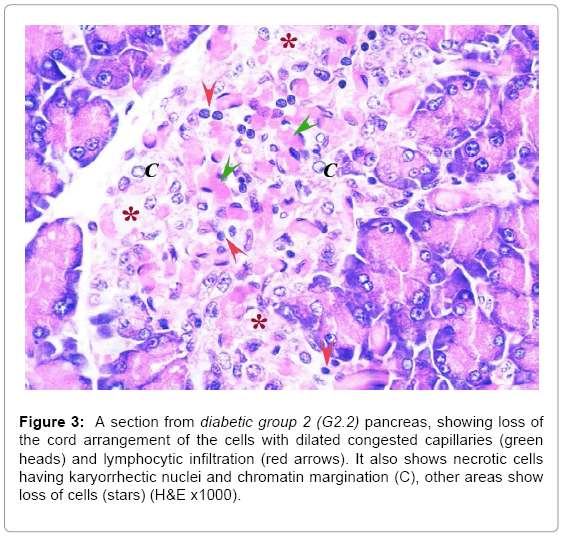
Figure 3: A section from diabetic group 2 (G2.2) pancreas, showing loss of the cord arrangement of the cells with dilated congested capillaries (green heads) and lymphocytic infiltration (red arrows). It also shows necrotic cells having karyorrhectic nuclei and chromatin margination (C), other areas show loss of cells (stars) (H&E x1000).
In MSCs groups, animal showed marked improvement compared to the diabetic group. The mean number and diameter of islets and the mean total number of the islets cells were increased, but the mean percentage of damaged cells were decreased compared to the diabetic group (Tables 2 and 3). No congested blood capillaries or lymphocytic infiltration were detected. The condition in G3.2 was better than G3.1 (Figures 4 and 5).
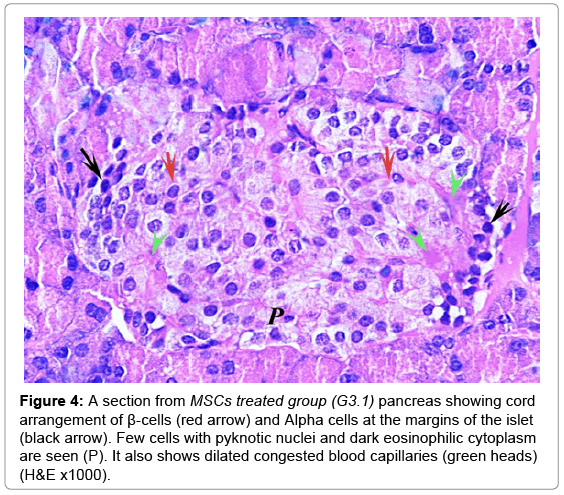
Figure 4: A section from MSCs treated group (G3.1) pancreas showing cord arrangement of β-cells (red arrow) and Alpha cells at the margins of the islet (black arrow). Few cells with pyknotic nuclei and dark eosinophilic cytoplasm are seen (P). It also shows dilated congested blood capillaries (green heads) (H&E x1000).
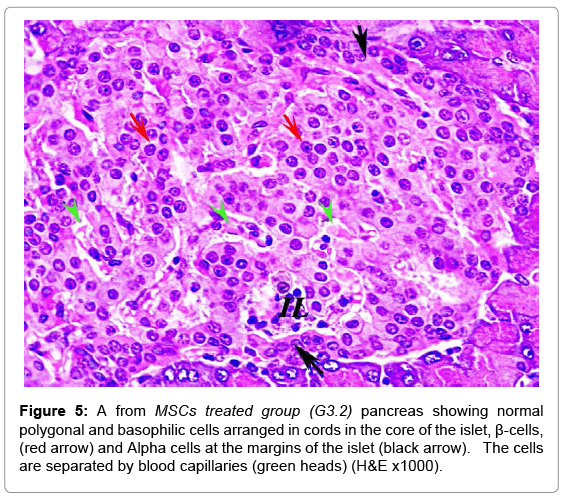
Figure 5: A from MSCs treated group (G3.2) pancreas showing normal polygonal and basophilic cells arranged in cords in the core of the islet, β-cells, (red arrow) and Alpha cells at the margins of the islet (black arrow). The cells are separated by blood capillaries (green heads) (H&E x1000).
In comparable results, NSO groups showed improvement compared to the diabetic groups. The islets restored the cord arrangement, β-cells were in the core of the islet and the Alpha cells surrounded the margins. The condition in G4.2 was markedly improved than G4.1 (Figures 6 and 7). The mean number and diameter of islets and the mean total number of the islets cells were increased compared to the diabetic groups, while the mean percentage of damaged cells was decreased (Tables 2 and 3).
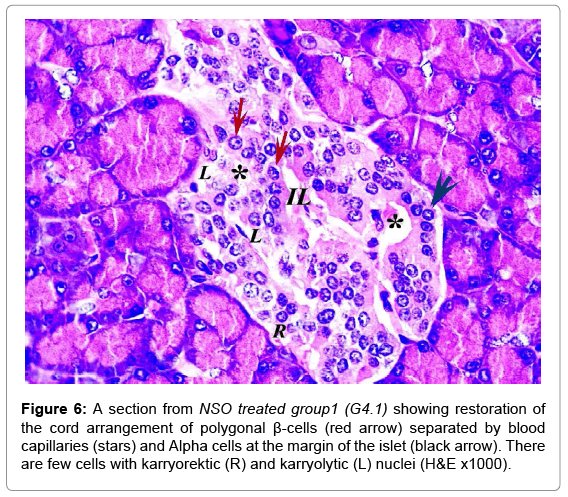
Figure 6: A section from NSO treated group1 (G4.1) showing restoration of the cord arrangement of polygonal β-cells (red arrow) separated by blood capillaries (stars) and Alpha cells at the margin of the islet (black arrow). There are few cells with karryorektic (R) and karryolytic (L) nuclei (H&E x1000).
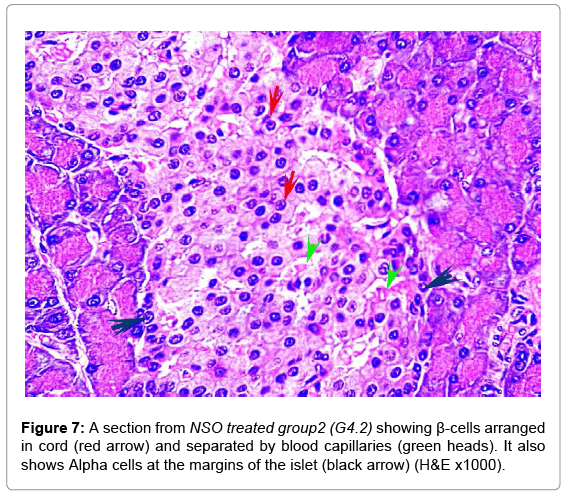
Figure 7: A section from NSO treated group2 (G4.2) showing β-cells arranged in cord (red arrow) and separated by blood capillaries (green heads). It also shows Alpha cells at the margins of the islet (black arrow) (H&E x1000).
Masson’s trichrome stain showed the normal distribution of the greenish collagen fibers in the control group, surrounding the islets and distributed between the islet cells (Figure 8). Mean optical density was 0.25 ± 0.07 (Figure 9). However; in the diabetic groups; the distribution of collagen fibers was limited to the area between the cells in the center of the islet (Figure 10). The mean optical density was not significantly different from that of the control (Figure 9). In the MSCs and NSO groups, the distribution of collagen fibers was more or less similar to that in control group a (Figures 11 and 12).
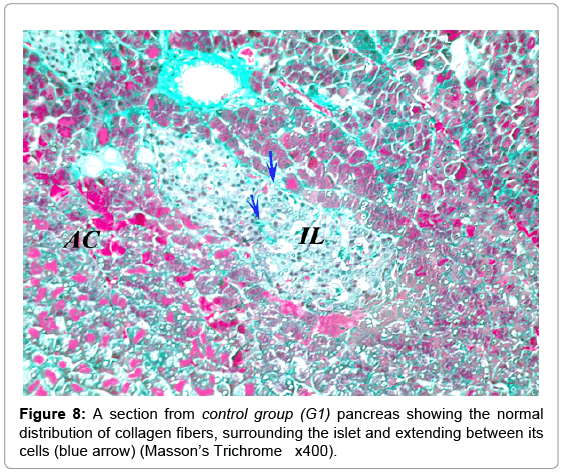
Figure 8: A section from control group (G1) pancreas showing the normal distribution of collagen fibers, surrounding the islet and extending between its cells (blue arrow) (Masson’s Trichrome x400).
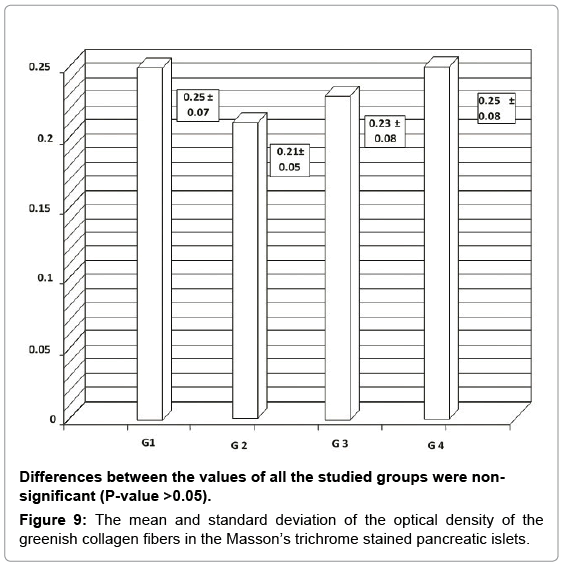
Figure 9: The mean and standard deviation of the optical density of the greenish collagen fibers in the Masson’s trichrome stained pancreatic islets.
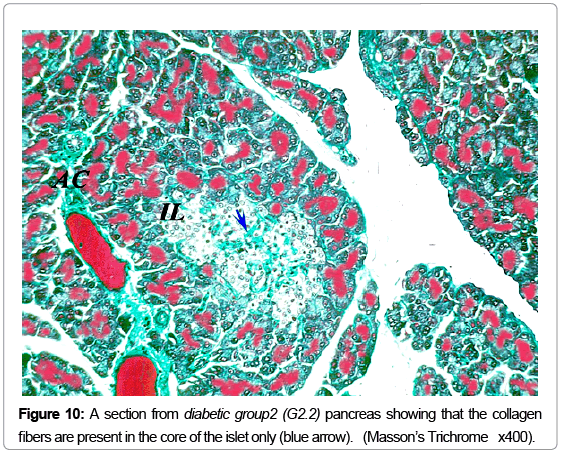
Figure 10: A section from diabetic group2 (G2.2) pancreas showing that the collagen fibers are present in the core of the islet only (blue arrow) . ( Masson’s Trichrome x400).
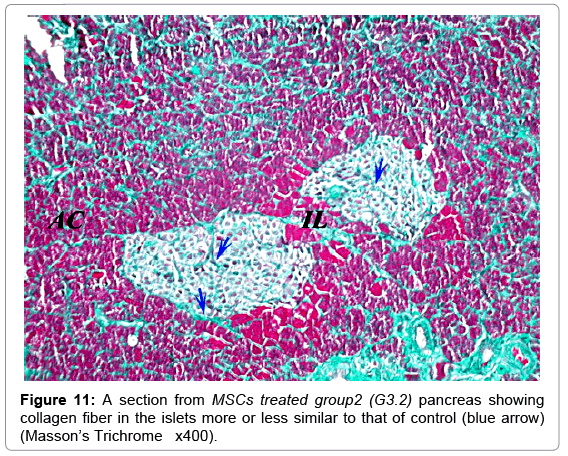
Figure 11: A section from MSCs treated group2 (G3.2) pancreas showing collagen fiber in the islets more or less similar to that of control (blue arrow) (Masson’s Trichrome x400).
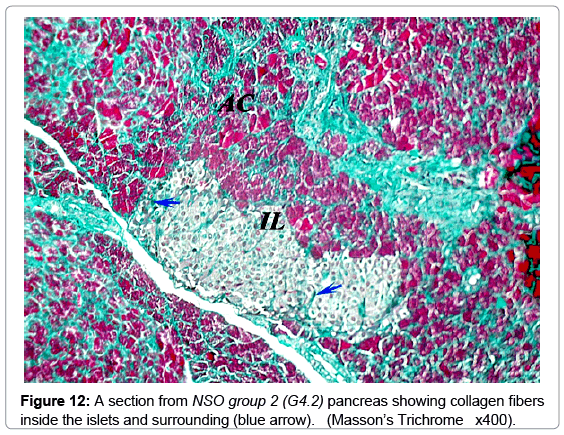
Figure 12: A section from NSO group 2 (G4.2) pancreas showing collagen fibers inside the islets and surrounding (blue arrow). (Masson’s Trichrome x400).
Immunohistochemistry
A strong brown positive staining of the β-cells cytoplasm with negative reaction in their nuclei was detected in the control animals. The β-cells were widely spread in the core of the islet, surrounded by a thin rim of Alpha cells with negative reaction (Figure 13). The mean optical density of the brown color was 0.60 ±0.07 (Figure 14). The immunreaction was more marked in the MSCs and NSO treated groups, and it was significantly different in G3.2 and G4.2 compared to the diabetic group G2.2 (P-value <0.05) indicating increase in the insulin secreting β-cells (Figures 15-17).
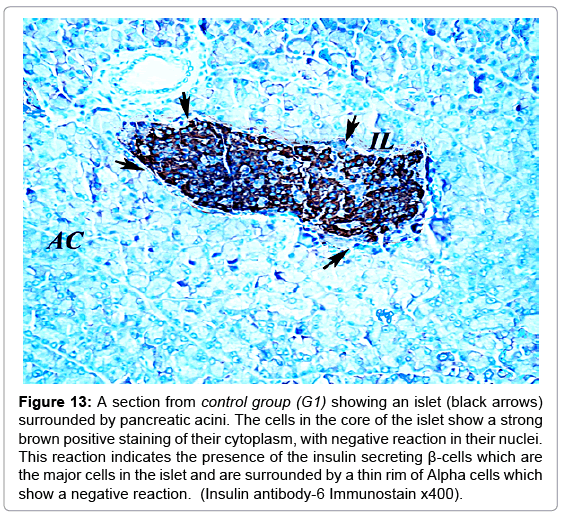
Figure 13: A section from control group (G1) showing an islet (black arrows) surrounded by pancreatic acini. The cells in the core of the islet show a strong brown positive staining of their cytoplasm, with negative reaction in their nuclei. This reaction indicates the presence of the insulin secreting β-cells which are the major cells in the islet and are surrounded by a thin rim of Alpha cells which show a negative reaction. (Insulin antibody-6 Immunostain x400).
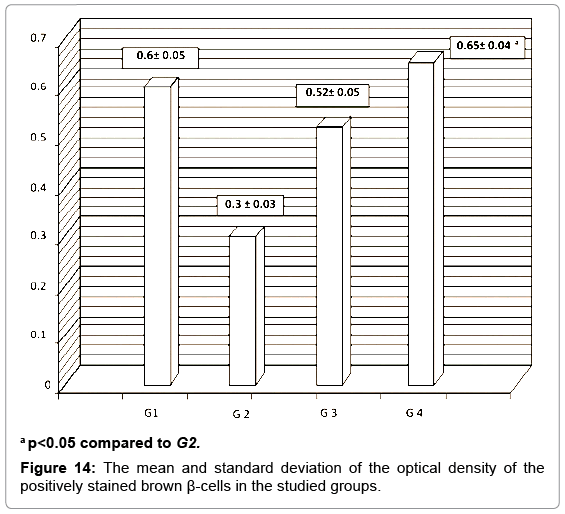
Figure 14: The mean and standard deviation of the optical density of the positively stained brown β-cells in the studied groups.
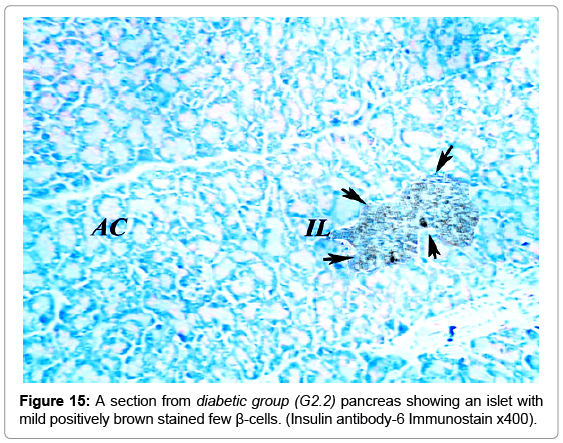
Figure 15: A section from diabetic group (G2.2) pancreas showing an islet with mild positively brown stained few β-cells. (Insulin antibody-6 Immunostain x400).
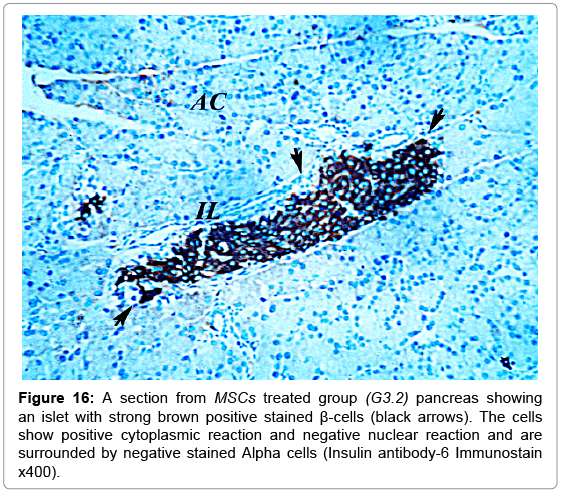
Figure 16: A section from MSCs treated group (G3.2) pancreas showing an islet with strong brown positive stained β-cells (black arrows). The cells show positive cytoplasmic reaction and negative nuclear reaction and are surrounded by negative stained Alpha cells (Insulin antibody-6 Immunostain x400).
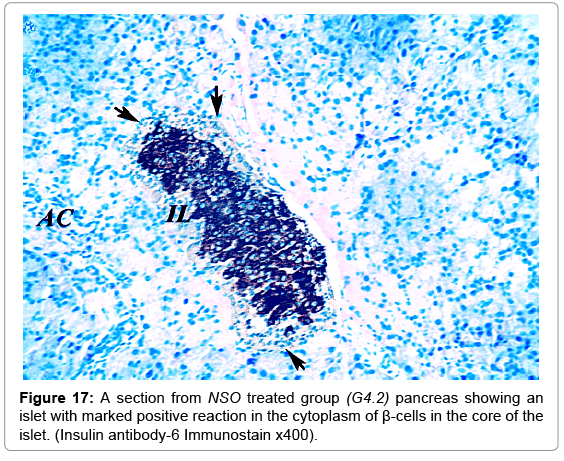
Figure 17: A section from NSO treated group (G4.2) pancreas showing an islet with marked positive reaction in the cytoplasm of β-cells in the core of the islet. (Insulin antibody-6 Immunostain x400).
Results of PCR for SRY gene
Positive results for the presence of the SRY gene were detected in MSCs group. This indicates homing of the stem cells into the pancreas of the female animals used in this study (Figure 18).
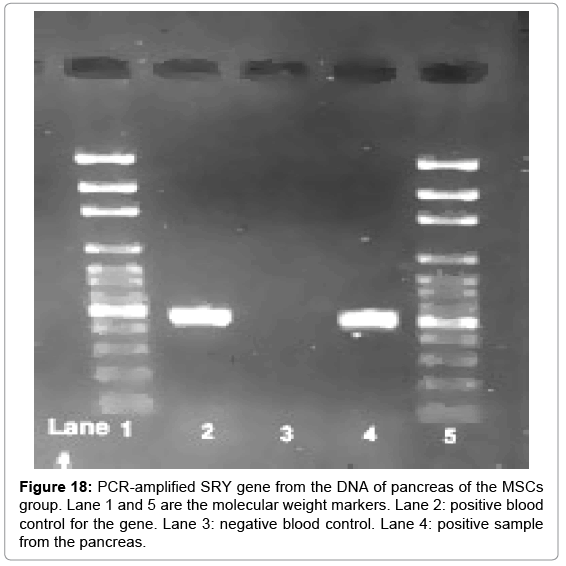
Figure 18: PCR-amplified SRY gene from the DNA of pancreas of the MSCs group. Lane 1 and 5 are the molecular weight markers. Lane 2: positive blood control for the gene. Lane 3: negative blood control. Lane 4: positive sample from the pancreas.
The complications of Diabetes mellitus have significant health, economic and social impacts on individuals, families, health systems and countries [5]. This necessitates the continuous search for definitive treatment which is not reached yet [22].
In this study, we used multiple low dose streptozotocin model for induction of T1D. This model causes damage to β-cells mostly through two pathways; 1) direct toxicity to the cells through production of nitric oxide and oxidative damage to the cells [1]. 2) T-cell mediated immunological process which plays an important role in the development of STZ-induced diabetes [5]. Several studies were conducted to explain the mechanism of STZ-induction, from which four evidences were reported to confirm the T cell mediated insulitis. These included: lymphocytic infiltration of the islets after MLD-STZ injection [23], immunocompromised mice did not develop diabetes after MLD-STZ treatment [24], induction of diabetes by the transfer of splenic cells from STZ-induced diabetic mice to normal mice [25] and the development of diabetes in young non-obese diabetic mice lacking T cell receptors after injection of MLD-STZ [5].
In the current work, diabetic group H and E stained sections showed increase in the damaged cells, decrease in the islets diameter and inflammation of the islets. This was accompanied by high blood glucose level which gradually increased until the end of the experiment. This can be explained by the continuous destruction of the insulin producing β-cells by streptozotocin. Shehata et al. [15], after 10 days of inducing diabetes in mice using the MLD-STZ design, found inflammation of the islets with necrosis of their cells, reduction in the islets number and diameter especially after 35 days of diabetes induction [15]. Also De la Garza-Rodea et al. [26] found inflammation of the islets with lymphocytic infiltration and necrosis of their cells, after 25 days of STZ treatment in mice [26]. Masjedi et al. [27] reported similar results when investigated the effect of garlic extract on the histopathology of the pancreas after 6 weeks of STZ-induced diabetes in rats [27]. Additionally; the anti-insulin immunostaining of the cells, used in this study, confirmed that the damage was mainly in the β-cells. This finding was shown in other studies after 25 days of diabetes induction [27] and after 6 weeks survival [28].
The histological changes are referred to the inflammation produced by STZ and the state of increased oxidation of the islet cells mediated by the chronic hyperglycaemia [29] which generates excessive free radicals and attenuates antioxidative machineries through glycation of the antioxidant enzymes [1]. The free radicals, then lead to lipid peroxidation and protein oxidation of cellular structures resulting in cell injury [30].
The clinical improvement detected in MSCs treated group compared to the diabetic group was also reported by Lv et al. [5] who investigated the antidiabetic effect of the transplanted bone marrow mononuclear cells in a dose of 1*107, and found that the blood glucose levels improved after 6 days of the transplantation due to regeneration and proliferation of new β-cells [5]. In the current study, the improved blood glucose level was accompanied by improvement of the microscopic picture. H and E stained sections showed increased islets number and diameter. The inflammation of the islets disappeared after 30 days of treatment. We related this improvement to homing of the MSCs in the damaged pancreatic islets and regeneration of do novo islets cells as confirmed from our PCR results and the anti-insulin immunostaining of the pancreatic islets which showed increase in the Beta cells content inside the islets. Two main mechanisms were suggested for the curative effect of MSCs; their capacity of tissue repair, and their immunomodulatory effects. These effects include enhancing of T-lymphocyte apoptosis, decreasing their proliferation and modulating the cytokine production of T cells. It was also reported that MSCs secret soluble molecules that may suppress the inflammatory process [31]. In addition, tissue injury activates immune cells such as macrophages and T cells by factors from damaged cells, which attract the MSCs resulting in their differentiation to replace damaged tissue cells [32]. Also, many factors including TNF-α, IL-1, IFN-γ and hypoxia can stimulate the release of growth factors from MSCs which, in turn, promote the development of fibroblasts, endothelial cells, and tissue progenitor cells [3].
Our results were in agreement with that of Lv et al. [5] who found that after 10 days of bone marrow transplantation into diabetic mice, there was some improvement in the histopathological changes in the pancreatic islets and complete improvement was reported after 30 days compared to control animals. [5] Similar results were reported by Milanesi et al. [28] who studied the transplantation of human bone marrow MSCs into diabetic animal models on histological and immunohistochemical basis. They found that the human stem cells had homed in the pancreas and regenerated into β-cells with complete cure after 6 weeks from transplantation [28].
The NSO treated group of our study showed decrease in the blood glucose levels started at the 10th day with complete return to normal levels after 15 days of treatment. This was associated with increase in the number and diameter of the islets and marked decrease in the damage rate. The anti-insulin immunostaining also showed increase in the β-cells compared to the diabetic group. This was contradictory to the study of Abdelmeguid et al. [13] who investigated the hypoglycaemic effect of NSO on experimentally induced diabetic rats, and found no curative effect except after 20 days. This difference between results may be due to the higher dose we used in our study (8 ml/kg) compared to that of Abdelmeguid’s dose (0.2 ml/kg) [13].
However, our findings were in accordance with that of Kanter et al. [34] who found that diabetic rats treated with NSO showed improvement after 10 days treatment compared to the diabetic rats.
The curative effect of NSO in this group can be referred to; 1) the antioxidant effect of NSO. Nigella sativa has radical scavenging and anti-inflammatory properties through their thymoquinone and phenolic compounds [35], 2) the partial regeneration and proliferation of β-cells [22], which was confirmed in our study, 3) the hypoglycemic effect of nigella sativa oil which was found to improve insulin insensitivity in diabetic rats [36] and decreased liver gluconeogenesis [37]. In addition nigella sativa was also dose dependently able to reduce glucose absorption from intestine, through inhibition of sodium dependent glucose transport across isolated rat jejunum [38].
In conclusion; both MSCs and NSO had no obvious harmful effects on the pancreatic islets. They improved the histopathological changes and hyperglycaemia induced by STZ in correspondence with the dose and duration of the current study; which indicates MSCs and NSO as a promising antidiabetic therapy. However; further experimental studies are required emphasizing the sustainability of this antidiabetic effect as well as the protective scope of these therapies against the complication of diabetes.
Authors wish to thank the head and members of the Medical Genetics Unit, Faculty of Medicine Suez Canal University, for the help and support offered during the process of stem cell preparation. No funding was received from any organization for the fulfilment of this study.