Journal of Geology & Geophysics
Open Access
ISSN: 2381-8719
ISSN: 2381-8719
Research Article - (2013) Volume 2, Issue 1
Employing LiCor 6400 gas exchange analyzer and soil respiration chamber attachment (LiCor Inc., Lincoln, NE, USA), this paper continuously measured the soil surface CO2 effluxes on the sloping pasture of Heihe River basin from early April to late October 2010 to investigate the soil CO2 efflux rate and its feedback to the changes of climate and land use. The results showed that during the growing season, the diurnal variation of pasture soil respiration in the mountain watershed of the Heihe River valley was low at night, with lowest appears at 7:00, 6:30, 5:30, 5:00, 6:00 and 7:00 from May to October, and started to rise rapidly during 7:00~8:30, and then descend during 16:00~18:30. The maximum soil CO2 efflux appears at 15:00, 14:30, 14:30, 13:30, 14:00 and 15:00. The maximum of average soil CO2 efflux occurred in July and August, and the second was in May and September, and the third was in April and October. And it was basically consistent in April and October. The diurnal average of pasture soil CO2 efflux was between 0.31~6.98?mol m-2s-1, and the Q10 value is 2.16. Soil CO2 efflux had an exponential and Boltzmann correlation with temperature and soil moisture, respectively.
Keywords: Soil respiration rate, Growth season, Temperature, Soil moisture, Sloping pasture, Heihe River basin
Soil surface CO2 efflux is one of the major pathways by which CO2 fixed by terrestrial plants is released into the atmosphere [1]. Given the controversy over its potential role in amplifying global warming, soil surface CO2 efflux has recently been the subject of intensive study [2-5]. In the face of impending global warming, increases in soil respiration are likely to mediate progressively lower rates of carbon sequestration [2,6-8]. Despite its obvious importance to carbon cycle processes, soil respiration has proven to be extremely difficult to quantify accurately. Like many other soil processes, respiration exhibits both great spatial heterogeneity, particularly at small spatial scales, and great temporal variability on diurnal, seasonal and inter-annual time scales [9-15].
Sloping pasture is the main pasture types on the mountain watershed of the Heihe River basin, and they cover about 28.27% of the total land area. Understanding of the pasture efflux of CO2 from the soil surface is a key component of the carbon balance of its ecosystem. Quantifying this flux and understanding the factors that underlie the temperature and soil moisture variation in its magnitude are fundamental to our understanding of the behavior of the ecosystem as a whole and to our ability to predict the likely consequences of climate change [15]. Up to now, a large number of studies have been carried out on the relationship between the dynamics of soil CO2 flux and related factors [16-19]. However, little has been reported on the sloping pasture soil respiration intensity at regional scale. This study describes the changes in CO2 flux of sloping pasture soil and the temporal differences during the growing season under different environment conditions were explored in this study. The spatial variations of soil CO2 flux and its relation to the environmental elements such as soil water content, and temperature were discussed. The results help the scientific community’s understanding of carbon exchange mechanisms between soil and atmosphere and the source-sink changes of the terrestrial ecosystem.
Site description
The experimental site is located in the Pailugou watershed in the Xishui Forest Farm of Sunan County in Gansu Province. The basin covers an area of 2.95 km2, with 55% grassland and 40% forest land. The study area has a high, cold, semiarid and sub-humid mountain forest and grassland climate, with mean annual temperature of 0.5°C, mean annual precipitation of 435 mm, and annual potential evaporation of 21051 mm [20]. Sloping pasture mainly occurs in the mountain forest grassland zone at elevation of 2,500~3,000 m and occupies about 28.27% of the Qilian Mountain region’s total area. The main plant species are Carex, Achnatherum inebrians, Polygonum viviparum, Oxytropis ochrocephala, Achnatherum splendens. Soil type in the region is mountain grey cinnamon soil, with a depth of about 1 m. Hence, the study of CO2 flux of alpine meadow soil at this altitude will contribute to a better understanding of the feedback effect of soil CO2 emission flux on the climate and land use changes under high altitude and low temperature conditions.
Soil surface CO2 efflux measurements
Soil surface CO2 effluxes were measured on early April to late October 2010 with a LiCor 6400 gas exchange analyzer with soil respiration chamber attachment (LiCor Inc, Lincoln, NE, USA). The 6400 is a closed system infrared gas analyzer that measures soil respiration. We installed five PVC collars (0.008 m2) randomly located in each 5m×5m plot 2 days. Collars were imbedded approximately 2 cm into the soil and left in place throughout the measurement period. We did not begin measurements until 1 week after installation to minimize the effects of disturbance from collar installation and removed live vegetation inside the chamber collars at least 24 hr before measurements to minimize influences of soil disturbance and root injury on the measurements.
Soil temperature and moisture measurements
Soil temperature and moisture were determined at each soil CO2 efflux measurement location and time. Soil moisture within the top 80 mm of soil was measured with a cable tester (1502C Metallic TDR Cable Tester, Tektronix, Inc., Beaverton, OR) and dedicated Time-Domain Reflectometry (TDR) steel probes (8 cm long) inserted vertically from the soil surface. Temperature was measured at a depth of 0.1 m from the soil surface with a copper-constantan thermocouple mounted in an aluminium probe.
Data analyses
The relationship between soil CO2 flux and temperature was analyzed using the statistical analysis software SPSS 13.0 for Windows and the dynamical curve was drawn using the Origin Pro 8.0.
The diurnal variation in soil CO2 efflux
Soil CO2 efflux showed an asymmetric diurnal pattern, with a minimum between 0300H and 0700H (local time) and a maximum in the early afternoon (13:00H-16:00H). Soil CO2 efflux followed the increasing trend of soil temperature in the morning, but then leveled off with slight fluctuations, while soil temperature continued to increase in the afternoon. From evening to early morning of the next day, soil CO2 efflux followed, with few fluctuations, the declining trend of soil temperature. In growth season, Heihe basin mountainous area sloping pasture soil CO2 efflux daily variation assumes the following characteristic: In the evening maintains at the low level, Minimum value about 6:00, Starts in 7:00~8:30 to elevate,14:00 about maximizing, 16:00~18:30 to drop gradually, The entire process assumes the single peak curve. Different month, Soil breath speed daily variation existence remarkable difference, displays starts in the soil breath speed to elevate, the maximizing time is different. From May to October, the diurnal variation of soil respiration was low at night, the lowest at 07:00 H, 06:30 H, 05:30 H, 06:00 H and 07:00 H, rise rapidly between 07:00 H and 08:30 H, and then descended between 16:00 H and 18:30 H. The maximum soil CO2 efflux appeared at 15:00 H, 14:30 H, 14:30 H, 13:30 H, 14:00 H and 15:00 H (Figure 1).
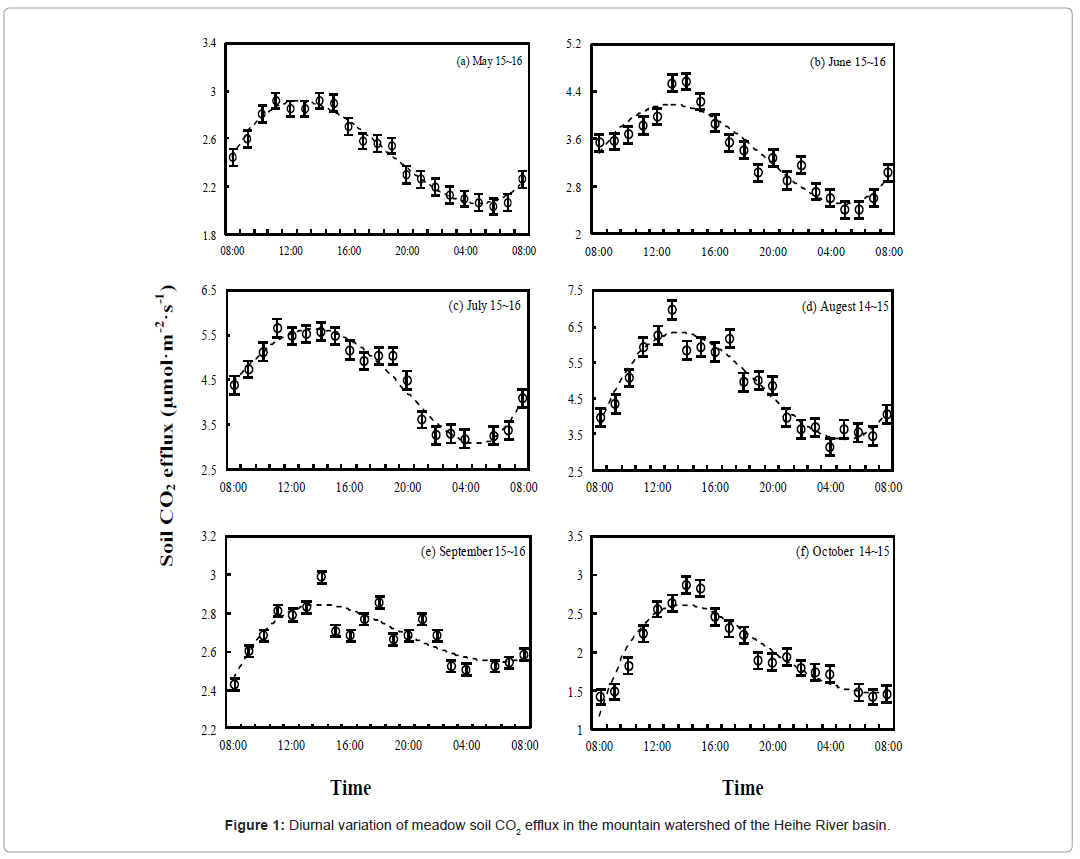
Figure 1: Diurnal variation of meadow soil CO2 efflux in the mountain watershed of the Heihe River basin.
In different periods of growth, soil CO2 efflux diurnal variation existence remarkable difference (Figure 2) The mean daily soil respiration rate between 0.31~2.58 μmol·m-2·s-1 in May, 0.78~4.85 μmol·m-2·s-1 in June, 4.61~6.98 μmol·m-2·s-1 in July, and then gradually descended at 2.37~6.26 μmol·m-2·s-1 in August, 3.47~4.23 μmol·m-2·s-1 in September, 1.61~4.21 μmol·m-2·s-1 in October.
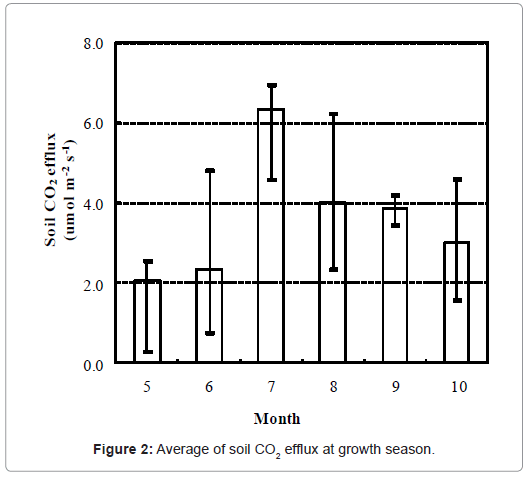
Figure 2: Average of soil CO2 efflux at growth season.
The seasonal variation in soil CO2 efflux
The continuously observed results of CO2 flux of sloping pasture soil in the Heihe river basin (Figure 3, Table 1) showed that associated with the diurnal variations, soil CO2 flux was low in the initial growing stage (May) but gradually increased in June, reached a maximum value 8.49 μmol·m-2·s-1 in July to August (Figure 3) and started to decrease in September, the entire process change tendency assumes the single peak curve.
| Month | 5 | 6 | 7 | 8 | 9 | 10 |
|---|---|---|---|---|---|---|
| Mean Soil CO2 efflux/µmol·m-2·s-1 | 2.06 | 2.37 | 6.35 | 3.99 | 3.85 | 3.01 |
| maximum value/µmol·m-2·s-1 | 6.35 | 8.43 | 8.49 | 8.37 | 8.24 | 4.21 |
| minmum value/µmol·m-2·s-1 | 1.03 | 1.54 | 2.11 | 2.48 | 0.88 | 0.82 |
| CV / % | 63.4 | 56.0 | 52.4 | 55.3 | 61.6 | 54.6 |
Table 1: Means and coefficients of variance of pasture soil CO2 efflux.
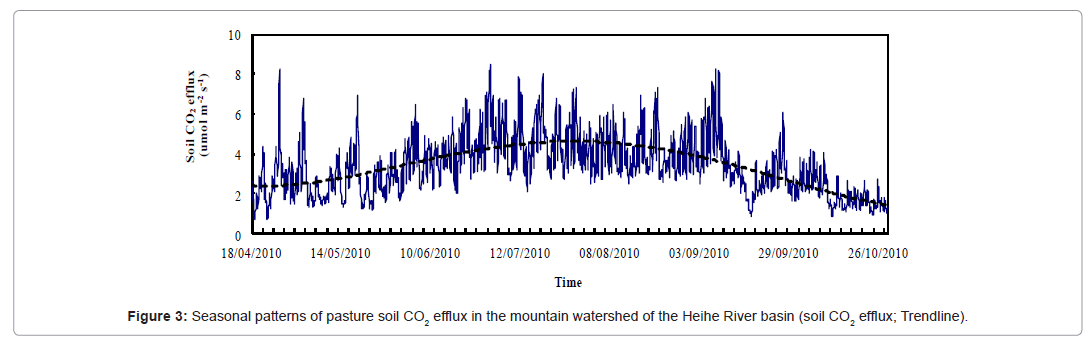
Figure 3: Seasonal patterns of pasture soil CO2 efflux in the mountain watershed of the Heihe River basin (soil CO2 efflux; Trendline).
Effects of soil temperature and moisture on soil CO2 efflux
Non-linear regression analysis showed that the exponential model can better describe the relationship between CO2 flux of sloping pasture soil in the Heihe river basin and soil temperature at 15 cm depth as shown in figure 4a. Statistical analysis revealed that the correlation between CO2 flux of alpine meadow soil (S) and soil temperature was significant (P<0.001, n=25), and its regression relation is as follows:
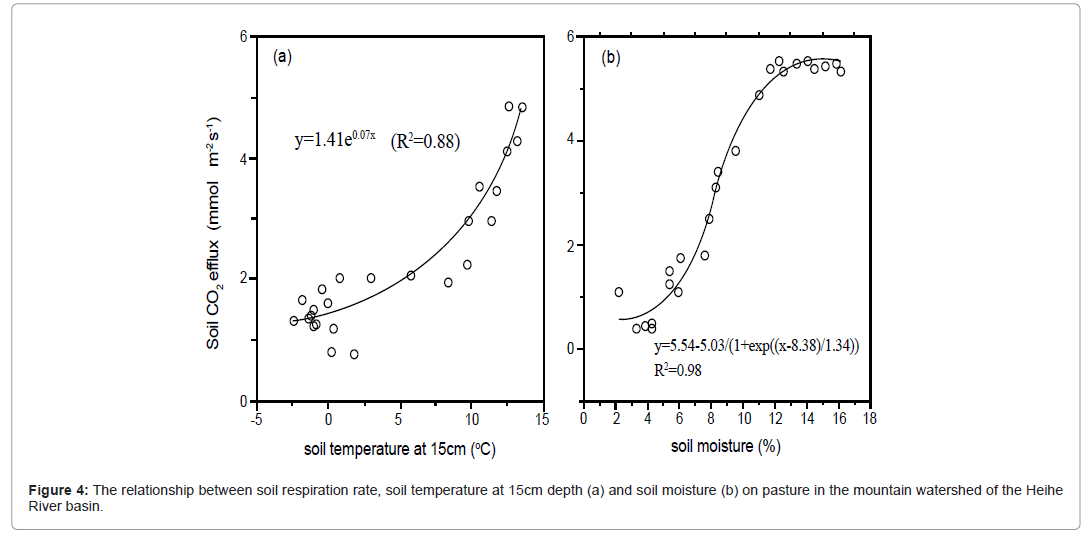
Figure 4: The relationship between soil respiration rate, soil temperature at 15cm depth (a) and soil moisture (b) on pasture in the mountain watershed of the Heihe River basin.
S=1.41e0.077t (R2=0.88)
Q10=e(10×0.077)=2.16
The variation trends of CO2 flux of sloping pasture soil in the Heihe river basin and soil water content were not consistent figure 4b. When soil water content was low, the variations in soil CO2 flux and soil water content were almost synchronous, i.e. CO2 flux increased with increase in soil water content, but when soil content increased to a certain level the increase in soil CO2 flux became slow. Analytical results show that the Boltzmann model can better describe the relationship between CO2 flux of sloping pasture soil in the Heihe river basin and soil moisture (P<0.001, n=25), and its regression relation is as follows:
S=5.54-5.03/ (1+exp ((x-8.38)/1.34)) (R2=0.98)
Simultaneous stepwise ranking of variables’ effects on soil CO2 efflux
Soil temperature and soil moisture, as well as their interaction showed effects on changes in soil CO2 efflux. Using the stepwise regression process in SPSS, all variables were tested simultaneously for their relative contribution to explaining variance in soil CO2 efflux. These results were similar to those obtained using simple linear regression with individual factors: soil temperature was positively related to soil CO2 efflux and explained about 46.8% of its variance; soil moisture was weakly positively related to soil CO2 efflux and explained about 15.7% of its variance; All of the variables combined explained about 62% of the variation in annual CO2 efflux in 2010.
Soil CO2 efflux showed diurnal and seasonal changes (Figures 1,2) The measurements of soil CO2 efflux presented here for the sloping pasture sites were in the range of 0.31-6.98 μmol·m-2·s-1. This result is higher than one of 2.32-5.70 μmol·m-2·s-1 reported by Michael [21] for grassland in northern Ontario of Canada. Raich and Schlessinger [6] summarizes large amounts of data showed that average Q10 of grassland around 2.4, but for forest soils, Liu Shaohui and Fang jinyun [22] believes that global average Q10 is 1.57. This study indicated that the Q10 value of sloping pasture soil is 2.16, And LI Linhao [23] in sheep grass grassland research results showed that Q10 value is 2.0~3.0 (to temperatures for based on), slightly than tropical dilute tree grassland in North Australia [24] and high grass grassland in North America [25] they think this phenomenon attributed to research locations of latitude location partial high, because Q10 value in cold region higher than warm region [26]. This study site and the leymus chinensis grassland study sites at the same temperate zone, and temperature ranges of the experimental period commensurate with each other so their Q10 values are closer.
While multiple factors contribute to the differences in measured efflux rates, the generally low soil moisture and high soil temperature at our site are likely to be the two major factors which determined the magnitude of the soil CO2 efflux at the Heihe river basin. Jensen et al. [27] measured soil-surface CO2 efflux over two days at 8 locations in a Pinus radiata D. Don forest in New Zealand using a dynamic chamber method (portable infra-red CO2 analyser). Their results showed no apparent diurnal pattern in CO2 efflux, which may have been a result of a lack in variation in soil temperature (at 150 mm depth) and the high soil moisture (close to field capacity during the measurements). However, Davidson et al. [28] reported a diurnal trend resembling the temperature pattern. Kutsch & Kappen’s [29] measurements in crop fields showed a diurnal trend of CO2 efflux similar to ours, except that their diurnal maximum occurred later (about 16:00 H).
When simultaneously considered, soil temperature and soil moisture explained 46.8 and 15.7, respectively, of the variance in soil CO2 efflux on our sites. Thus our results indicate that soil temperature as a single factor explains the greatest amount of variance in soil CO2 efflux observed within and across sites and over seasons in the Heihe river basin (R2=0.88, P<0.0001). Our findings are consistent with reports that cite a strong relationship between soil temperature and soil CO2 efflux [30,31].
Generally, soil moisture limits soil CO2 efflux at either extremely high or low moisture levels [30-32]. In agreement with the results of Davidson et al. [28], at the Heihe river basin the single factor of soil moisture was correlated (R2=0.98, P<0.0001, N=25) with CO2 efflux, and the soil CO2 efflux increased slow at high soil moisture contents (>15%). This effect at high soil moisture may also be related to the availability of O2 in the soil pore space, which affects microbial activity. From laboratory and theoretical studies some researchers have found that high water content can impede diffusion of O2 into the soil, which in turn impedes decomposition and CO2 production [33-34].
Soil-surface CO2 efflux measurements were made on sloping pasture of Heihe river basin from April to October 2010. During the growing season, the diurnal variation of pasture soil respiration in the mountain watershed of the Heihe River valley was low at night, with lowest appears at 7:00, 6:30, 5:30, 5:00, 6:00 and 7:00 from May to October, and started to rise rapidly during 7:00~8:30, and then descend during 16:00~18:30. The maximum soil CO2 efflux appears at 15:00, 14:30, 14:30, 13:30, 14:00 and 15:00. The maximum of average soil CO2 efflux occurred in July and August, and the second was in May and September, and the third was in April and October and it was basically consistent in April and October. The diurnal mean soil-surface CO2 efflux of sloping pasture stand ranged from 0.31 μmol·m-2·s-1 to 6.98 μmol·m-2·s-1, and the Q10 value is 2.16. The positive relationship between soil CO2 efflux and soil temperature that was observed is well documented. And the soil CO2 efflux showed a Boltzmann correlation with soil water content.
This work was funded by the National Natural Science Foundation of China (91025002; 30970492; 31270482; 41271037), National Natural Science Foundation of Gansu Province (1107RJZA089) and the National Key Technology R&D Program (2012BAC08B05). The authors would like to express their deep gratitude to the anonymous reviewers for their valuable suggestions that greatly improved the manuscript.