Journal of Geology & Geophysics
Open Access
ISSN: 2381-8719
ISSN: 2381-8719
Research Article - (2018) Volume 7, Issue 3
The textural characteristics and sorting of the beach deposits on the Lagos barrier lagoon coastal complex was determined using grain size analysis of sediments. Fifty sediment samples were collected from five beaches namely Seme, Yovoyan, Lekki, Okun-Ajah and Orimedu. Inclusive mean and the inclusive standard deviation (sorting) were used to spatially assess the textural characteristics and sorting of sediment grain size so as to determine the prevailing wave energy level traversing the beaches and their significant variations at each beach using analysis of variance. The textural characteristics for the beaches showed dominantly coarse sands, moderately sorted sediments along the waterline, while medium sands, moderately well sorted sediments were found at the berm of the five beaches. The cross-shore profile of the beaches gave a dynamic system with moderately high wave energy between the waterline and the berm which affects the swash and backwash sediment grain size. Analysis of variance and post-hoc multiple comparisons according to Tukey-Kramer critical value was adopted to assess the spatial variations of the descriptive statistics and consequently, the wave energy level. The inclusive mean and the inclusive standard deviation were significantly different between the pairs of Seme and Okun-Ajah beaches in terms of textural characteristics and between the pairs of Seme and Yovoyan beaches in terms of sorting, accounting for the spatial variation in the descriptive statistics and thus the wave energy level between the beaches showing greater impacts with high wave energy level on Yovoyan and Okun-Ajah beaches than Seme beach due to their textural compositions. However, the hydrodynamic forces of the ocean were responsible for the moderately high wave energy level that traverses the beaches, making it unequivocal that the beaches on this barrier lagoon coastal complex are susceptible to coastal erosion.
Keywords: Textural characteristics and sorting; Beach sediment; Grain size analysis; Analysis of variance; Post-hoc test; Coastal erosion; Barrier lagoon coastal complex
In the purview of coastal erosion study, sediment grain sizes are special concern because they are the eroded materials that are evenly or unevenly distributed along beach thus defining the topography of the beach. Coastal processes such as wave, current and tides operating on the coastal environment defines the morphology of the beach system as well the sediment grain type and size found on the beach [1,2]. This action is a continuous process because of the dynamic nature of the coastal system. Particles at the beaches were separated as a result of density difference because of the energy of the transporting medium Trindade and Ramos [3]. High wave energy currents tend to carry larger fragments of sediment particles. Energy reaching the beach proceeds from high to low as the waves move up the beach slope. As the energy decreases, heavier particles are deposited and lighter fragments continue to be transported, and this is why beach sands tend to be wellsorted [4-7]. However, as the wave energy level increases, sediment sorting decreases.
Beach sediments are assessed based on the textural characteristics and the sorting (or uniformity) in order to infer the level of wave energy that traverse the beach system. However, several scientists had worked on the changes in sediment grain size and the onshore-offshore sorting across the beach profile using the basic statistical granulometric parameters such as mean, median, mode, standard deviation, skewness and kurtosis [4,8]. The relationship between the sediment grain size and beach profile was considered in the cross-shore direction, with the grain sizes assumed to be uniform [2,5,9]. Beach sand distribution and characteristics in the littoral zone are mainly controlled by marine hydrodynamics [10] and change with sediment movement. Fine particles are washed into area of low energy and larger particles like the coarse and medium sands accumulate in the area of highest and moderate energy zone respectively [6,7].
In this paper, two statistical granulometric parameters were used as descriptive statistics to spatially assess the textural characteristics of sediment grain sizes and explain their sorting based on asymmetrical threshold under waves [11] across the beaches on the barrier lagoon coastal complex. That is, to use the inclusive mean and inclusive standard deviation (sorting) as basic tools to characterize the grain sizes of the beach in terms of the prevailing wave energy level that traverse the beach. The inclusive mean determines the textural characteristics of sediment which would help to determine how much energy there is in waves or currents and the conditions under which they have been deposited, while the inclusive standard deviation determines the sorting of sediment grain sizes which would help to determine the uniformity of the grain size in the sediments. For example, the sorting of sediments along a beach profile produces cross-shore variations in sediment grain sizes. Thus, these parameters could be referred to as very good environmentally sensitive indicator for understanding the transportation dynamics within the system. Analysis of variance was adopted to determine the variations of the textural characteristics and sorting per beach.
Very few researched worked have been done on beach sediment on this barrier lagoon coastal complex, and there is, so far, no standing record of work done along the prospective beaches discussed in this paper. However, some works on beach sediments on the barrier lagoon complex includes those of Titocan [12], Rabiu [13], Nedecco [14,15], Weber [16] and Allen [17-19].
Study area
The study area is located between latitude 6022’34.32”N and 6026’15.61”N and between longitude 2042’56.45”E and 3053’46.32”E, which comprises of five beaches on this barrier lagoon coastal complex namely Seme beach, located at the Nigeria-Benin Republic boundary on latitude 6022’34.32”N and longitude 2042’56.45”E, Yovoyan beach, located at Badagry on latitude 6023’37.22”N and longitude 2052’19.46”E, and Lekki beach, located at Lekki on latitude 6025’21.04”N and longitude 3029’39.70”E. Others are Okun-Ajah beach and Orimedu beach, which are located at Ajah and Orimedu on latitude 6025’27.77”N, longitude 3034’40.15”E and on latitude 6026’15.61”N, longitude 3053’46.32”E respectively (Figure 1). These beaches are situated on the barrier lagoon coastal complex, which, extends eastward for about 200 km from the Nigeria/Benin Republic border to the point where the coastline starts a southward inflection. The complex consists of narrow beach ridges which are aligned parallel to the coast, and thus opened to the direct hydrodynamic fluxes of the sea. High wave energy is associated with the coastline line of Lagos State, because of the dominant plunging waves associated with the coast, and as a result the beaches are erosive.

Figure 1: Satellite image of the study area showing location of the five beaches.
The study locations fall within the eastern part of the Dahomey Basin. The Dahomey basin is bounded to the north by the Precambrian Basement complex of southwestern Nigeria, the Gulf of Guinea to the south and eastward by the Okitipupa ridge. The geology of the Lagos coast is dominated by a continuous and monotonous reputation of clayey and sandy horizons. The horizons show some lateral continuation in some place but in most parts, the lithology pinches out. Along the coastline (east-west), the topmost unit of the Stratigraphy is made up of sands of various types grading into clay, sandy-clay and coarse, gravely and conglomeratic sand and shale at deeper levels.
Field survey and data processing
A total of fifty beach sediment samples were collected from five established beach profile stations at an interval of 500 m over coverage distance of 2 km during a coastal erosion monitoring survey conducted between 19th and 25th of March, 2015. At each beach ten sediment samples were collected at the waterline and berm at a shallow depth of 15 cm therefore; deep and stored in well labeled sediment bags. Collection of samples from the two geomorphic units of the beach would help to determine the cross-shore variation of the grain size distribution in order to associate a potential wave energy level between the waterline and the berm.
The granulometric analyses of the fifty samples were carried out at the wet lab of Marine Geology/Geophysics Department of the Nigerian Institute for Oceanography and Marine Research (NIOMR). The samples were dried in the oven at room temperature to get rid of the inherent moisture in order to make them more unconsolidated. About 70 g of each dried sample was weighed and sieved respectively using Rotab shaker (endecotts EFL 2000). Rotab Shaker mechanically shakes the unconsolidated sediment samples for exactly 15 minutes and stops automatically. Sediments were separated into their respective grain sizes Folk (1968). Before sieving, each of the sieve trays was weighed empty, and after sieving, each sieve tray was reweighed with their content in order to obtain the grain size weight retained on each tray by a simple difference. Values of the weight retained were recorded for further statistical computations, and this process was repeated for all the samples from the five beaches.
Data analysis
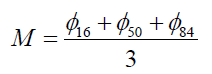
Statistical analysis of the results and graphical representation of the data were performed using MATLAB programming language. Dataset of the weight retained were imported into the MATLAB program, where the necessary mathematical functions to calculate the descriptive statistical parameters, such as the inclusive mean and the inclusive standard deviation, had already been inputted. With the software, a grain size table was generated, which included weight retained, weight percent, cumulative weight percent and percentage pass (or percentage finer). The percentage pass was used in a linear interpolation with the grain size diameter in millimeters at the appropriate percentage bin using piecewise cubic Hermittent interpolation polynomial (PCHIP) method to estimate the required Percentiles.. The percentiles in millimeters were then converted to values in phi (Φ) units by a logarithmic function given by Φ = Log2D according to Krumbein [20], where D is the grain size diameter in millimeters. The percentiles were used with the appropriate mathematical functions given in Table 1 to compute the inclusive graphic mean and the inclusive standard deviation (sorting) [21]. The skewness and Kurtosis were not computed as they as they are used to determine shape and distribution, which are not part of the objectives of this paper. The results of the inclusive mean statistics was texturally classified according to Wentworth scale [22], while the sorting statistical parameter was verbally classified according to Folk [23].
| Mean (textural characteristics) | Standard deviation (sorting) |
|---|---|
 |
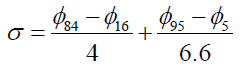 |
Table 1: Mathematical functions of the grain size descriptive statistics.
Then, the inclusive mean and the inclusive standard deviation (sorting) parameters were calculated for samples along the waterline and along the berm, and then averaged respectively to have one value for each of the descriptive statistics to summarize the beach textural characteristics and sorting within the accuracy of Wentworth scale Wentworth [22] and Folk [23]. This was repeated for the five beaches. The dynamic change of the descriptive statistics between the waterline and the berm unveiled the cross-shore variations of the textural characteristics and sorting, and then the potential wave energy level responsible for the migration or textural difference of the grain sizes. Results of the inclusive mean and inclusive standard deviation from the five beaches were tabulated and also given in bar plots to give a clearer view of their cross-shore variation per beach.
Where M is the grain size inclusive graphic mean, σ is the inclusive standard deviation and Φ represents the percentiles.
Analysis of variance (ANOVA) was also performed at 5% significance level to conduct a hypothetical, test on the inclusive mean (textural characteristics) and inclusive standard deviation (sorting) of the beaches along the barrier lagoon coastal complex, whether the descriptive statistics were significantly different or not among the beaches. This was used to also infer whether the wave energy level that traversed the beaches was significantly different or not. To achieve this, results of the inclusive mean and inclusive standard deviation from the granulometric analysis of the sediment samples of each beach were collated each as column vector per beach to create a matrix of ten rows and five columns (10 × 5), where the rows represent results of the descriptive statistics per station/sample and the columns represent the five beaches. This data matrix was imported into the MATLAB platform to conduct the analysis of variance using the intrinsic statistical toolbox. A post-hoc multiple comparison test was performed in line with Tukey-Kramer critical value [24] in order to identify the pairs of beach that were significantly different among the beaches in terms of the textural characteristics (inclusive mean), sorting (standard deviation) and by inference the wave energy level on the barrier lagoon coastal complex. Accordingly, two or more beaches are said to be significantly different if their horizontal multiple comparison intervals are disjointed between their mid-vertical-line, or are not significantly different if their horizontal multiple comparison intervals overlapped between their mid-vertical-line. The disjoint and overlapping cases of the multiple comparisons were used mostly to identify the beaches into group or pairs of beach with significantly different sand textural characteristics, sorting and by inference, the wave energy characteristics.
The statistical results and graphical solutions of the descriptive statistics (i.e. the inclusive mean and inclusive sorting) of the beaches on the barrier lagoon coastal complex have been provided in (Tables 2 and 3), and in (Figures 2-4) respectively. Table 2 represents the repository of the averaged descriptive statistics of the sediment grain sizes per beach, while Table 3 contained information from the analysis of variance (ANOVA). Figure 2 represents the spatial assessment of the textural characteristics and sorting per beach, presented in a subplot of bars with the upper plot being the textural characteristics per beach and the lower plot being the sorting per beach. The blue bars represent the waterline, while the red bars represent the berm on each of the subplot. Description of Table 2 and Figure 2 was done to reflect the cross-shore dynamic change or variation between the waterline and the berm. Figures 3 and 4 are the post-hoc multiple comparison results from the analysis of variance indicating whether there was significant difference or not in the textural characteristics and the sorting.
| Parameter Waterline (ɸ) Berm (ɸ) Interpretation | |||
| Seme Beach | |||
| Mean | 1.41 | 1.05 | Medium sand and medium sand. |
| Standard deviation | 0.61 | 0.47 | Moderately well sorted and well sorted. |
| Yovoyon Beach | |||
| Mean | 0.71 | 1.23 | Coarse sand and medium sand |
| Standard deviation | 0.88 | 0.58 | Moderately sorted and moderately well sorted |
| Lekki beach | |||
| Mean | 0.94 | 1.26 | Coarse sand and medium sand |
| Standard deviation | 0.78 | 0.62 | Moderately sorted and moderately well sorted. |
| Okun-Ajah Beach | |||
| Mean | 0.23 | 1.05 | Coarse sand and medium sand |
| Standard deviation | 0.80 | 0.59 | Moderately sorted and moderately well sorted |
| Orimedu Beach | |||
| Mean | 0.33 | 1.14 | Coarse sand and medium sand |
| Standard deviation | 0.56 | 0.56 | Moderately well sorted and moderately well sorted |
Table 2: A repository of the descriptive statistics of the sediment grain size in cross-shore zone per beach.
| Descriptive Statistics | Number of Sample | Significance Level (%) | Degrees of Freedom | F-Statistics | P-Value | Comment |
|---|---|---|---|---|---|---|
| Mean (Textural Characteristics) | 10 | 0.05 | 4 | 2.94 | 0.0307 | 0.0307<0.05 |
| Standard Deviation (Sorting) | 10 | 0.05 | 4 | 4.13 | 0.0062 | 0.0062<0.05 |
Table 3: Results of the analysis of variance of the inclusive mean and the inclusive standard deviation.

Figure 2: Spatial assessment of the textural characteristics and sorting per beach. a) The textural characteristics per beach. b) The sorting per beach. The waterline and the berm are identified by the blue and red colour legends.

Figure 3: Post-hoc multiple comparisons of the textural characteristics (inclusive mean) of the beach sediments.

Figure 4: Post-hoc multiple comparisons of the sorting (Standard deviation) of the beach sediments.
Numerically, the inclusive mean and standard deviation (sorting) of the grain size of Seme Beach along the waterline were 1.41 Φ and 0.61 Φ respectively, and for the berm, they were 1.05 Φ and 0.47 Φ respectively, indicating the dominance of medium sands on the waterline and on the berm with sorting of the sediment grain sizes improving from moderately well sorted at the waterline to well sorted at the berm (Table 2 and Figure 2).
(Table 2 and Figure 2) also presented the results and the graphical representations of the analysis of sediments from Yovoyan beach respectively. The descriptive statistics of Yovoyan beach includes 0.71 Φ inclusive mean, 0.88Φ standard deviation (sorting) of the grain size along the waterline, and 1.23 Φ inclusive mean and 0.58 Φ standard deviation (sorting) along the berm, indicating Yovoyan beach to have textural characteristics that is coarse sand at the waterline and medium sand at the berm with the sorting ranging from moderately sorted to moderately well sorted.
The soil component of Lekki beach is numerically made up of 0.94 Φ and 1.26 Φ inclusive mean along the water and berm respectively, while the standard deviation (sorting) is 0.78 Φ and 0.62 Φ along the waterline and berm respectively, indicating a classification of coarse sand to medium sands whose sorting ranged from moderately sorted to moderately well sorted (Table 2 and Figure 2).
The Okun-Ajah beach is characterized by similar textural characteristics and sorting as the Yovoyan and Lekki beach respectively. The inclusive mean and standard deviation of the beach along the waterline is 0.23 Φ and 0.80 Φ respectively, while along the berm, they are 1.05 Φ and 0.59 Φ respectively (Table 2 and Figure 2). The inclusive mean and standard deviation indicated the textural characteristics to improve from course to medium sand particles with sorting improving from moderately sorted along the waterline to moderately well sort along the berm.
For Orimedu beach, the numerical values of inclusive mean at the waterline and berm is 0.33 Φ and 1.14 Φ respectively, while the inclusive standard deviation at those geomorphic units is 0.56 Φ and 0.56 Φ respectively (Table 2 and Figure 2). These statistics identified Orimedu beach to be texturally characterized by coarse to medium sand properties in the cross-shore direction between the waterline and the berm with identical sorting of moderately well sorted grain sizes.
Analysis of variance
A one-way analysis of variance was conducted to evaluate the null hypothesis that there is no significant difference of the descriptive statistics between the beaches on the barrier lagoon coastal complex. At 5% significance level, the ANOVA result was found to be statistically significant for the inclusive mean, F(4,10)=2.94, p=0.0307 and also statistically significant for the inclusive standard deviation (Sorting), F(4,10)=4.13, p=0.0062 (Table 2). That is, the probability values (p-value) of the inclusive mean (textural characteristics) and the inclusive standard deviation (sorting) were 0.0307 and 0.0062 respectively, indicating p-values that is less than the 0.05 (i.e. 5%) significance level respectively.
This means that there is significant difference in the descriptive statistics among the beaches, and consequently, there was no enough evidence to support the null hypothesis, and thus was rejected. Hence, the inclusive mean and inclusive standard deviation (i.e. the descriptive statistics) varies across the beaches. This evidently implied that the moderately high wave energy level traversing the beaches on this barrier lagoon coastal complex also varies and does not have the same impact per beach. Post-hoc comparisons revealed pairwise significant difference between the beaches in terms of the textural characteristics (inclusive mean) and sorting (standard deviation), and these are shown in (Figures 3 and 4)respectively. While the multiple comparisons intervals of the textural characteristics of Yovoyan beach, Lekki beach and Orimedu beach overlapped across the mid-vertical-line, that of Seme beach and Okun-Ajah beach (i.e. the blue and red horizontal lines) were disjointed about the mid-vertical-line (Figure 3).
In Figure 4, the sorting of Lekki beach, Okun-Ajah beach and Orimedu beach have their horizontal multiple comparison intervals overlapped the mid-vertical-line, while the Seme beach and Yovoyan beach theirs disjointed about the mid-vertical-line (i.e. the blue and red horizontal lines).
Textural characteristics of sediments of the beaches on the barrier lagoon coastal complex have been found to range dominantly between medium and coarse sands with sorting ranging from moderately sorted to moderately well sorted sediment grains sizes. Similar textural characteristics and sorting have been found to exist among the beaches, especially along the berm. Along the waterline, except Seme beach that has medium sand, the four other beaches have shown uniformly coarse grains textural characteristics and sorting which shown dominance of moderately sorted. Since these sediments grain sizes are closely transported from the marine environment Moiola and Weiser (1968), it follows that a level of energy environment are responsible for the crossshore dynamic change of the grain sizes between the waterline and the berm. Hence, the medium and coarse categories of the beach sands as well as the grain size uniformity classifications have shown indications for moderately high wave energy level to be responsible for the crossshore dynamic change of the grain sizes of sediment of the beaches on this barrier lagoon coastal complex.
On the basis of individual beach, the ratio of the textural characteristics (inclusive mean grain size) and the sorting (inclusive standard deviation) reveals that the sediments deposited on the Seme beach are mostly driven by moderate wave energy level that traversed the beach in the cross-shore direction, while moderately high wave energy level traverses Yovoyan beach in the cross-shore direction. The textural characteristics of Lekki beach have similarity with the Yovoyan beach. Hence, the beach is similarly impacted by moderately high wave energy level in the cross-shore direction. The statistics of Okun-Ajah beach have shown the wave energy level of the beach in the cross-shore direction to be moderately high like the Yovoyan and Lekki beach respectively. For Orimedu beach, the descriptive statistics showed that the beach is traversed by moderately high wave energy level that consistently inclined to moderate wave energy level in the cross-shore direction as the beach is identically characterized by similar sorting at the waterline and at the berm. From the perspective of wave energy level, it is obvious that Yovoyan beach, Lekki beach, Okun-Ajah beach and Orimedu beach can be mostly affected by the moderately high wave energy level than the Seme beach
With the p-values less than the significance level means that there is significant difference in the descriptive statistics among the beaches, and consequently, the null hypothesis was rejected. This showed that the descriptive statistics (inclusive mean and inclusive standard deviation) varies across the beaches, and thus evidently implied that the moderately high wave energy level traversing the beaches on this barrier lagoon coastal complex also varies and does not have the same impact per beach. The post-hoc analysis has revealed pairwise significant difference between the beaches.
Hence, beaches have been categorized into pairs on the bases of how significantly different they are in terms of the textural characteristics and sorting, as well as the wave energy level of impact. Seme beach and Okun-Ajah beach are pairs of beaches, which have been found to be significantly different in their textural characteristics among the other beaches, implying also that the wave energy level on these pairs of beach also differ or vary. Okun-Ajah beach is assumed to be more impacted than the Seme beach, because of the textural coarseness of the grain size of the sediment on that beach. Similarly, Seme and Yovoyan beaches are another pairs of beaches which have shown significant difference in their sorting, implying also that the wave energy level on this pair of beaches also differ significantly, with less impact on the Seme beach and most impact on Yovoyan beach. Generally, the posthoc results showed that the textural characteristics vary between pairs of Seme and Okun-Ajah beaches and the sorting varies between pairs of Seme and Yovoyan beaches. From Seme beach to Orimedu beach, the prevailing moderately high wave energy level spatially progresses with likely varied impacts along the barrier lagoon coastal complex.
The textural characteristics and sorting of the cross-shore beach dynamic system of the Lagos barrier lagoon coastal complex is controlled by moderately high wave energy level with textural variability at the waterline and berm for the five beaches ranging from coarse sands, moderately sorted to medium sands, moderately well sorted during swash and backwash dynamics. The analysis of variance revealed that the inclusive mean and the standard deviation (descriptive statistics) were significantly different between the pairs of Seme and Okun-Ajah beach in terms of textural characteristics and between the pairs of Seme and Yovoyan beach in terms of Sorting, showing the variations of the descriptive statistics among the beaches. Consequently, since the beaches are opened to the direct hydrodynamic forces of the ocean plus the identified wave energy level that spatially progresses with likely varied traverse impacts on the beaches, it is unequivocal that the beaches on this Lagos barrier lagoon coastal complex are susceptible to coastal erosion.
We appreciate the Executive Director/CEO of the Nigerian Institute for Oceanography and Marine Research (NIOMR), Dr. G.R. Akande for his consistent support for research and academics. We also thank the Director of Marine Geology/ Geophysics Department of the institute, Dr. A.T. Adegbie, for his input, reviews and useful criticism and supports. This paper would not have been a success without the input of my co-authors and colleagues. Thanks for your useful contributions.