Journal of Geology & Geophysics
Open Access
ISSN: 2381-8719
ISSN: 2381-8719
Research Article - (2023)Volume 12, Issue 9
The climate in Pakistan gradually increases in severity in the north-south direction. But irrigation allowances are almost kept constant, particularly in Punjab. The results show that climate becomes more severe towards the tail of the BARI DOAB commands both during summer as well as winter. The average annual rainfall varies from 713 mm for Lahore in the northeast to 209 mm for Multan in Sidhnai command in the southwest; and the ETo difference is 177 mm between the two stations across spatial domain of the BARI DOAB commands. DTW increases in the downstream direction of Bari Doab i.e. why canal water was reallocated.
The canal water availability was simulated for Bari Doab in MODFLOW calibrated model. Here, the possibility of climate change was simulated by increasing and decreasing groundwater recharge by 15% and 25% of existing average canal flows. Moreover, in another simulation canal water was reallocated i.e. distributed equally all over the Doab in a way that recharge from canal and rainfall remained equal. Then in another simulation groundwater pumping was assumed equal to calibrated model and distributed equally. Graphs were also developed for depth to watertable. Moreover, areas declared as non-perennial were recommended for perennial allocations.
Groundwater modelling; Graphical User Interface (GUI); ModelMuse; Bari Doab; Indus basin canals
The groundwater supplies in many regions around the world are being depleted to meet growing irrigation and other needs in the wake of diminishing surface water supplies e.g. USA and India [1]. The depletion of these groundwater supplies is expected to intensify as a result of climate change. These impacts are likely to be particularly severe in regions such as Bari Doab, where the groundwater is already being depleted at a very high rate. As the groundwater depletes the cost of pumping increases and risk of water quality deterioration also increases.
The research area lies in the Bari Doab between rivers Ravi and Sutlej on Pakistani side of the border. The Bari Doab area is part of a vast stretch (about 40,000 km2) of alluvial deposits worked by the tributary rivers of the Indus. The parent material is of mixed calcareous alluvium derived from a variety of rocks during the Pleistocene period. The general slope of the area is mild towards the south-westerly direction, with average slopes ranging from 1 in 10,000 to 1 in 4,000. The predominantly agricultural land is at an elevation of 100 m to 210 m above mean sea level.
Climate change
According to the Global Climate Change Risk Index (2014) Report, Pakistan is listed in the top ten countries which are the most vulnerable to climate change. The hottest day in the world, with temperature of 50.2°C was recorded on 30th April, 2018 in the District Nawabshah, Sindh, Pakistan. Climate change can be natural or due to certain anthropogenic activities. One net impact is in the form of uncertainties to the water available for human activities, particularly for agriculture. Although Intergovernmental Panel on Climate Change (IPCC, 2007) has well-recognized climate change internationally and locally, but its impact on groundwater in Pakistan is found to be least researched rather not researched [2]. Due to high temperatures, increase in evaporation and transpiration would increase water requirements for every sector. In contrary, the water availability is expected to decrease due to higher incidences of flooding and more prolonged and severe droughts. Consequently, these changes would influence the intensity and timing of precipitation. This will certainly impact surface storage and groundwater recharge. The ultimate impact would be groundwater depletion and reduction in the net water availability in contrary to increasing water requirements in every sector. Groundwater resources are related to climate change in any area through the direct and/ or indirect interaction with surface water, although the response would be late. There could be many impacts of climate change namely: Change in monsoon pattern, increase in temperature and ET rates, increase in rainfall intensity, decrease in the number of rainy days, decrease in snow fall, increase in glacier melt and retreat, change in runoff pattern, decrease in groundwater recharge, increase in extreme events, sea level rise and deterioration in water quality increase in seawater intrusion. Increase in surface water flow is also possible due to an increase in rainfalls.
Reduced water availability in Indus Basin is expected due to the following:
• Decline in on-line water storage due to sedimentation in the reservoirs;
• Increasing in agriculture, domestic and industrial water demands;
• Required increases in environmental flows or in other words deteriorating water quality in rivers;
• Depleting groundwater resources leading to increasing river losses as is occurring now;
• Potential impact of climate change on water resources in the mountains also.
Concern regarding water availability has been growing in recent years regarding the potential impact of climate change on Pakistan’s already stressed water resources. Rising temperatures, increasing saltwater intrusion in coastal areas, floods (as observed in 2011 and 2022) or drought occurrence also, a growing threat of glacier lake outburst floods, more intense rainfall, and changes in monsoon and winter rainfall patterns are just some of the ways in which climate change is expected to affect Pakistan’s already stressed-water resources. These risks amplify an already problematic situation, given that Pakistan is among the most- water stressed countries in the world, i.e. per capita access to surface water (which is below 900 m3 per year) and groundwater sources are expected to continue to decline in the decades to come, driven largely by rapid population growth and urbanization in the country.
“The majority of Pakistan’s water is provided through the Indus River and its tributaries, which are fed primarily by snow and ice melt in the Hindu Kush-Karakoram-Himalaya Mountains. Any change in water flow in the Indus basin will have significant implications for food security in Pakistan given that 90% of total agricultural production occurs on arable lands supported by Indus Basin Irrigation System” [3]. The Indus basin water flows also play an important role in meeting irrigation domestic and municipal water supply needs, as well as supporting the country’s energy mix, manufacturing and industrial processes. An important source of water for hill and mountain people are springs, providing supply for irrigation and household use. There is anecdotal evidence from across the HKH region that many of these spring sources are drying up. However, it is not clear whether this is due to climate change, increased use or environmental degradation [4].
Spatial climate variability
The climate in Pakistan gradually increases in severity in the north-south direction, as shown in Figure 1, for rainfall [5]. But irrigation allowances are almost kept constant, particularly in Punjab. This is also the general flow direction of Indus Basin Irrigation System (IBIS) and canal commands. Thus, in general crop water demand increases and rainfall decreases in the head- tail end direction of the canal commands. Insufficient delivery of canal water in comparison to increasing cropping intensities and water demands has lead share of groundwater irrigation to be at par with canal supplies. This has given birth to groundwater mining problems and increasing irrigation costs in the tail-ends of the canal commands. More irrigation allocations towards the south depending on rainfall can ensure equity of irrigation costs and groundwater mining will be decreased.

Figure 1: Variation of annual normal rainfall in Pakistan [5]. 
Water allowance of the canals and actual diversions
Most of the canals in Bari Doab are perennial; however some of the branches, particularly along Sutlej River are non-perennial. Perennial water allowance and 10 year average of actual irrigation water diverted to the canals in Bari doab are given and plotted in Figure 2 and Table 1, but for some of the canals water allowance could not be found. However, it does not have any trend in d/s direction. Therefore, DTW is deep in d/s direction of Bari Doab and high or shallow in u/s areas. Because recharge to groundwater due to rainfall and canal supplies is less in the d/s direction of the Doab.
| Variables | Lower Bari Doab | CBDC | Upper Depalpur | Pakpattan | Lower Depalpur | Sidhnai Canal | Mailsi Canal |
|---|---|---|---|---|---|---|---|
| Water allowance | 3 | 3.22 | 3.60 | 3 | |||
| Depth (m) | 0.683 | 0.746 | 0.428 | 0.566 | 0.312 | 0.602 | 0.539 |
Table 1: Annual water diverted in Bari Canals.

Figure 2: Perennial Water allowance and 10 year average of irrigation diversions in Bari Doab canals. 
Situation in Bari Doab
The causes of groundwater depletion in Bari Doab most probably are as under;
• Stoppage of surface water flows in Ravi and Sutlej rivers.
• Enhanced groundwater pumping for agriculture and domestic usage.
• Population growth and limitation of groundwater resources.
In Bari Doab groundwater depletion is not due to over pumping in Indian Punjab because most of the recharge and discharge takes place in the vertical direction as shown by Basharat, et al. [6], that regional groundwater flow coming from India to Pakistan is still in its natural direction and very less as the groundwater movement is naturally very much slow. The oldest possible situation is shown in Figure 3, below, which shows that lower and central parts of Bari Doab area were having deep watertable as compared to upper areas, this is due to spatial climate variability [7].

Figure 3: Groundwater depth in Bari Doab in 1977 [7]. Note: Depth to water table 
According to post monsoon 2014 situation, more than 59.1% area of Bari Doab was having Depth to Watertable (DTW) below 12 m, another 27.3 % was having DTW between 6 m-12 m. Thus, only 13.59% area of Bari Doab had normal range of of DTW (<6 m). Keeping in view the continuous depleting conditions in Bari Doab, drainage Section of IWASRI studied the feasibility of "Developing Sukh-Beas as Potential Recharge Site during Wet Years for Bari Doab". For recharging the Bari Doab aquifer, the proposal is to divert the flood water from Balloki-Sulemanki and Sidhnai-Mailsi-Bahawal link canals into the Sukh-Beas channel, depending upon flood water availability in the river system and the carrying capacity of the channel itself [8].
Extensive groundwater development facilitated the increase in cropping intensity by addressing the ever increasing shortages in canal supplies due to sedimentation and also lowering the watertable, which also resulted in declining soil salinity. The Bari Doab is therefore a conjunctive use farming system, however, without any regulation by the government for long-term aquifer management. A comprehensive tubewell census in LBDC Canal of Bari Doab was carried out in 2005 by the Punjab Irrigation Department (PID) through its field staff under the guidance of NESPAK as consultants. The census provides the latest information on the numbers of tubewells, total operating hours and the total groundwater abstraction in both Rabi and Kharif on distributary commands basis. According to the survey, the reported number of tubewells were 48,102. The data was analyzed by NESPAK [9], and the total groundwater abstraction had been estimated as 4674 MCM (3.78 MAF) by NESPAK, 2005. Figure 4 shows the turbine pump with PTO arrangement in Chak No.60/12L in LBDC of Bari Doab Region.

Figure 4: Turbine pump with PTO arrangement in Chak No. 60/12L in Bari Doab Region.
If the over-exploitation of water resources, particularly the groundwater, is not controlled by avoiding over pumpage and misuse of the same, the decreasing groundwater level will naturally aggravate the current conflict on water shortage amongst the provinces as well as among various users’ at all local levels. Also there is another danger of rapid declining groundwater levels which can cause salt-water intrusion due to up-coning from underlying saline aquifer or lateral movement from saline to fresh zones. The major issue facing Pakistan in the coming years can be lack of management regime for groundwater, leading to rapidly falling groundwater levels and pollution of both surface and groundwater. All these issues have impact on agricultural production, food security and the overall ability of the Nation to improve the economic performance of irrigated agriculture sector.
Proposed re-allocation
The scope for the re-allocation of irrigation duties in Punjab has been investigated by Basharat, et al. [10]. The challenge in Punjab at this stage is the overuse of groundwater. Basharat, et al. [10], established that “there are only very few canals in Punjab that have excess supplies e.g. Muzaffargarh canal, but that in some of the larger canal irrigation water supplies can be better spread”. The big gains however are in Sindh, due to the high surface irrigation supplies in many of the canal commands, particularly Rice command. These high irrigation allocations-apart from giving rise to extensive waterlogging have created disincentives to farmers to use groundwater, even in areas where groundwater is fresh. Lessons can be taken from the drought years 1999-2002 when ‘less was enough.The irrigation duties should be set so to develop an optimum balance between surface water supplies and groundwater availability and usage and guidelines may be developed in support of this. This requires that surface water seepage is equivalent to groundwater use. It is postulated that more irrigation allocations towards south can ensure equity of irrigation costs and groundwater mining will be decreased.
The research process is based on the following steps;
Model development
A MODFLOW model was developed and calibrated in ModelMuse and Excel for the simulation of climate change and canal water re-allocation scenarios, as described by Basharat, et al. [11].
Climate change
Not any values i.e. change in river flows was available from the literature, so no changes in canal diversions were possible to be predicted. As no commendable increase or decrease in Indus flows is available from the literature, a decrease of 15% to 25% is thought to be possible in canal flows, a similar increase in groundwater pumping i.e. 15% to 25% is expected and simulated in the model. Similarly an increase of 15% to 25% in surface flows is possible; consequently a decrease in groundwater pumping of 15% to 25% is possible, which is also simulated in the model. It is assumed that total water usage remains the same. The aquifer is used as a cushion for water.
Re-allocation of canal water
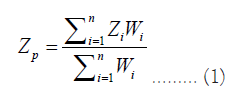
Recharge is reducing in the- d/s direction, particularly due to decreasing annual rainfall, which is due to reduced rainfall as shown in Figure 1 (for rainfall) and Tables 2 and 3 (recharge). This indicates that aridity of the climate increases in head to tail direction across the commands of Bari Doab. In view of the substantial variability of the climatic parameters and the elongated shape of Bari Doab commands in this direction, the Bari Doab commands area is divided into eight Hydrologically Similar Units (HSUs), considering similar hydrological conditions within each unit. These HSUs were digitized in GIS in consideration of distributary commands boundaries. Rainfall and ETo were interpolated for each HSU by Inverse Distance Weighting (IDW) interpolation as below:
| Sr. No. | Canal command name | Total recharge (m/day) |
|---|---|---|
| 1 | CBDC (HSU-1) | 0.000822609 |
| 2 | Upper Depalpur Canal (HSU-5) | 0.000672903 |
| 3 | LBDC-1 (HSU-2) | 0.000777397 |
| 4 | Lower Depalpur (HSU-6) | 0.000427921 |
| 5 | LBDC-2 (HSU-3) | 0.000725095 |
| 6 | Pakpattan (HSU-7) | 0.000354075 |
| 7 | Sidhnai (HSU-4) | 0.0006101058 |
| 8 | Mailsi (HUS-8) | 0.000424386 |
Table 2: Reduced recharge towards tail of Bari Doab calculated in Excel and calibrated in model in ModelMuse.
| Sr. No. | Canal command/HSU name | Recharge from field application (mm/year) | Recharge from rainfall (mm/year) | Total (m/day) | Found by model for equal recharge | Difference | % Re-allocation of canal water |
|---|---|---|---|---|---|---|---|
| 1 | CBDC | 174.24 | 126.01 | 0.0008226 | 0.0005865 | 0.000236 | 49.45 |
| 2 | Upper Depalpur Canal | 133.26 | 112.35 | 0.0006729 | 0.0005865 | 0.000086 | 23.65 |
| 3 | LBDC-1 | 215.07 | 68.68 | 0.0007774 | 0.0005865 | 0.000191 | 32.39 |
| 4 | Lower Depalpur | 97.04 | 59.15 | 0.0004279 | 0.0005865 | -0.000159 | -59.66 |
| 5 | LBDC-2 | 209.79 | 54.87 | 0.0007251 | 0.0005865 | 0.000139 | 24.11 |
| 6 | Pakpattan | 75.29 | 53.95 | 0.0003541 | 0.0005865 | -0.000232 | -112.70 |
| 7 | Sidhnai | 185.67 | 37.37 | 0.0006111 | 0.0005865 | 0.000025 | 4.82 |
| 8 | Mailsi | 114.76 | 40.15 | 0.0004244 | 0.0005865 | -0.000162 | -51.58 |
Note: Positive% Re-allocation of canal water should be decreased and negative % Re-allocation of canal water should be increased by given percentage.
Table 3: Reduced recharge towards tail of the Bari DOAB calculated in Excel and given to the model in ModelMuse and proposed values for canal water re-allocation.
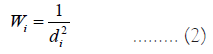
Where Zp=Interpolated value of the parameter at the desired location, Zi=Parameter value at the known point, Wi=Weight assigned to the known location; however equal weights were assigned to each HSU and n=no of sample points. The weighting function Wi is based on distance (d) between the center of HSU under consideration, and the meteorological stations as:
Canal water was re-allocated with two options i.e.
• With the recharge distributed equally all over Bari Doab and
• Recharge along with groundwater pumpage distributed equally all over Bari Doab.
Spatial climate variability in Bari Doab
The climate of the Bari Doab commands are characterized as hot summers and moderate and pleasant winters. Meteorological stations with long-term records are operated by Pakistan Meteorological Department (PMD) at Lahore, Faisalabad and Multan, located to the north-east, north and south-west of the command area, respectively. Each of these stations is about 50 km from the LBDC canal command boundary. Faisalabad is outside of Bari Doab, whereas Lahore is in CBDC, and Multan is in Sidhnai canal command. The maximum reported temperature for Lahore is 48°C and Multan is 49°C during the month of June. While, the minimum reported temperature for Lahore, Faisalabad, and Multan is -2.0°C, -4.0°C and -3.9°C, respectively, during the month of January. These results show that climate becomes more severe towards the tail of the Bari Doab commands both during summer as well as winter, as shown in Figure 5. The thirty years normal (1971-2000) values of rainfall and ETo (computed by PMD using the Blanney-Criddle method) of these stations were used to study the impact of climatic variation on irrigated hydrology across the spatial domain of the BARI DOAB commands. The average annual rainfall varies from 713 mm for Lahore in the northeast to 209 mm for Multan in Sidhnai command in the southwest and the ETo difference is 177 mm between the two stations (Figure 5).

Figure 5: Increasing aridity shown by met stations across the commands in Bari Doab. 
Climate change possibility
As no commendable increase or decrease in Indus flows is available from literature, a decrease of 15% to 25% was thought to be possible, a similar increase in groundwater pumping i.e., 15% to 25% of canal flows is expected and simulated in the model. Similarly, an increase of 15% to 25% in surface flows is possible; consequently a decrease in groundwater pumping of 15% to 25% of canal flows is possible which is also simulated in the model. It was assumed that total water usage remains same. The aquifer is used as a cushion or reservoir of water. The results are shown for increase and decrease both for rows 50 and 80 in Figures 6 and 7, respectively. Row 80 is close to River Sutlej; therefore DTW is shallow there.

Figure 6: Depth to Water table (DTW) Graph of Row 50 South-West (SW) to North-East (NE), due to the possibility of climate change for canals
of CBDC, LBDC, and Sidhnai. Note:  Decrease 25%.

Figure 7: Depth to Watertable (DTW) Graph of Row 80 South-West (SW) to North-East (NE), due to possibility of climate change for canals
of Upper Depalpur, Lower Depalpur, Pakpattan, and Mailsi. Note: 

Climate change possibility for canals of CBDC, LBDC and Sidhnai: For calibrated model, DTW was 16.0 m for average, minimum 0.508, and maximum was 25.3 m for row 50. For a 15% increase in canal flows DTW was 12.7 for average, minimum 0.466, and the maximum was 22.9 m. For a 25% increase in canal flows DTW was 4.18 for average, minimum 0.324, and the maximum was 14.0 m, because farmers pump less from groundwater in this case. A change of -11.8 m i.e. rise in groundwater was observed as a result of increased canal flows due to climate change.
For a 15% decrease in canal flows DTW was 23.2 for average, minimum of 0.625, and maximum was 36.7 m, For a 25% decrease in canal flows DTW was 28.2 for average, minimum 0.725, and the maximum was 44.8 m, for row 50 i.e. in canals of CBDC, LBDC and Sidhnai, because farmers pump more in case of less canal water availability. A 12.2 m depletion in groundwater levels from the calibrated model was found for canals along River Ravi in the simulation.
Climate change possibility for canals of upper Depalpur, lower Depalpur, Pakpattan and Mailsi: For row 80 of calibrated model DTW was 11.7 for average, -0.125 for minimum and 19.8 m for maximum. DTW was 8.58 for average, minimum was -0.143, and maximum was 15.6 m, for 15% increase in canal flows. And for 25% increase in canal flows DTW was 3.30 for average, minimum -0.214, and maximum was 6.8 m, for row 80. A -8.37 m i.e. rise in groundwater levels was simulated as a result of increased canal flows due to climate change.
For 15% decrease in canal flows DTW was 18.5 for average, -0.0871 for minimum and 28.6 m for maximum. For 25% decrease in canal flows, DTW was 23.2 for average, -0.0589 for minimum and 34.6 m for maximum for canals of upper Depalpur, lower Depalpur, Pakpattan and Mailsi, for row 80 of the model. A groundwater depletion of 11.5 m was simulated as a result of climate change for reduced canal supplies.
Canal water re-allocation
Canal water re-allocation with equal recharge only: For having equal recharge all over the Bari Doab, canal flows were re- allocated equally, and DTW was found to be 17.5 for average, the minimum was 0.495, and the maximum was 29.8 m for row 50, i.e. CBDC, LBDC, and Sidhnai canals. For these canals the DTW was 1.52 m deeper than the calibrated model for average, as the recharge was less than the existing recharge.
For row 80, DTW was found to be 9.28 for average, the minimum -0.127, and the maximum was 15.9 m, i.e. for upper Depalpur, lower Depalpur, Pakpattan, and Mailsi canals. The DTW improves for row 80 than existing conditions as the recharge is now better than existing conditions i.e. DTW was shallower by 2.39 m. However the DTW becomes deeper for row 50. The DTW becomes deeper for upstream areas, particularly CBDC where existing recharge to groundwater is more, particularly due to higher rainfall. However, equal recharge is recommended for Bari Doab to improve the existing conditions.
Canal water re-allocation with equal recharge and equal pumping: For more equity in DTW and recharge, it is assumed that pumpage will also increase in d/s areas due to increased recharge there, therefore, equal recharge and equal pumpage was assumed all over Bari Doab and also simulated in the model, DTW was found to be 15.4 for average, minimum 0.516 and maximum was 25.0 m for row 50 i.e., CBDC, LBDC and Sidhnai canals, with this option the DTW is shallower by 0.622 m for average. For row 80, DTW was found to be 13.0 for average, the minimum -0.123, and the maximum was 21.7 m i.e., for upper Depalpur, lower depalpur, Pakpattan, and Mailsi canals; for this option, the DTW was deeper by 1.32 m.
Naturally, DTW will be increased because of pumping was increased in the model, for Upper Depalpur, Lower depalpur, Pakpattan, and Mailsi canals. But now the graph of DTW becomes narrow now, i.e. DTW difference reduces than before, as is evident from comparison of Figures 8 and 9.

Figure 8: Depth to Watertable (DTW) Graph of row 50 and 80 (SW to NE) for equal recharge with equal recharge simulated in the model, throughout
Bari Doab. 

Figure 9: Depth to Watertable (DTW) Graph of row 50 and 80 (SW to NE) for equal recharge with equal pumpage and recharge throughout Bari
Doab.
However, it has not been possible to have equal DTW everywhere as the distance to rivers changes with the location. However, things can be improved with re-allocation of recharge which is dependent on canal water. Therefore, it is recommended to re- allocate the canal water for having equal DTW in Bari Doab (Figure 10).

Figure 10: Perennial and non-perennial channels in Punjab (digitized from the chart in Punjab Irrigation Department's Committee room in 2007).
Proposed canal water re-allocation values
Re-allocation of Canal Water is recommended based groundwater modeling and actual canal water deliveries that adds to groundwater recharge in addition to rainfall, values are given in Table 2. These are calculated based on differences of groundwater recharge in the canal commands i.e., canal and rainfall recharges combined.
Irrigation water distribution equity is explicitly assured at the design stage as well as during canal operations within a canal command. Whereas, in actual, mostly crop water requirement increases continuously in the downstream direction of the IBIS. Current approach of equitable canal supplies does reflect equity in supply management but leads to disparity in demand management. This kind of situation needs integrated water management, where in addition to canal water, rainfall and groundwater both have much importance attached to irrigation at the farm level. Following conclusions and recommendations are made based on the research:
• Rainfall continuously decreases in the d/s direction for Bari Doab as shown above.
• Similarly, crop water requirement increases.
• River recharge in the area ceased after IWT 1960. Only canal water had been replaced with Link canals, which is leading to reduced recharge.
• Canal supply depth for CBDC is more and less for Lower Depalpur Canal as compared to other canals in the Doab.
• As a result of canal water re-allocation, reduced pumping in the tail end will encourage recovery of groundwater levels and avoid long-term mining and availability of groundwater within the reach of the poor.
• Each area towards Lower and Central parts of Bari Doab should be supplied with more canal water as recommended in results. However, water allowance, along Sukh-Beas channel need to be increased more due to bad water quality and less recharge occurring there.
• Area along Sutlej River has been declared as non-perennial and they should be provided canal water all around the year, as the River Sutlej has about ceased to flow, consequently the recharge. Also the DTW had changed after its declaration as non-perennial.
• There is a need to recognize the connection between surface water and groundwater for the integrated management of hydrologically connected waters.
• For the present study, it was assumed that reallocated canal water could be supplied by changing the canal closure days at distributary levels, and channel hydraulics was not studied. It is therefore recommended to study in detail any modifications if needed i.e., in channel hydraulics and design of control structures.
• Environmental flows be allocated for Ravi and Sutlej Rivers for groundwater recharge, and canal allocations may be re-evaluated for equal DTW in the area.
Authors are highly thankful to IWASRI and Ministry of Water Resources for providing funds for the study.
There is no conflict of interest.
Citation: Basharat M, Jawad M (2023) Simulation of Canal Water Availability for Bari Doab in MODFLOW Calibrated Model. J Geol Geophys. 12:1142.
Received: 07-Aug-2023, Manuscript No. JGG-23-25963; Editor assigned: 09-Aug-2023, Pre QC No. JGG-23-25963 (PQ); Reviewed: 23-Aug-2023, QC No. JGG-23-25963; Revised: 30-Aug-2023, Manuscript No. JGG-23-25963 (R); Published: 06-Sep-2023 , DOI: 10.35248/2381-8719.23.12.1142
Copyright: © 2023 Basharat M, et al. This is an open-access article distributed under the terms of the Creative Commons Attribution License, which permits unrestricted use, distribution, and reproduction in any medium, provided the original author and source are credited.