Journal of Geology & Geophysics
Open Access
ISSN: 2381-8719
ISSN: 2381-8719
Research - (2022)Volume 11, Issue 2
Structural interpretation of 3D seismic data from the onshore eastern part of Coastal Swamp Depobelt of the Niger Delta was carried-out to identify and characterize the hydrocarbon entrapment structures present in the field. The standard method of fault identification, which was also aided by the application of some seismic volume attribute such as structural smoothing, variance edge, etc., delineation of horizons on the seismic volume, generation of time and depth maps, were utilized in this study. A total of thirty-two (32) growth faults (F1 to F32), each trending and dipping in various directions, were identified, from where faults model of the field has been generated. Three horizons were delineated at shallow, intermediate and deeper levels. Faults polygons were incorporated into the horizons which were then used to generate a time map that was converted to depth maps using the available check shot data. The dominant structures that may possibly trap hydrocarbon in the field are faulted rollover anticlines.
3D seismic; Seismostructural; Growth faults; Faulted rollover anticlines
Seismic reflection method is widely applied to exploration problems involving the detection and mapping of subsurface boundaries of, normally, simple geometry. The method is particularly suited for mapping of layered sedimentary sequences and is therefore widely used in the search for oil and gas.
The Niger Delta covers an area of approximately 75,000 km2 and consists of a regressive clastic sequence of sands and shales, which attains a maximum thickness of 12,000 m [1]. The region has been the scene of intensive studies in the recent past because of its economic potential as a petroliferous province. Several authors have discussed the various aspects of the Niger Delta [2- 6]. However, this critical assessment requires proper understanding of structural styles, reservoir compartmentalization, fault seals and reservoir communication which are basic exploration targets in the Niger Delta. The objective of this study, therefore, is to carry out structural interpretation of the sub-surface geology of the study area from seismic reflection data.
The field of study is located on the onshore eastern Coastal Swamp Depobelt of the Niger Delta (Figure 1), which is a large arcuate tertiary prograding sedimentary complex which owes its origin and present framework to the results of rifting episodes that separated Africa from South America and subsequent opening of the South Atlantic that started in the Late Jurassic and persisted to the Middle Cretaceous [7].

Figure 1: (a) Geologic map of Nigeria, showing the Niger Delta complex and the study location. (b) Map of Niger Delta, showing the depobelts and the location of study area in the eastern part of Coastal Swamp Depobelt.
Well sections from the delta generally display three broad vertical subdivisions representing prograding depositional facies that are typical of most deltaic environments (Figure 2). They include; a continental shallow marine massive sand sequence the Benin Formation (Oligocene/Miocene to Recent), a coastal marine sequence of alternating sands and shales the Agbada Formation (Eocene to Recent), and a basal marine shale unit-the Akata Formation (Paleocene to recent) [8]. Growth faults are the most common structural features observed on seismic sections of the Niger Delta [9]. Associated with this structure building faults are rollover anticlines. Petroleum in this basin is produced from sandstones and unconsolidated sands predominantly in the Agbada Formation, often stacked, ranging from less than 10 m to 45 m in thickness [5]. Ejedawe, et al. considered both the Akata and Agbada shales as source rocks with the former as the main contributor [10]. Anticlines associated with growth faults are by far the most abundant structural traps in the basin (Figure 3) and are formed as a result of synsedimentary deformation [11-14]. The complexities are however, more pronounced in the shelf, giving rise to large scale structural deformation, which requires critical assessment and understanding of trapping mechanism for more optimum development of fields [15].

Figure 2: The stratigraphic column of the Niger Delta. Note: 
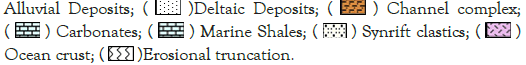

Figure 3: Trap styles found in the Niger Delta.
Materials
The materials used for this study were provided by Shell Petroleum Development Company (SPDC) and consists of a rectangular grid of 3D Post-Stack Migrated seismic data which extends up to 6,000 milliseconds TWT (two-way travel time) and covers an area of 178 km2 with 673 inlines trending north to south, spaced 25 m apart, and 425 crosslines trending east to west and spaced 25 m apart. Figure 4 shows the base map of the area. The length of each of the inlines and crosslines are 10.6 and 16.8 km, respectively. The data is provided in ZGY seismic bricked format with a variable density display (Figure 5). The software used for this study is the Schlumberger’s Petrel software (2014) version.

Figure 4: Basemap of the study area, showing the representative northsouth oriented inlines and east-west oriented crosslines.

Figure 5: Example of crossline (1226), inline (7084) and time-slice (3192.00 ms) sections of the seismic data used for this study.
Methods
Picking of faults: Identification of faults on the seismic volume were based on the misclosures in tying reflection around loops, vertical displacement of reflections and reflection discontinuity at faults plane. This was also aided by the application of some seismic volume attributes (such as structural smoothing, amplitude variance, etc.) for better visualization of the faults (Figure 6). The faults were traced iteratively on the inlines and intersecting crosslines sections and corrected for misties. However, the faults become less apparent in the upper (0-1,500 ms two-way time, TWT), and lower (3,500-6,000 ms) parts of the seismic volume, where they have been obscured by the chaotic nature of these parts.

Figure 6: (a) Time-slice display at 1872 ms TWT. Application of amplitude variance volume attribute, makes the faults become more apparent. (b) Structural smoothing attribute applied to an inline section of the seismic data for better visualization of the faults.
Picking of horizons: Three horizons were picked at shallow (approximately 1588.76 ms TWT), intermediate (approximately 2049.92 ms TWT) and deep (approximately 2403.43 ms TWT). These are designated as horizons 1 (H1), 2 (H2) and 3 (H3) respectively (Figure 7). H1 corresponds to the trough while H2 and H3 correspond to the peak of the seismic data.

Figure 7: Inline 6965 of the seismic data showing the three horizons (H).
Generation of time and depth-structure maps: The faults polygon were incorporated into the time maps generated from the three horizons and converted to depth-structure maps using the timedepth relationship (TDR) (Figure 8) obtained from the checksot data made available for the field.

Figure 8: Time-depth relationship of checkshot data obtained from a well (W1) that penetrates the field (see figure 4 for location of the well).
Description of faults: Thirty-two growth faults (F1, F2,…, F32) were mapped (Figure 9), each trending and dipping in various directions. Faults model were also generated (Figures 10 and 11). Table 1 summarizes the trend and dip directions of the faults. The largest and most prominent is the F1 major growth fault, which is located at the southeastern part of the field, and interpreted to be a structure-building fault that define or bound the up-dip limits of depobelts [5]. Throws of the faults generally ranges from 20 ft to 200 ft.
| FAULTS | TREND | DIP |
|---|---|---|
| F1 | Northeast–southwest | Southeast |
| 237° | ||
| F2 | Northwest–southeast | southwest |
| 104° | ||
| F3 | East–west | South |
| 90° | ||
| F4 | Northeast–southwest | Southeast |
| 253.7° | ||
| F5 | East–west | North |
| 90° | ||
| F6 | Northeast–southwest | Southeast |
| 257° | ||
| F7 | Northeast–southwest | Southeast |
| 237° | ||
| F8 | Northeast southwest | Southeast |
| 246° | ||
| F9 | Northeast–southwest | Southeast |
| 245.5° | ||
| F10 | Northeast–southwest | Southeast |
| 251° | ||
| F11 | East–west | North |
| 90° | ||
| F12 | Northwest–southeast | Southwest |
| 112° | ||
| F13 | Northwest–southeast | North |
| 100° | ||
| F14 | East–west | North |
| 90° | ||
| F15 | Northwest–southeast | Southwest |
| 138° | ||
| F16 | Northwest – southeast | Southwest |
| 128° | ||
| F17 | Northwest – southeast | Southwest |
| 144° | ||
| F18 | Northeast–southwest | Southeast |
| 240° | ||
| F19 | Northwest–southeast | Southwest |
| 123° | ||
| F20 | Northeast–southwest | Southeast |
| 261° | ||
| F21 | Northeast–southwest | Southeast |
| 254° | ||
| F22 | Northeast–southwest | Southeast |
| 258° | ||
| F23 | Northeast–southwest | Southeast |
| 245° | ||
| F24 | East–west | South |
| 90° | ||
| F25 | Northwest–southeast | Southwest |
| 104.4° | ||
| F26 | Northeast–southwest | Southeast |
| 259° | ||
| F27 | Northwest–southeast | Southwest |
| 129° | ||
| F28 | Northwest–southeast | Southwest |
| 142.6° | ||
| F29 | Northeast–southwest | Southeast |
| 259° | ||
| F30 | Northwest–southeast | Northeast |
| 141° | ||
| F31 | East–west | North |
| 90° | ||
| F32 | Northwest–southeast | Southwest |
| 123° |
Table 1: Trend and dip directions of the mapped faults.

Figure 9: Time slice display at -1872 ms (TWT), showing fault sticks of the identified growth faults.

Figure 10: Time slice section (-1872 ms TWT) of variance edge attribute showing the generated faults (F) model.

Figure 11: (a) Time slice section (-2096 ms TWT) of variance edge attribute showing the faults, and (b) inline section 7069 of structural smoothing showing the intersected faults (F1, F2, F3 and F5).
Time-and depth-structure maps: Figure 12 shows an interpreted section of the seismic volume. Horizon 1 (H1) is a shallow reflector which has a well-defined character in some parts with time and depth ranges between -1600 to -2000 ms TWT (Figure 13a) and -5790 to -7540 ft (Figure 13b), respectively. The surface is intercepted by twelve (12) growth faults (F1, F2, F3, F13, F14, F15, F16, F18, F19, F20, F24 and F25) and becomes deeper at south and southwestern parts.

Figure 12: Interpreted section (inline 6965) of the seismic section showing some of the faults and the horizons (H).

Figure 13: (a) Time- and (b) depth-structure map of horizon 1 (H1) showing the intercepted faults (F).
Horizon 2 (H2) is an intermediate reflector with time and depth ranges between -2050 to -2950 ms TWT (Figure 14a) and -8120 to -11620 ft (Figure 14b), respectively. It is intercepted by sixteen (16) growth faults (F1, F2, F3, F4, F5, F6, F7, F8, F9, F10, F11, F13, F24, F25, F29, and F31) and dips towards the south, becoming deeper at the southwestern part.

Figure 14: (a) Time- and (b) depth-structure map of horizon 2 (H2) showing the intercepted faults (F).
Horizon 3 (H3) is a deeper reflector with time and depth ranges between -2300 to -3200 ms TWT (Figure 15a) and -9120 to more than 11620 ft (Figure 15b), respectively. The southwestern part shown as “NO DATA” means the absence of checkshot data (used to convert time to depth maps) at depths greater than 11620 ft. The surface is intercepted by seven (7) growth faults (F1, F2, F3, F4, F6, F21 and F29) and dips towards the south, becoming deeper at the southwestern part.

Figure 15: (a) Time- and (b) depth-structure map of horizon 3 (H3) showing the intercepted faults (F).
The study reveals a field characterized by a complex system of synsedimentary growth faults formed by the rapid sedimentation load and the gravitational instability of the Agbada sediment pile accumulating on the mobile underlying undercompacted Akata shales.
Thirty-two major growth faults were mapped, although other smaller antithetic faults occur. The faults are designated as F1, F2,…, F32, with throws ranging from 20 to 200 ft. However, these faults become less apparent and obscured at shallower upper part of the field, probably due to unconsolidated sediment cover, and at deeper levels, due to the highly discontinuous and chaotic character of the seismic at this level where the faults in the upper part tend to sole out. This character of the seismic is caused by the upward movement of the undercompacted, overpressured and mobile shale of the Akata Formation which has disrupted the initially continuous reflections. The F1 major growth fault, located at the southeastern part of the field, is a structure-building fault which bound or define the updip limits of depobelts [5]. Hence, this fault marks the limit of the Coastal Swamp Depobelt at the southeastern part of the field. Strata on the hanging wall side of these faults tends to be tilted towards the fault plane forming rollover anticlines on the hanging wall sides of these faults, cut by numerous smaller antithetic crestal and antithetic faults. These structures are often associated with probable hydrocarbon accumulations. Three horizons were picked at shallow, intermediate and deeper levels. These horizons were then converted to depth maps using velocities (from checkshot data from the well that was made available) with the fault polygons incorporated. The depth maps reveal probable prospect zones enclosed by faults.
Seismostructural interpretation of a field in the Niger Delta was carried out using a 3D Post-stack migrated seismic data. The field is characterized by a complex system of growth faults. Thirty-two growth faults were mapped and designated as F1, F2… and, F32. These structures form the major hydrocarbon traps in the Niger Delta. Three horizons, which are intercepted by the faults, were also picked at shallow, intermediate and deeper levels. These horizons are characterized by medium to high amplitude, strong to moderate reflection strength and good reflection continuity which suggest widespread and uniform deposition of clastic sediments with thick sand facies and interbedding shales which is characteristics of hydrocarbon reservoirs in the Niger Delta.
The author wish to thank the Department of Petroleum Resources (DPR), Nigeria and Shell Petroleum Development Company (SPDC) for providing the data sets and Petrel workstation used for this study.
Citation: Ezekiel UU (2022) Seismostructural Interpretation of “Bridge” Field in the Onshore Niger Delta. J Geol Geophys. 11:1017.
Received: 04-Feb-2022, Manuscript No. JGG-22-15754; Editor assigned: 07-Feb-2022, Pre QC No. JGG-22-15754 (PQ); Reviewed: 21-Feb-2022, QC No. JGG-22-15754; Revised: 25-Feb-2022, Manuscript No. JGG-22-15754 (R); Published: 03-Mar-2022 , DOI: 10.35248/2381-8719.22.11.1017
Copyright: © 2022 Ezekiel UU. This is an open-access article distributed under the terms of the Creative Commons Attribution License, which permits unrestricted use, distribution, and reproduction in any medium, provided the original author and source are credited.