Journal of Geology & Geophysics
Open Access
ISSN: 2381-8719
ISSN: 2381-8719
Research Article - (2013) Volume 2, Issue 2
Critical property that affects wellbore stability, perforation depths and hydraulic fracturing is Poisson’s Ratio (PR). Porosity and resistivity are the main petrophysic properties routinely are measured for any reservoir rock. In this approach utilize wireline data (GR, R, Øn and ρb) to classify shaly reservoir and predicate PR values. Therefore, range of shale content (over 20%) has PR over 0.2. while shale content (less than 20%) equivalent to PR equal to 0.18. According to variety of shale content percentage throw up change of PR values. This technique applied on one of major shaly sand reservoir rock, producer in Libyan oil fields, Hawaz at Murzuq basin, south-west of Libya; as a case study.
Keywords: Shale content indicator (IGR); Poisson’s ratio (PR); Deep resistivity (Rd); Neutron log (Øn); Density log (ρb)
The silty nature of reservoir, erratic GR response, thin sand/ shale alternations and generally higher neutron porosities make the deterministic interpretation techniques unsuitable for the realistic computation of water saturations. The computed shale volumes are higher and inconsistent with production profiles of wells. The computed effective porosities are pessimistic because of higher shale volumes.
In the evaluation process of shale formations, the determination of shale volume is very important for porosity and fluid saturation computing. In addition main Dynamic elastic (Geomechanical) rock properties, special those uses or depend on shear velocity which is do not measured over a reservoir. However, presence of different distribution shale content of clastic reservoir cause varied of these properties.
Presence of clay materials in formations cause resistivity log unclear and could not discrimination between reservoir fluid content [1]. Neutron and density logs have different attribute of shale distribution within formations and their response. Therefore, neutron log need correction more than density log as a porosity log [2]. Therefore, using different logs to estimate and subdivide of shaly sand reservoir using the Poisson’s Ratio with deep resistivity logs are the main task of this study and a combination of Neutron-porosity and Bulk Density logs is the main task of this work. Hawaz is one of main and common shaly sand reservoir in southwest of Libya, which is selected in this work.
Kristensen et al. [3], deal with a correlation technique based on an integration of biostratigraphic data, seismic interpretation, and wireline log correlation; this technique aims at producing a consistent reservoir subdivision that honors both the well data and the seismic data. Their study based on core samples from eight wells of Maastrichtian chalk in the Dan field and (North Sea) and integrating the biostratigraphic results with three-dimensional seismic data allows recognition of four stratigraphic units within the Maastrichtian chalk reservoir. The adding of wireline log correlations, establish a total of nine reservoir units. The benefit of this approximate chronostratigraphic nature of these units provides an improved interpretation of the depositional and structural patterns in this area.
Ramos et al. [4], reported the Middle Ordovician Hawaz Formation is a 200-m (660-ft)-thick succession made up of fine-grained quartzarenites displaying a variable degree of bioturbation. They defined 11 lithofacies, forming 6 facies associations. These associations are subtidal sandstones; storm-reworked, shore face sandstones; shore face-to-beach sandstones; channel-sandstone bodies; near shore to inner-platform sandstones; and K-bentonites. Trace-fossil assemblages match Skolithos and Cruziana archetypal ichnofacies. Therefore, considering lithofacies, bioturbation, facies associations, the geometry of the sedimentary bodies, and gamma ray response, three mappable, informal lithostratigraphic units have been differentiated from base to top, these are the lower, middle, and upper units (HW.1, HW.2 and HW.3, respectively). This interpretation obtained from the outcrops data of the Gargaf zone which are in agreement with Davidson et al. [5], work based on seismic data. Also, the study presents the volume loss by compaction, sedimentation rate and calculates the tectonic subsidence by the back stripping method.
The Gamma ray index option was employed to determine the percentage of shale and implicitly, the dominant lithology. This was achieved by determining the clean sand line from Gamma ray logs.
Volume of shale is the main parameter calculated and this parameter also served as an input data in the porosity and saturation model for shaly sand. Calculation of the gamma ray index is the first step needed to determine the volume of shale from gamma ray log [6], as shown in formula (1).
 (1)
(1)
Where:
IGR =Gamma ray index (API).
GR =Gamma ray log reading (API).
Poisson’s ratio (PR) can be calculated from the P- and S-wave elastic-wave velocities which are routinely measured in the laboratory and/or well. This elastic property (PR) could compute by known shale content (IGR); when shear travel time (Δts) is not known (measured), which is the case in this studied reservoir (Hawaz), a value for Poisson’s ratio can be estimated by the following formula in shaly sands [7].
PR = 0.125 * IGR + 0.27 (2)
Crain [7], stated a high Poisson’s ratio indicates high stress level, which in turn indicates possible boundaries to a hydraulic fracture. Low Poisson’s ratio indicates weak zones which may not constrain the fracture job, resulting in communication to undesired formations. Most shale constrains fractures but some may not do so. Two to three meters of rock with a Poisson’s Ratio greater than 0.26 is the minimum needed to constrain a typical hydraulic fracture.
Hawaz reservoir (Upper Ordovician) has approximately over 600 feet in thickness. In some discovered and exploration fields, this studied reservoir is consist of marine cross-bedded quartizitic sandstones, in part kaolinitic, with thin shaly intercalations and with intense bioturbation (skolithus) suggesting high-energy environments of deposition. In addition to divided it into three units, from base to top: zone 1, zone 2 and zone 3.
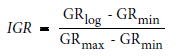
This procedure of this technique is applied over many fields producer from the studied reservoir. The gamma ray log is a lithology log, which is used for division of Shaly sand reservoir. Slightly graduation change of gamma ray log easily recognized when correlate with neutron and density logs. The computed PR and deep resistivity log compared to those logs (Figure 1). Therefore, there are three zones. Variation of elastic property (PR) in zone 1 and 3 associated with increase of shale content, while stable of PR occurred along clean zone (2). It is noticeable in each zone 1 and 3 variation of PR pattern, possibly indication to a different fluid (water) fill the pore space (Ø) in these zones. More explanation showed by Figures 2 and 3 for the zones 1 and 3.
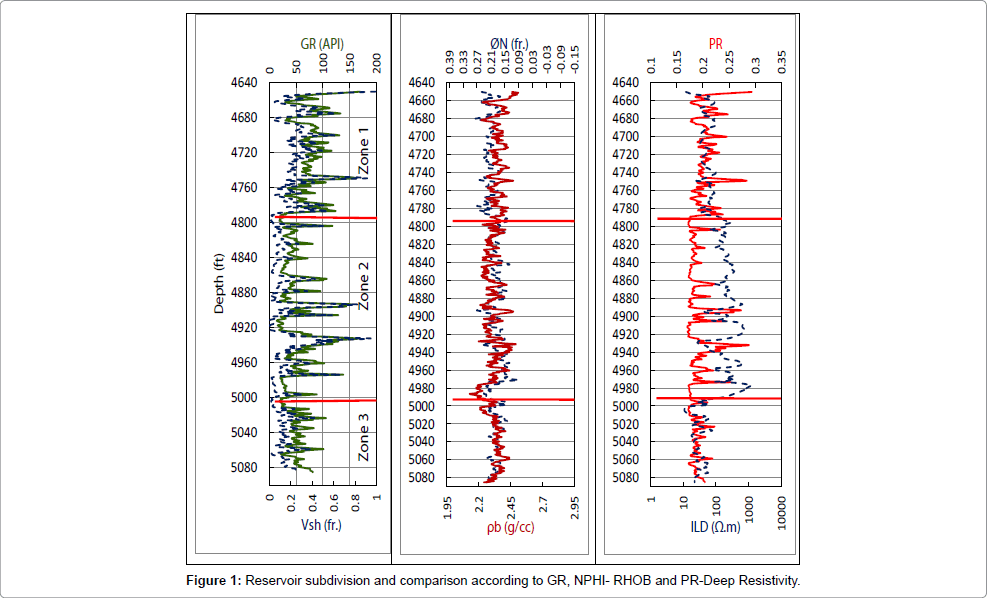
Figure 1: Reservoir subdivision and comparison according to GR, NPHI- RHOB and PR-Deep Resistivity.
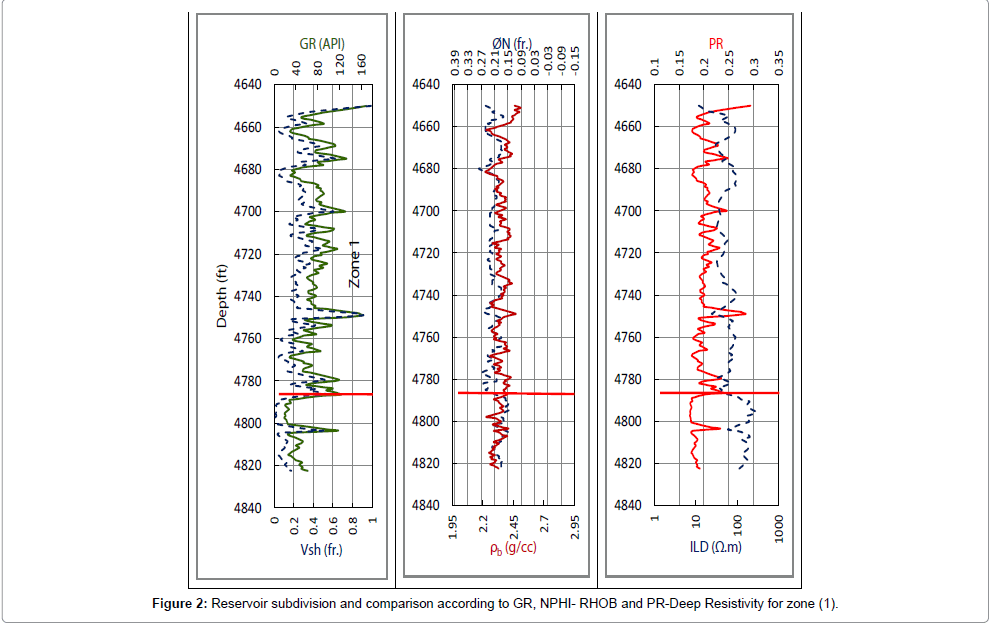
Figure 2: Reservoir subdivision and comparison according to GR, NPHI- RHOB and PR-Deep Resistivity for zone (1).
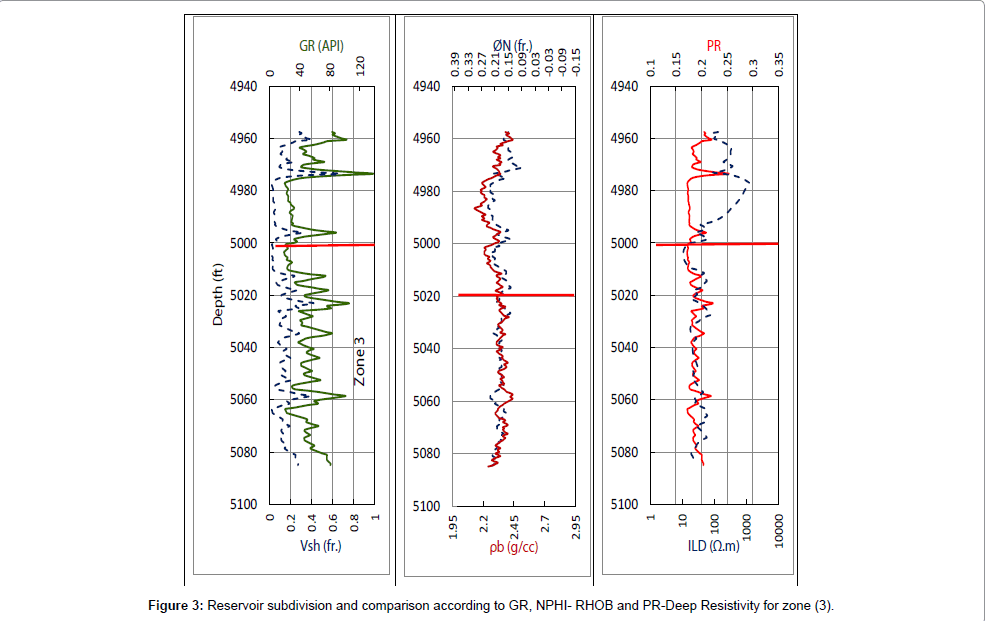
Figure 3: Reservoir subdivision and comparison according to GR, NPHI- RHOB and PR-Deep Resistivity for zone (3).
The present approach gives predicate of the dynamic elastic property (PR) of Hawaz reservoir depends on amount of shale content and comparative with the deep resistivity. However, this subdivision reveal importance of overlay calculated PR’s values and deep resistivity within shaly reservoir intervals. Therefore, graduation increment of the calculated PR’s values is conformable with volume of shale increase, from 0.16 to 0.2. Whereas, clean reservoir intervals recognize by separation between PR’s and deep resistivity and non variety of PR’s. Concentration of shaly reservoir intervals which they have about 40 % of shale content and present a quick look procedure helping reservoir engineering studies to choose early stage of reservoir developments strategic, that is include well stability and perforation design according to primary estimation of PR’s and subdivision of reservoir interlayering.