Journal of Geology & Geophysics
Open Access
ISSN: 2381-8719
ISSN: 2381-8719
Research - (2021)Volume 10, Issue 1
The Nile Delta occupies the northeastern part of the African continent and it is one of the world’s classic deltas. The present-day delta has passed through different events as part of the regional tectonics in the Mediterranean area which has shaped many of its physiographic features. This area is now regarded as major gas province and one of the most promising areas for future petroleum exploration. In 2010, the U.S. Geological Survey estimated means of 1.8 billion barrels of recoverable oil, 223 trillion cubic feet of recoverable gas, and 6 billion barrels of natural gas liquids in the Nile Delta Basin Province using a geology-based assessment methodology.
Petroleum exploration; Geology; Physiographic; Natural gas; Recoverable oil
Initially exploration was focused on onshore Messinian incised valleys with offshore discoveries being made as an extension of this play with ongoing development activity focusing on Pliocene deep-water reservoirs [1,2].
The investment of international gas and oil companies in Egypt 2003 was estimated to be approximately $2 billion with natural gas being the fastest growing sector [3]. The West Delta Deep Marine (WDDM) concession (Figure 1) was acquired by BG Group and partners Edison Gas in 1995 and is concession in which the Scarab field is found.
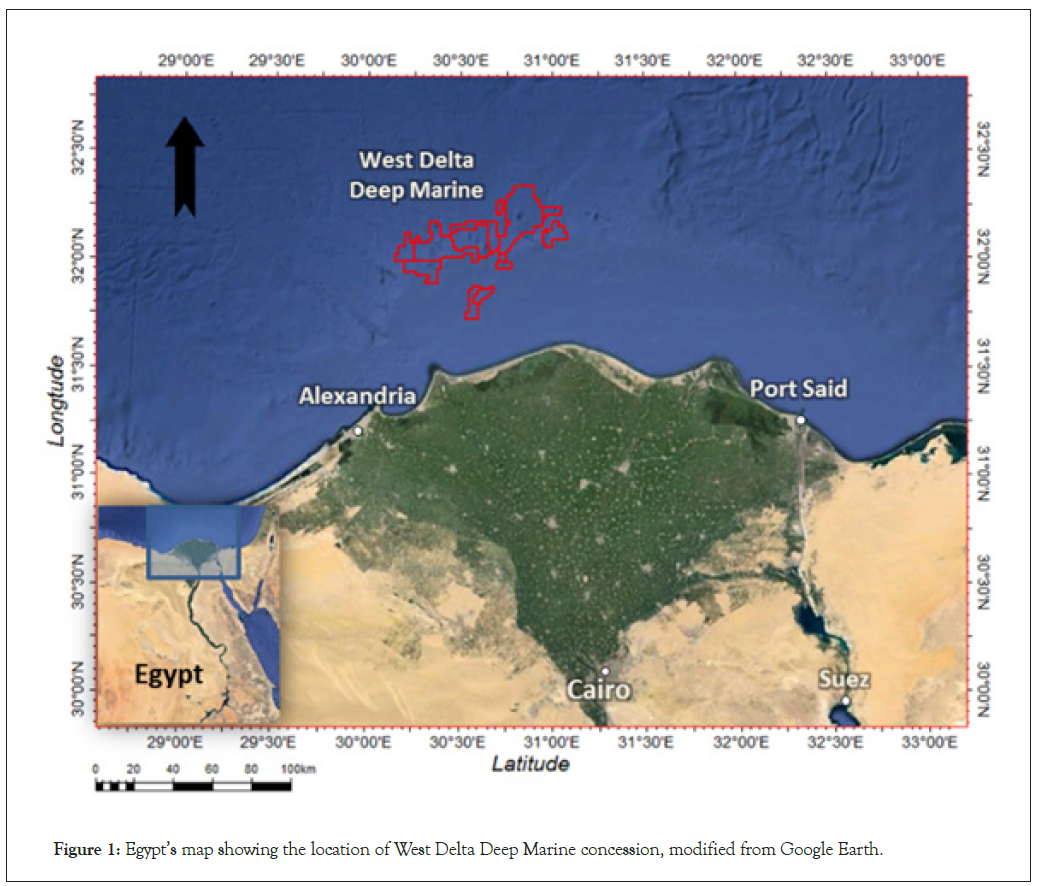
Figure 1. Egypt’s map showing the location of West Delta Deep Marine concession, modified from Google Earth.
The WDDM concession lays 50-100km offshore Egypt and covers 6150km² of the North West margin of the Nile cone. The initial exploration wild cat success ratio was 1:3.6, higher than the international norm [3], with thirteen consecutive exploration and appraisal wells being successfully drilled on nine separate fields [1].
The Nile Delta offshore area is rapidly emerging as a major gas province. High-quality three-dimensional (3D) seismic data, coupled with data from many consecutive successful deep water exploration and appraisal wells, have highlighted clear phases of erosion and deposition within the upper Pliocene deep-marine slope channels [1]. The Simian field is believed to be a slope channel complex deposited on the Nile delta slope in the early Pliocene within El- Wastani package (Figure 2). The structural setting of the WDDM area shows that it is a fault bounded block with complex interplay among three main fault trends; the Southwest-Northeast trending Rosetta fault in the Southeast, large East-West faults in the Northeast with rotated fault blocks making the Northwestern boundary [4]. The Rosetta fault is the largest in the region, a major SW-NE orientated extensional to strike-slip fault probably active during Pliocene reservoir deposition [3].
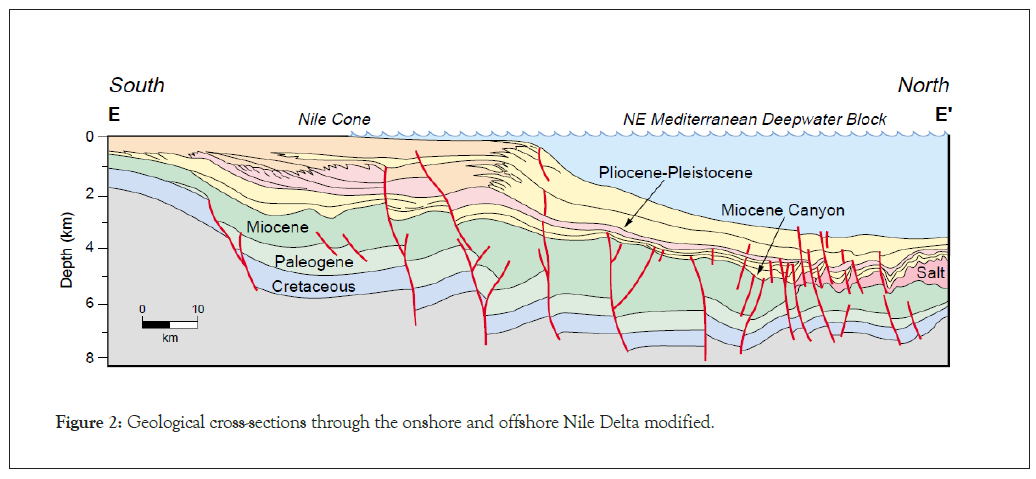
Figure 2. Geological cross-sections through the onshore and offshore Nile Delta modified.
Basement controlled faults, inherited from Tethyan rifting were important during the pre-Pliocene [5] prior to when much of the high quality reservoir sands were deposited (Figure 3). On top of this, active subduction of the Northern margin of the African plate had been occurring since the late Cretaceous along the destructive compressional plate boundary of Crete and Cyprus [4]. These regional features combine to create the ideal conditions for potential trap formation in the region such as uplifted arches and local strike-slip grabens [5].
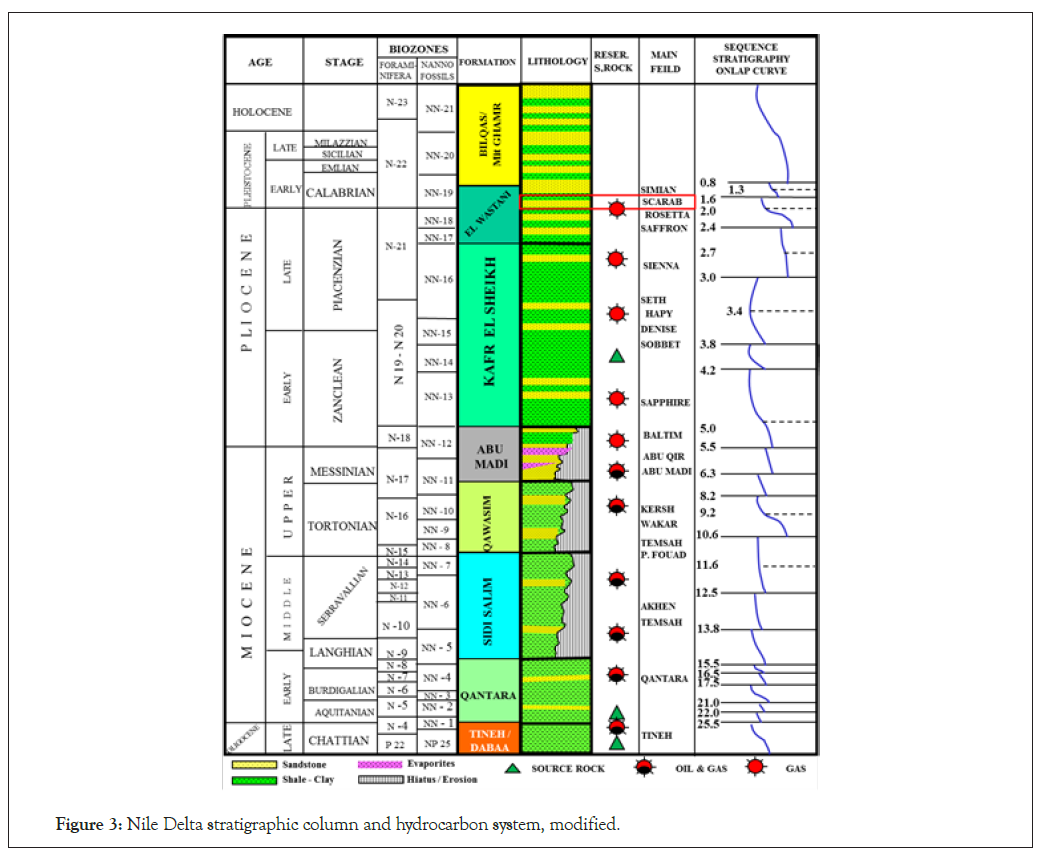
Figure 3. Nile Delta stratigraphic column and hydrocarbon system, modified.
The reservoirs consist of complex submarine channel systems exhibiting strong lateral variations, thin bedding, variable sand distribution and a variety of channel architecture (Figure 4). Sands are likely to be unconsolidated, have excellent reservoir quality and porosity in the range of 24%-36% [4].
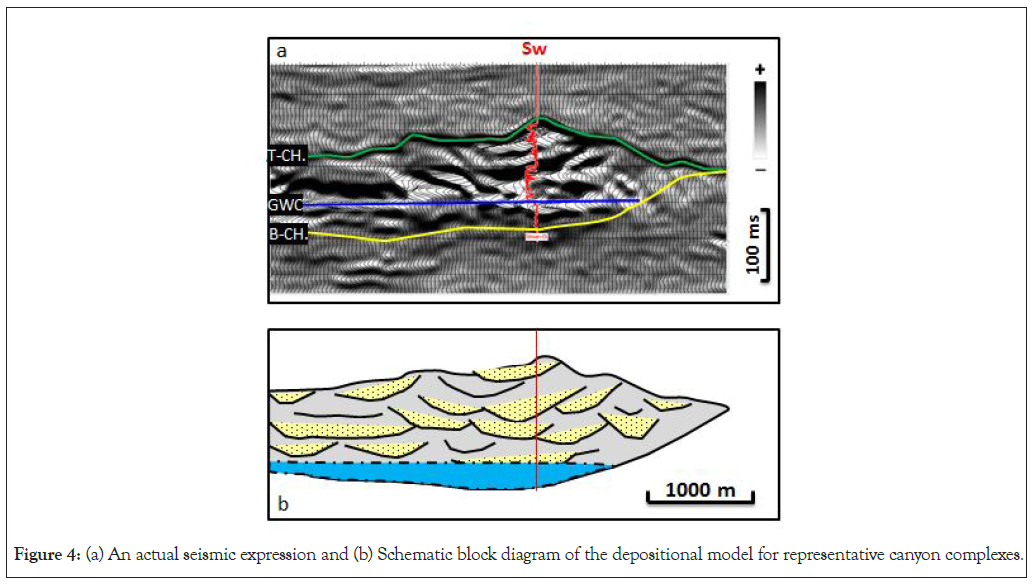
Figure 4. (a) An actual seismic expression and (b) Schematic block diagram of the depositional model for representative canyon complexes.
The available data for this study are sorted into well-logs and seismic data. The well-logs are: P-wave velocity (Vp), S-wave velocity (Vs), and density (ρ) logs for Five wells Other attributes as λρ were calculated from the original logs. The seismic volumes are partial angle stacks 3D seismic volumes (near, mid, far and ultra-far angle stacks). Pre-stack inversion technique shows impressive results in delineating the gas-bearing reservoirs, especially in clastic systems.
Spectral decomposition has become a well-established tool that helps in the analysis of subtle stratigraphic plays and fractured reservoirs. As the name suggests, spectral decomposition decomposes the seismic data into individual frequency components that fall within the measured seismic bandwidth. As predicted, the near-angle stack has higher frequency content than the other angle stacks and even the full-angle stack. Though, the near-angle stack contains a high level of noises compared with the others. We tried to reduce the noises using structural-oriented filters; the difference was minor with few enhancements achieved (Figure 5). The near-angle stack spectral decomposition volume was used to delineate the incised channels and faults inside the main canyon. The near angle stack gave the optimum resolution and showed the fine details of the channels’ internal architecture. With the help of the variance volume, the Simian’s internal architecture becomes very clear.
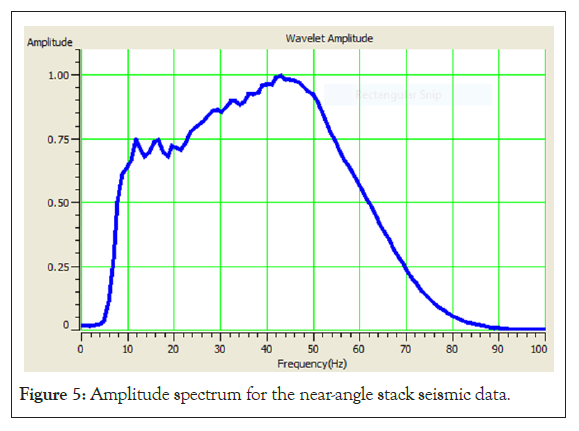
Figure 5. Amplitude spectrum for the near-angle stack seismic data.
We used the Cyan-Magenta-Yellow (CMY) color blended maps; where each color corresponds to a specified frequency range. The three frequency ranges are: 10 Hz (the lowest frequency range in the seismic dataset) in Cyan color, 35 Hz (the dominant frequency in the seismic dataset) in Magenta color, and 65 Hz (the highest frequency range in the seismic dataset) in Yellow color (Figure 6). The filtered (background removed) spectral decomposition volume was then used to extract channel geobodies (Figure 7). The extracted geobodies were very helpful for both static model building and the GIIP calculation.
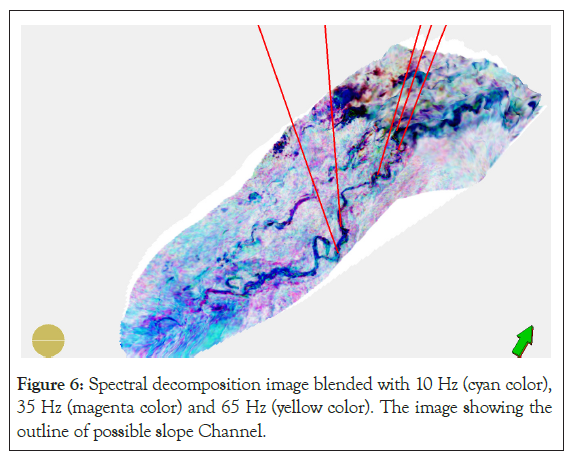
Figure 6. Spectral decomposition image blended with 10 Hz (cyan color), 35 Hz (magenta color) and 65 Hz (yellow color). The image showing the outline of possible slope Channel.
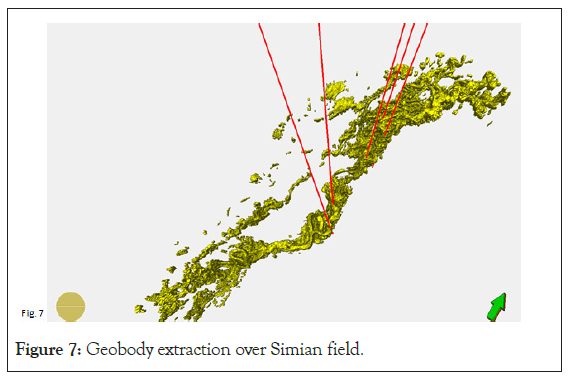
Figure 7. Geobody extraction over Simian field.
Seismic inversion is recovering earth properties or extracts additional information from seismic data. In general, inversion increases the resolution of conventional seismic data and in many cases puts the study of reservoir parameters at a higher level. Various types of inversion have been defined over the years each with its own strengths and limitations. Input data required for an inversion includes; time/depth-migrated pre/post-stack data, a wavelet, an initial earth model and picked horizons in TWT [6].
The pre-stack inversion can simultaneously invert for P-impedance, S-impedance or Vp/Vs, and density using angle limited stacks of the seismic data. The AVO inversion algorithm is an iterative process which starts with an initial guess model, and proceeds to modify it in a series of steps. Each step is guaranteed to produce a synthetic match seismic data at least as good as the previous step. The initial guess model can be critical in determining the final result.
The algorithm is a linearized solution. This means that the possibility exists for the algorithm to become “trapped” in a local minimum. The consequence is that the initial guess needs to be reasonably close to the right answer. Also, one of the inversion problems is the non-uniqueness. This is not a function of the particular algorithm, but rather a consequence of the real data we are using to do the inversion-band limited P-wave seismic data.
Using the partial angle stacks of near (0°-10°), mid (10°-20°) far (20°-30°) and ultra-far (30°-40°) (Figure 8) with proper deterministic wavelets (Figure 9), the pre-stack inversion estimates P-impedance (Zp), S-impedance (Zs). Simultaneously with these volumes, Vp, Vs and Vp/Vs volumes were computed as well as the Lame parameter volumes of lambda-rho (λρ) and mu-rho (μρ). It starts from an initial low frequency model of P-wave velocity, S-wave velocity and density (Figure 10).

Figure 8. An inline through Simian field shows the seismic data of (a) Near-angle stack, (b) Mid-angle stack; (c) Far-angle stack and (d) Ultra-Far-angle stack seismic volumes. The same horizontal scale is applied for all sections.
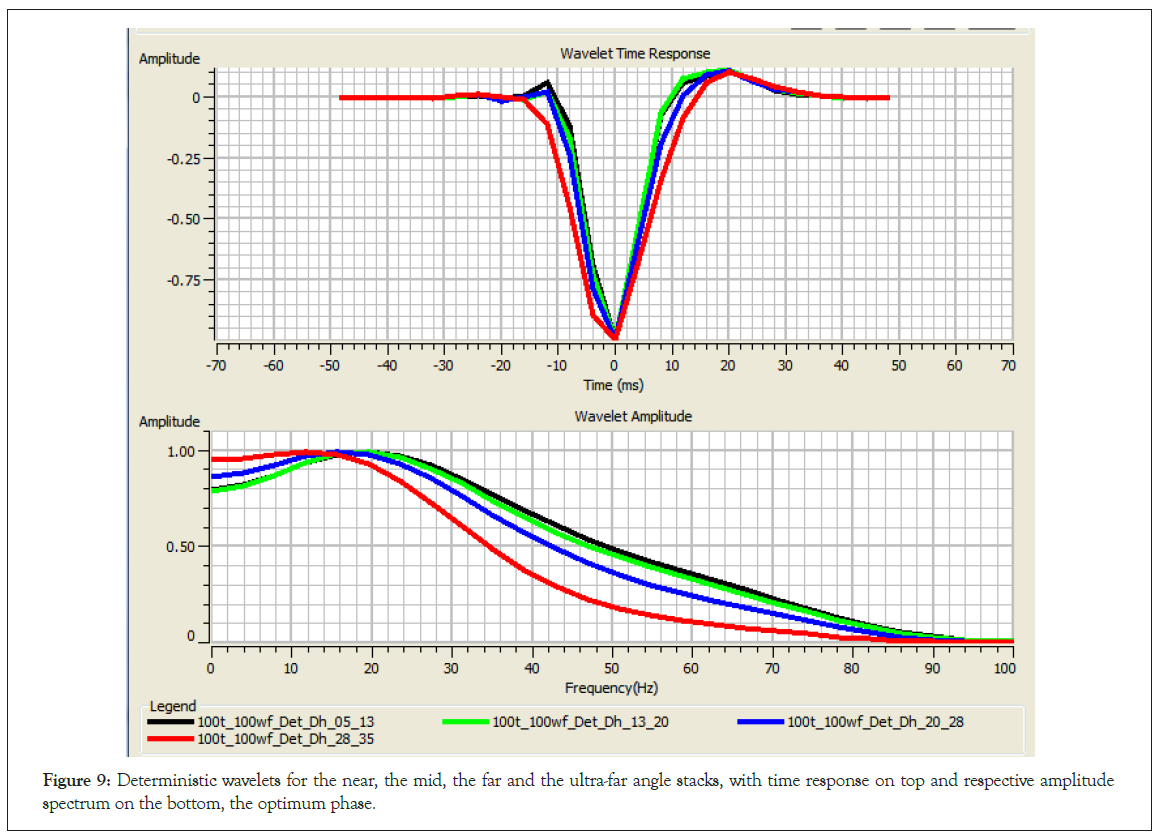
Figure 9. Deterministic wavelets for the near, the mid, the far and the ultra-far angle stacks, with time response on top and respective amplitude spectrum on the bottom, the optimum phase.
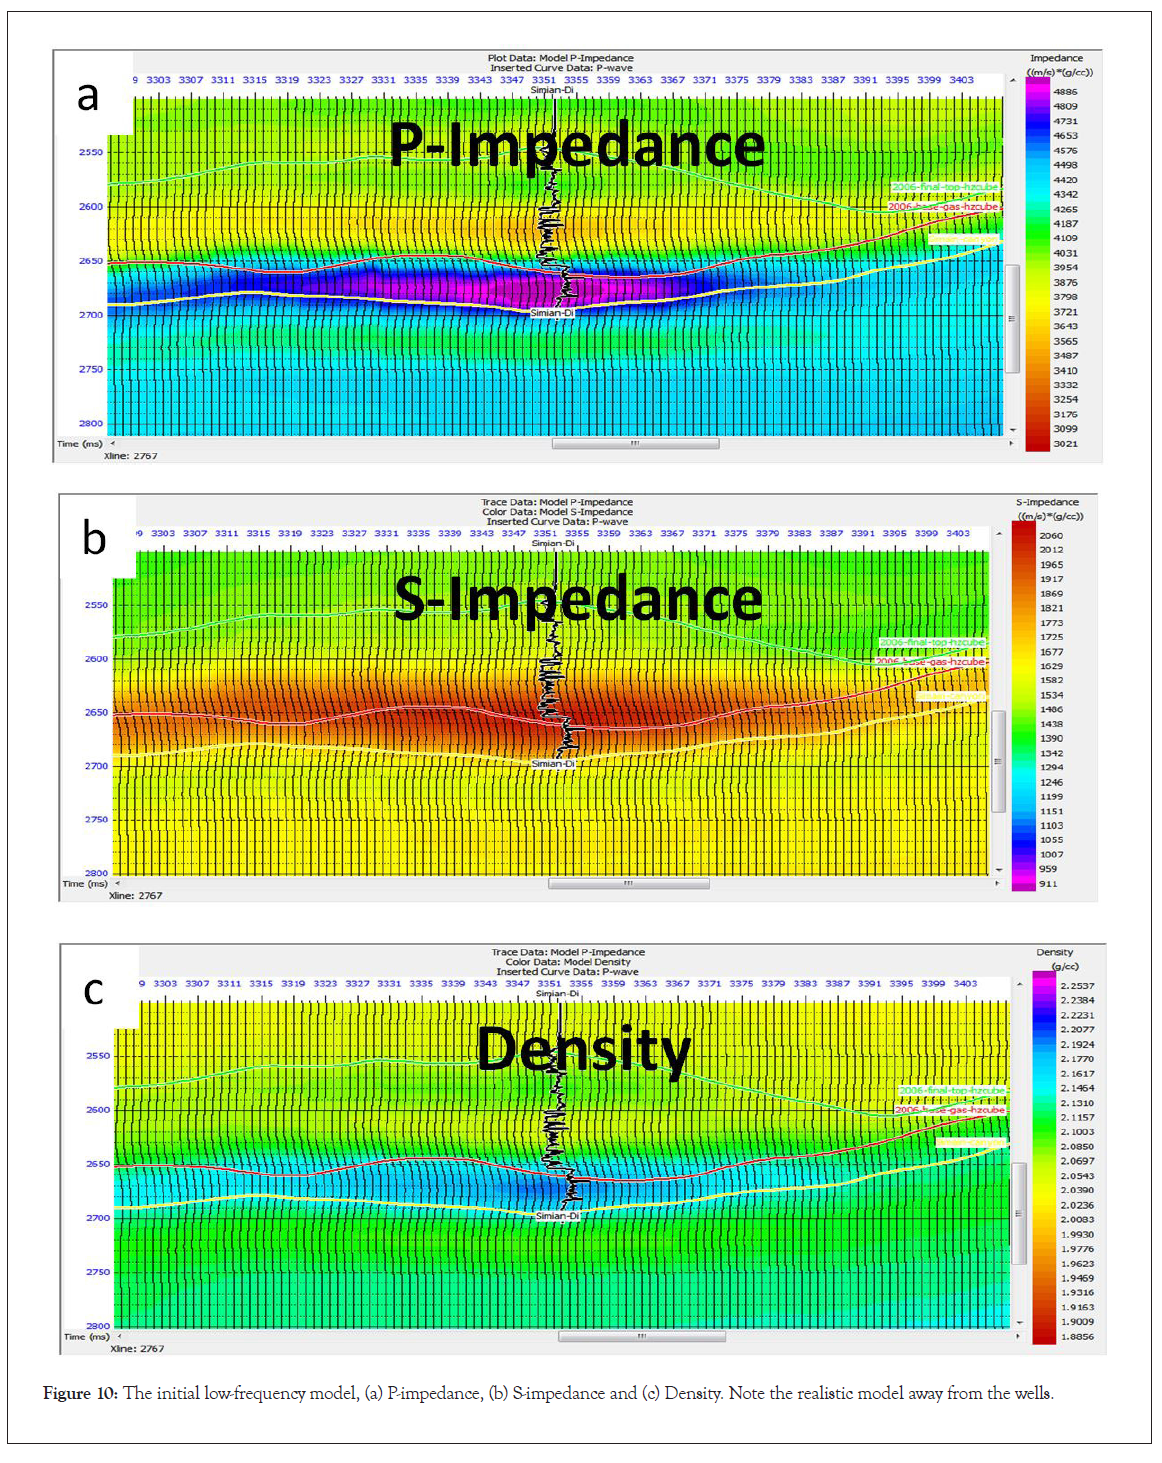
Figure 10. The initial low-frequency model, (a) P-impedance, (b) S-impedance and (c) Density. Note the realistic model away from the wells.
As the program iterates, it improves the fit between the recorded seismic traces and model-based synthetic traces by locally modifying the P-impedance model together with local deviations of the relationship between P-impedance, S-impedance and density. Figure 11 shows the simultaneous pre-stack inversion workflow. After the initial model construction, set of wavelets were available for the inversion; deterministic wavelets. The deterministic wavelets have the advantage of addressing the change in phase from near to Ultra far stacks much better than the statistical wavelets. The statistical wavelets assume constant zero/180° phase. So, the decision was to use the deterministic wavelet set to perform the pre-stack. To test the success of these wavelets, inversion analysis was carried out at the Simian-Di well location.

Figure 11. Flow chart outlining the steps of the pre-stack inversion workflow performed in this study.
The final results from the simultaneous pre-stack inversion consist of three basic volumes of P-impedance (Zp), S-impedance (Zs), and density (ρ). Simultaneously with these volumes, Vp, Vs and Vp/ Vs volumes were computed as well as the Lamé parameter volumes of lambda-rho (λρ) and mu-rho (μρ) (Figure 12). The inversion analysis gave us a good idea about the correlation between the inversion results and the corresponding logs at each well location. Obviously the Zp, Vp, Vp/Vs and λρ volumes indicate the gas sand (the warmer colors the cleanest sand) while the Zs, Vs, μρ and density volumes can be used for the lithology separation purpose. A good match was obtained between the well data and the inversion results for most of the wells thus confirming that an accurate quantification of the elastic attributes was obtained (Figure 12).

Figure 12. Pre-stack inversion results at the blind well location showing from upper left to lower right respectively: P-impedance, S-impedance, Vp/Vs, Density, Lambda-Rho and Mu-Rho.
The results from the different crossplots show that the separation of gas sands is better defined than brine sands and shale. Following the work and recommendations of [7] the crossplot λρ - μρ was analyzed further as λ is described as the most sensitive fluid indicator. The physical interpretation of the lambda (λ) and mu (μ) attributes is: The λ term, or incompressibility, is sensitive to pore fluid, whereas the μ term, or rigidity, is sensitive to the rock matrix.
The Lamé parameters were obtained during the simultaneous inversion from Zp and Zs. In theory, we cannot decouple the effects of density from λ and so, the output will be lambda-rho (λρ) and mu-rho (μρ) volumes and it is therefore most beneficial to crossplot λρ versus μρ to minimize the effects of density. Figure 13 shows the gas sand detection in the crossplot, seismic section passing through Simian-Di well and map.
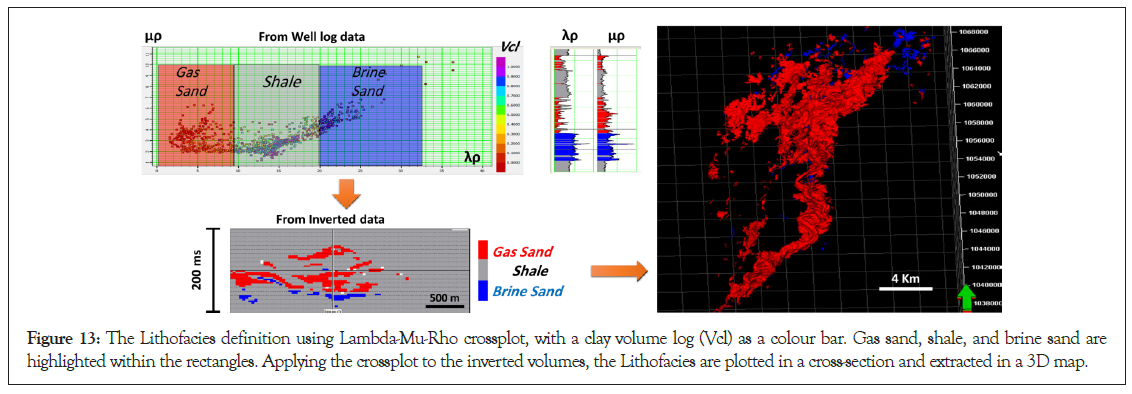
Figure 13. The Lithofacies definition using Lambda-Mu-Rho crossplot, with a clay volume log (Vcl) as a colour bar. Gas sand, shale, and brine sand are highlighted within the rectangles. Applying the crossplot to the inverted volumes, the Lithofacies are plotted in a cross-section and extracted in a 3D map.
Spectral decomposition has become a useful and important technique and tool for extracting stratigraphic information from seismic data. In this paper, a case study is presented, where spectral decomposition is being used successfully to image and map the channel sands and established reasoning of success and failure of different wells in a study area.
Spectral decomposition analysis is an important reservoir imaging tool. Very little data preparation or effort is required to get results which significantly enhance the explorationist’s understanding of the reservoir. Seismic modelling and volume interpretation techniques do not take much more time, but can take the interpretation to a new level. In particular, a high-resolution picture of the reservoir can be built with greater confidence and a better understanding of risk than is otherwise possible.
Pre-stack inversion is an important reservoir imaging tool. Very little data preparation or effort is required to get results which significantly enhance the explorationist’s understanding of the reservoir. Seismic modeling and volume interpretation techniques do not take much more time, but can take the interpretation to a new level. In particular, a high-resolution picture of the reservoir can be built with greater confidence and a better understanding of risk than is otherwise possible.
However, the pre-stack inversion is a very powerful method to delineate the reservoirs and has been successfully used in the reservoir characterization, but also has its limitations regarding the requirement of a reliable set of wavelets, suitably wire-line logged wells and sufficiently dense initial model. The P-impedance-Vp/Vs and λρ-μρ crossplots separate different lithologies in particular: Gas and shale. Both crossplots are used successfully to outline the gas sands.
We would like to thank the Egyptian General Petroleum Corporation (EGPC) and Rashid Petroleum Company (RASHPETCO) for providing the data and for the permission to publish this study.
Citation: Othman AAA, Metwally F, Fathy M, Said W (2021) Reservoir Delineation Employing Spectral Decomposition and Pre-Stack Inversion Techniques, Offshore Nile Delta, Egypt. J Geol Geophys. 10:490.
Received: 04-Jan-2021 Accepted: 18-Jan-2021 Published: 25-Jan-2021 , DOI: 10.35248/2381-8719.21.10.490
Copyright: © 2021 Othman AAA, et al. This is an open-access article distributed under the terms of the Creative Commons Attribution License, which permits unrestricted use, distribution, and reproduction in any medium, provided the original author and source are credited.