Journal of Medical Diagnostic Methods
Open Access
ISSN: 2168-9784
ISSN: 2168-9784
Research Article - (2023)Volume 12, Issue 1
The Sperm Chromatin Structure Assay (SCSA) based on the polychromatic fluorescence of Acridine Orange (AO) is widely employed to observe DNA damages in human sperm nuclei. To re-evaluate the principle of the SCSA, human motile sperm with a negative DNA fragmentation rate of 87% were prepared as the Negative Control (NC) and the Positive Control (PC) was prepared through heat denaturation of the NC. The AO stainability for the controls was compared on the basis of microscopic, electrophoretic, and flow cytometric observations. Human motile sperm were separated by means of Percoll density gradient centrifugation and subsequent swim up. Then, DNA fragmentation was observed by the aid of Single-cell pulse-field gel electrophoresis.
We found that the AO molecule emitted red and green fluorescence depending on the excitation wavelength. Both controls were changed colour from green to red as the AO concentration increased and lacked red fluorescence after in-gel digestion with trypsin. The change of colour of the NC from red to green and DNA fragmentation proceeded concurrently during photo-bleaching. The cytograms of NC and PC were similar each other. These facts conflict with the SCSA principle. Green and red fluorescence were emitted due to the intercalation of AO into DNA and adsorption of AO to proteins, respectively, and their merge led to the colour variation. Discoloration from red to green during photo-bleaching was possibly observed because green fluorescence from the intercalated AO was more tolerant to reactive oxygen species than red fluorescence from adsorption of AO to some proteins. Overall, SCSA cannot detect DNA damage in the human sperm nucleus.
Sperm chromatin structure assay; Acridine orange; Polychromatic fluorescence; Human sperm; DNA fragmentation; Single-cell pulsed-field Gel electrophoresis; DNA fiber
Male germ cells are susceptible to the accumulation of DNA lesions as apoptosis plays a crucial role in the spermatogenetic quality control [1]. Moreover, the DNA repair capacity of sperm declines during late spermatogenesis [2]. Sperm that await ejaculation are potentially endangered by environmental pollution-induced oxidative damage [3,4]. Incomplete DNA repair may be promutagenic and responsible for sperm-derived congenital anomalies. Intra-Cytoplasmic Sperm Injection (ICSI) is currently recognized as a major fertilization method in Assisted Reproductive Technology (ART). Whether injection of sperm with damaged DNA leads to higher rates of malformations compared with natural fertilization remains unclear [5-8]. In the past decade, the comet assay and the Sperm Chromatin Structure Assay (SCSA) were employed to observe DNA damage in a single nucleus [9-12].
In the comet assay, the level of DNA damage is evaluated based on the electrophoretic migration of granular fragments, the so- called “comet tail.” The repair of Double-Strands Breaks (DSBs) is intrinsically more difficult than that of other DNA lesions [13-15]. When discussing impact on sperm-derived congenital anomalies, the critical threshold of a DSB in a nucleus may be very low. The incidence is not proportionate to the number of cleavages because those over a critical threshold cause fertilization failure or pregnancy loss. The comet assay detects sperm that had already been irreparably damaged. Therefore, validating the earliest stage of DNA fragmentation is a more crucial diagnostic and prognostic measure in human ICSI treatments. Single-Cell Pulsed-Field Gel Electrophoresis (SCPFGE) simultaneously detects long-chain fibers and large fibrous and granular fragments of DNA in a single nucleus, which are visualized through fluorescence microscopy [16,17]. This method can also facilitate the visualization of the dose-dependent pro-oxidant action of ascorbic acid on DNA fibers [18]. Our previous report revealed that the separated motile sperm fraction included the group for which only long-chain fibers were observed or the group with fibrous fragments beyond the anterior end of the elongated fibers, but scarcely involved the group with granular fragments in the advanced stage [16,17].
The SCSA employs a simple bisection principle wherein the intercalation of monomeric Acridine Orange (AO) into double- stranded DNA or the Adsorption of Oligomeric AO to single- stranded DNA arose green or red fluorescence, respectively [11,12]. On PubMed, we identified more than 2,000 relevant articles by using the search term “Sperm Chromatin Structure Assay” or “DNA Fragmentation Index (DFI)”. We believe that before drawing conclusions based on the aforementioned cohort studies, confirming the relevance of the principle of the widely used SCSA is of utmost importance.
We first prepared human sperm without DNA fragmentation, and the specimen with the highest negative DNA fragmentation rate, whose value was estimated with SCPFGE, was employed as the tentative Negative Control (NC). Then the Positive Control (PC) was prepared through heat denaturation of the NC. The AO stain ability for NC and PC was compared on the basis of microscopic, electrophoretic, and flow cytometric observations.
Separation of human motile sperm
Normozoospermic semen (n=6) were provided by patients who visited our outpatient clinic. The Ethical Committee of Ichikawa General Hospital specifically approved this study (approval number: 2013-02,-03). Sperm concentration and motility were measured using a computer-assisted image analyser (C-Men, Compix, Cranberry Township, PA, USA). Samples of human motile sperm with minimal DNA fragmentation were prepared according to the method specified in our previous report [16]. Briefly, the diluted semen was layered on 5.0 mL of 20 mM HEPES-buffered 90% isotonic Percoll (Cytiba, Uppsala, Sweden) and centrifuged at 400 ×g for 22 min. The sperm in the sediment were recovered to yield 0.2 mL and then introduced to the bottom of 2.0 mL of Hanks’ solution to facilitate swim-up. The motile sperm in the upper layer were then recovered.
Single-Cell Pulse-Field Gel Electrophoresis (SCPFGE)
SCPFGE was performed as described in our previous reports with slight modifications [16,17]. In brief, human sperm that adhered to agarose-coated glass slides were embedded in molten 0.5% agarose containing 20 μg/mL highly purified bovine pancreatic trypsin (pH 4.7) to form a 100-μm-thick gel coating. After being chilled, the gel film was incubated in the cell lysis reagent (30 mmol/L Tris-HCl, 8.2 mmol/L hexa-metaphosphate Na, 0.05% Triton X-100, 5.0 mmol/L dithiothreitol, pH 8.1) at 37˚C for 30 min. The apparatus was equipped with dual electrode pairs arranged at a 60-degree angle, and the gel film on the glass slide was positioned at the cross point of the electric currents. The currents were applied at 2.0 V/cm with 8.0-sec switching intervals for 7 min in the electrophoretic buffer (30 mM Tris- acetate, 8.2 mmol/L hexametaphosphate Na, pH 8.1). DNA in the gel was stained with diluted (×104) SYBR gold (Molecular Probes, Eugene, Oregon, USA) and was observed under an epifluorescence microscope with a green filter (Axio Imager A1, Carl Zeiss Microimaging, Jena, Germany). Still images were recorded using a high-resolution charge-coupled device camera (AxioCam HRC, Carl Zeiss Microimaging). Based on their sizes, the microscopic features of DNA were classified as long-chain fibers and fibrous and granular fragments, as described previously [16,17]. Sperm that presented with at least one fibrous fragment under the microscope were classified as damaged and more than 200 sperm were counted to determine the DNA damage rate.
Acridine orange staining
The sperm adhered to the glass slide through centrifugal auto-smear and were then fixed with methanol for 5 min. The specimen sections were incubated with 10-50 μg/mL AO (3,6-acridinediamine, N, N, N′, N′-tetramethylmonohydrochloride) in 20 mmol/L HEPES- buffered saline (pH 7.4) for 10 min at ambient temperature, and the excess dye was then washed off with water. The staining profiles were observed using an epifluorescence microscope (BX51, Olympus, Tokyo, Japan) equipped with single-path green and red filters and a green/red dual band-path filter. Still images were recorded using the same camera (Axio Cam HRC).
Preparation of human lymphocytes
Human peripheral blood (2.0 mL) was diluted twice with saline containing 1.0 mmol/L EDTA, then layered on 4.0 mL of Lymphoprep (Nycomed Pharma, Zurich, Switzerland), and centrifuged at 600 × g for 10 min. The lymphocytes were yielded at the intermediate layer, adhered to the glass slide through centrifugal auto-smear, and fixed with methanol for 5 min.
Flow cytometric analysis
The sperm suspension (NC and PC) was resuspended to give 106 sperm/mL with 10 µg/mL AO in 20 mmol/L HEPES-buffered saline and 0.05% Triton X-100 (pH 7.4), incubated for 10 min, and analyzed using a flow cytometer (EPICS XL, Beckman Coulter, Fullerton, CA, USA). Argon laser excitation at 488 nm was used, with green emission collected using a 530/30 nm band- path filter and red emission collected with a long-path filter (≥ 630 nm). Flow cytometry data from more than 20,000 events were plotted on a cytogram with the ordinate axis representing green fluorescence and the abscissa representing red fluorescence.
When human lymphocytes were stained with 50 μg/mL AO, at first the entire region emitted red fluorescence under a green/red dual-band path filter. With prolonged exposure, the cytoplasm underwent simple colour quenching. By contrast, the nucleus underwent time-dependent discoloration from red to green. Figure 1 shows the profiles of lymphocytes after prolonged exposure for 2 min.
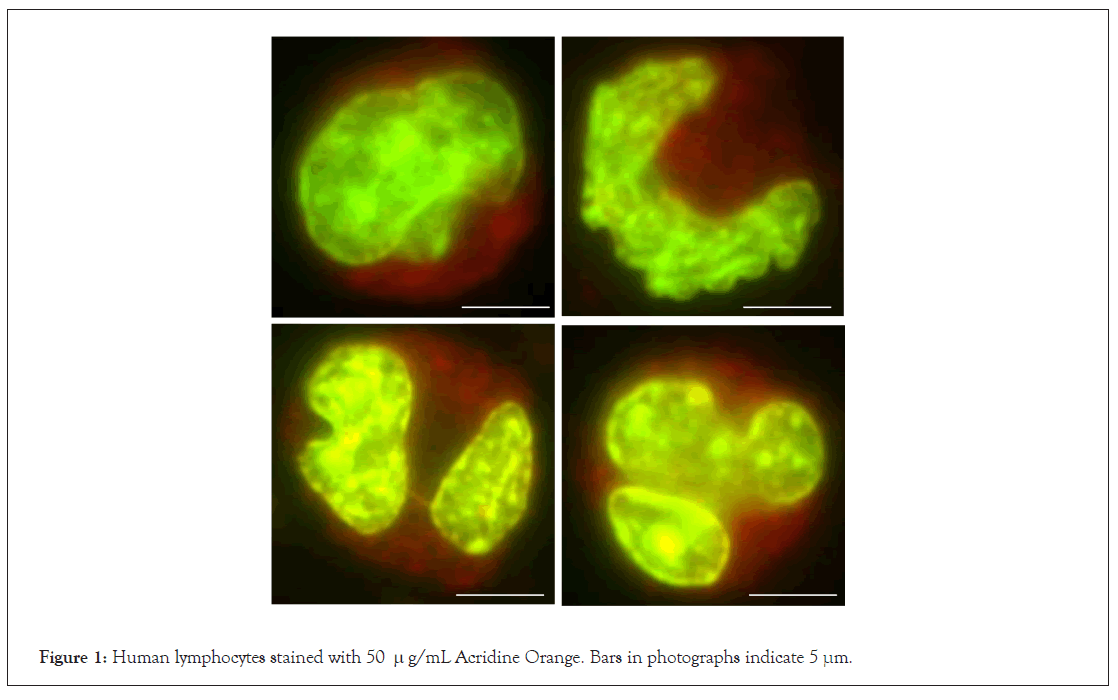
Figure 1: Human lymphocytes stained with 50 µg/mL Acridine Orange. Bars in photographs indicate 5 μm.
We evaluated DNA fragmentation in human sperm through Single-Cell Pulsed-Field Gel Electrophoresis (SCPFGE). When elongated DNA fibers were stained with AO, prolonged exposure led to not only photo-bleaching of fluorescence but also photo- breakage of DNA double strands (see below). These results raised some doubts, considering that according to the SCSA principle, AO fluorescence in the nucleus should change from green to red along with prolonged exposure.
We first prepared comparative standards to validate the SCSA principle. Human semen specimens (volume: 3.9 ± 1.2 mL, sperm concentration: 84 ± 28 × 104/mL, motility: 61% ± 9.6%, n=6) were used to prepare the motile sperm. After the swim-up, the parameters were as follows: volume: 1.0 mL, concentration: 49 ± 15 × 104/mL; and motility: 90% ± 4.8%. The negative DNA fragmentation rate ranged from 77% to 87% with a mean of 81% ± 3.5%. The specimen with the highest value (87%; 48 × 104 sperm/mL, and 96% motility) was employed as the tentative NC. As shown in Figure 2A, NC elongated bundles of long- chain fibers from the origin. A part of the sperm involved fibrous fragments, but not granular fragments. Double-stranded DNA in NC was cleaved through heat denaturation at 96˚C for 20 min and then quenched in ice-cold water. The treatment also induced DSBs; the fibers were shredded into granular fragments (Figure 2B).
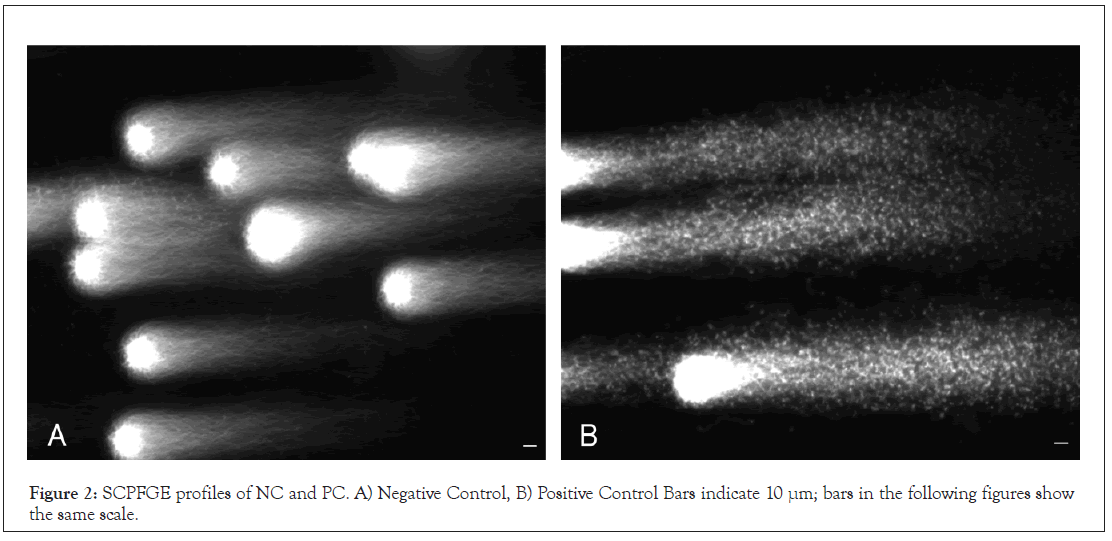
Figure 2: SCPFGE profiles of NC and PC. A) Negative Control, B) Positive Control Bars indicate 10 μm; bars in the following figures show the same scale.
The SCSA is based on the flow cytometric analysis of polychromatic fluorescence of AO, where the events are accumulated as signals on the cytograms. We first visually investigated the profiles of AO staining for NC and PC under a fluorescence microscope. NC was stained with 50 μg/mL AO. Three photographs in Figure 3 show the same field of view under an epifluorescence microscope equipped with single-path green and red filters and a green/red dual-band path filter (Figures 3A-3C). AO is a polychromatic fluorescent dye; it emits green or red fluorescence according to the excitation wavelength, and the merged photograph obtained with the dual-band path filter shows multicolour sperm.
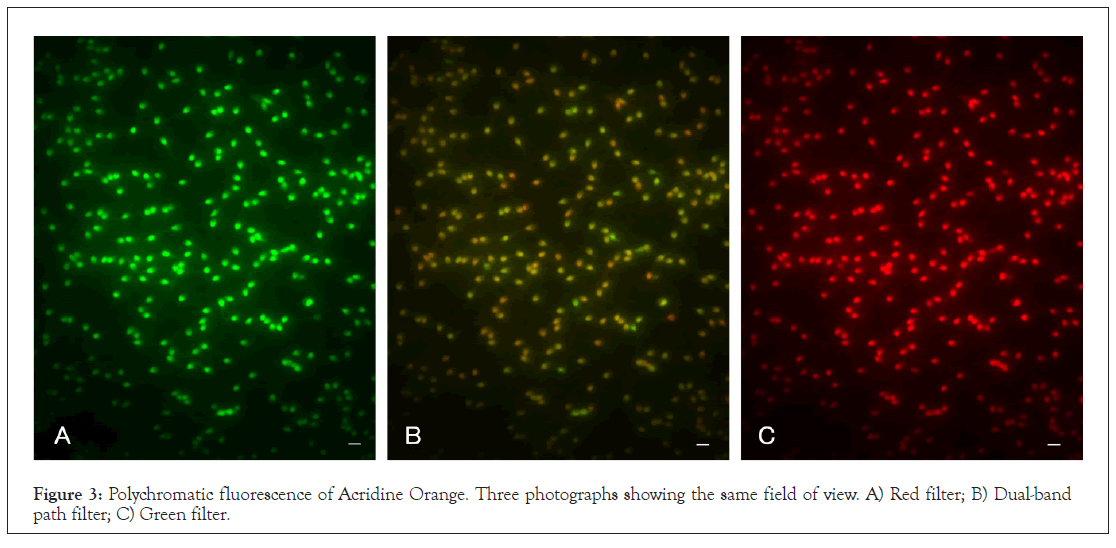
Figure 3: Polychromatic fluorescence of Acridine Orange. Three photographs showing the same field of view. A) Red filter; B) Dual-band path filter; C) Green filter.
Figure 4 summarizes concentration-dependent colour changes. NC only emitted green fluorescence at 10 μg/mL AO, whereas 25 μg/mL AO resulted in a mixture of green, orange, and red fluorescence. The colour became reddish as the AO concentration increased until no green fluorescence-emitting sperm was detected anymore at 50 μg/mL AO. NC was pre- heated at 96˚C for 10 min, and 10-50 μg/mL AO was added. The suspension was incubated at the same temperature for an additional 10 min and finally quenched in ice-cold water. The concentration dependence of PC shifted, with 10 and 25 μg/mL AO resulting in green fluorescence, while 50 μg/mL AO resulted in discoloration from red to green.
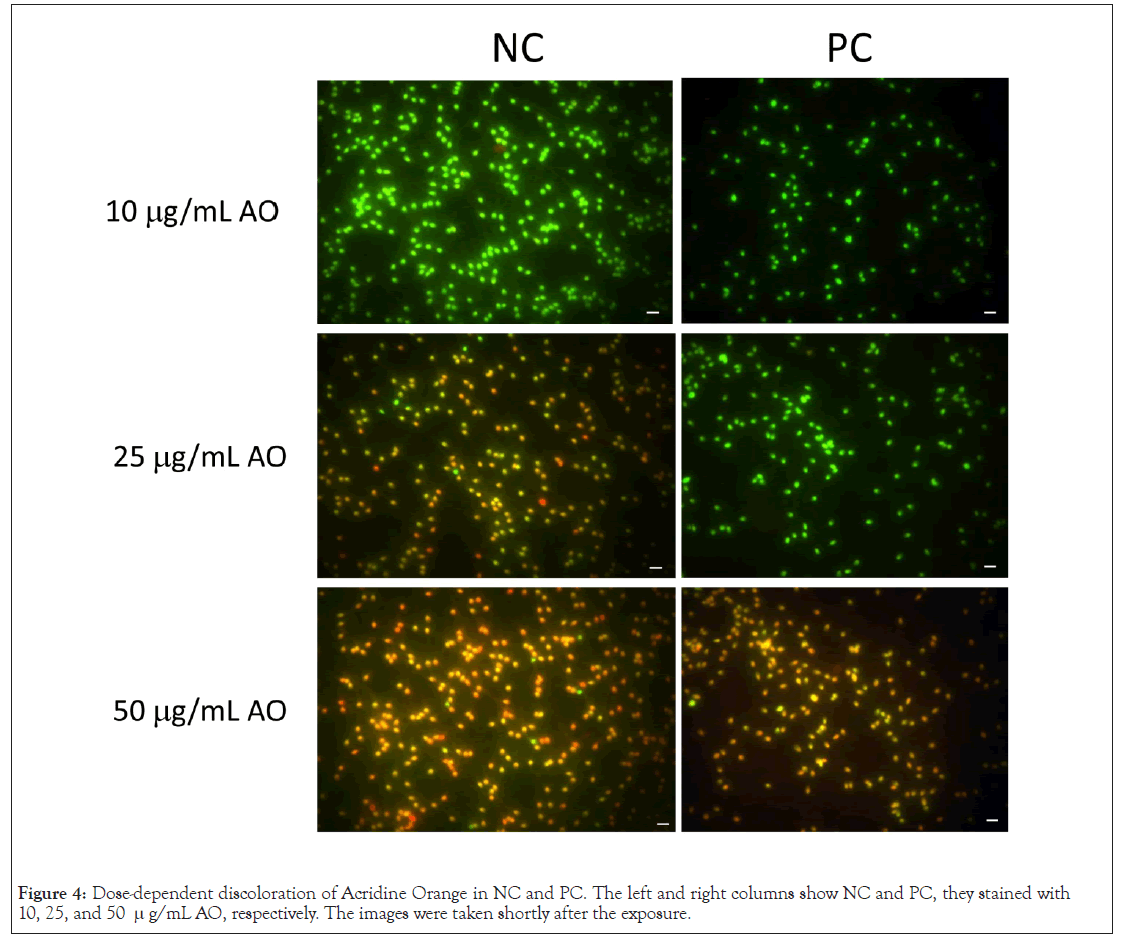
Figure 4: Dose-dependent discoloration of Acridine Orange in NC and PC. The left and right columns show NC and PC, they stained with 10, 25, and 50 μg/mL AO, respectively. The images were taken shortly after the exposure.
The PC was embedded in agarose film and digested with trypsin according to the SCPFGE protocol. The gel was stained with 50 μg/mL AO for 10 min, and the granular fragments were dispersed under green filter. By contrast, observation of the same field of view under a red filter gave no fluorescence, then it was brightened to correspond to a 4s exposure using Photoshop CS6, weak red fluorescence was observed. Even after boiling for 20 min, deproteinated DNA in the PC yielded minimal red fluorescence. The red fluorescence arose from nuclear proteins but not from damaged DNA (Figures 5A-5C).
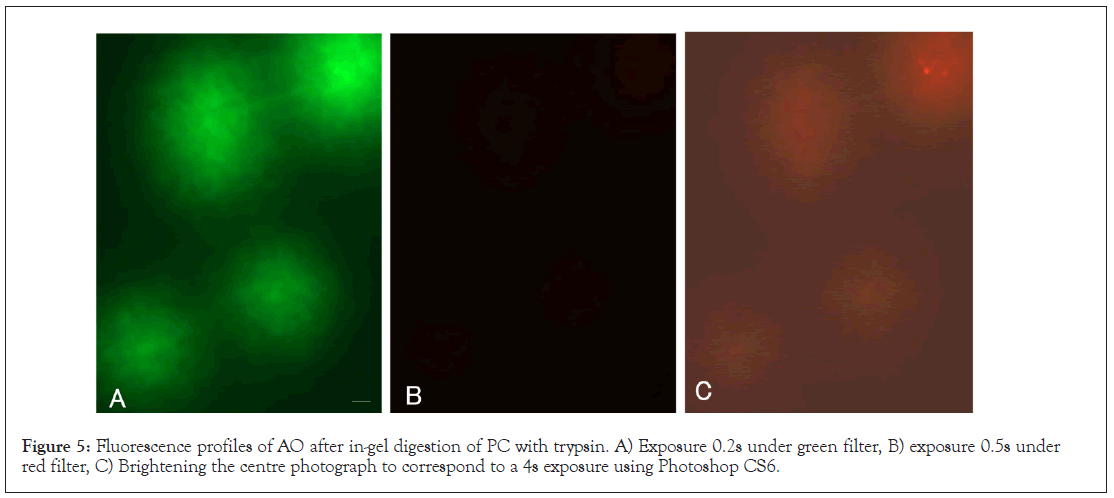
Figure 5: Fluorescence profiles of AO after in-gel digestion of PC with trypsin. A) Exposure 0.2s under green filter, B) exposure 0.5s under red filter, C) Brightening the centre photograph to correspond to a 4s exposure using Photoshop CS6.
As discussed earlier, the relationship between fluorescence photo-bleaching and photo-breakage is summarized in Figure 6. NC was stained with 50 μg/mL AO, and DNA fibers elongated by SCPFGE were stained with SYBR gold. When their profiles were observed for 2 min under the dual-band path filter, the sperm nuclei also did not undergo simple colour quenching, but rather underwent a progressive, time-dependent discoloration from red to green; this was similar to lymphocytes (Figure 1). DNA fragmentation concurrently proceeded during prolonged exposure. These behaviours were inconsistent with the SCSA principle (Figures 6A-6D).
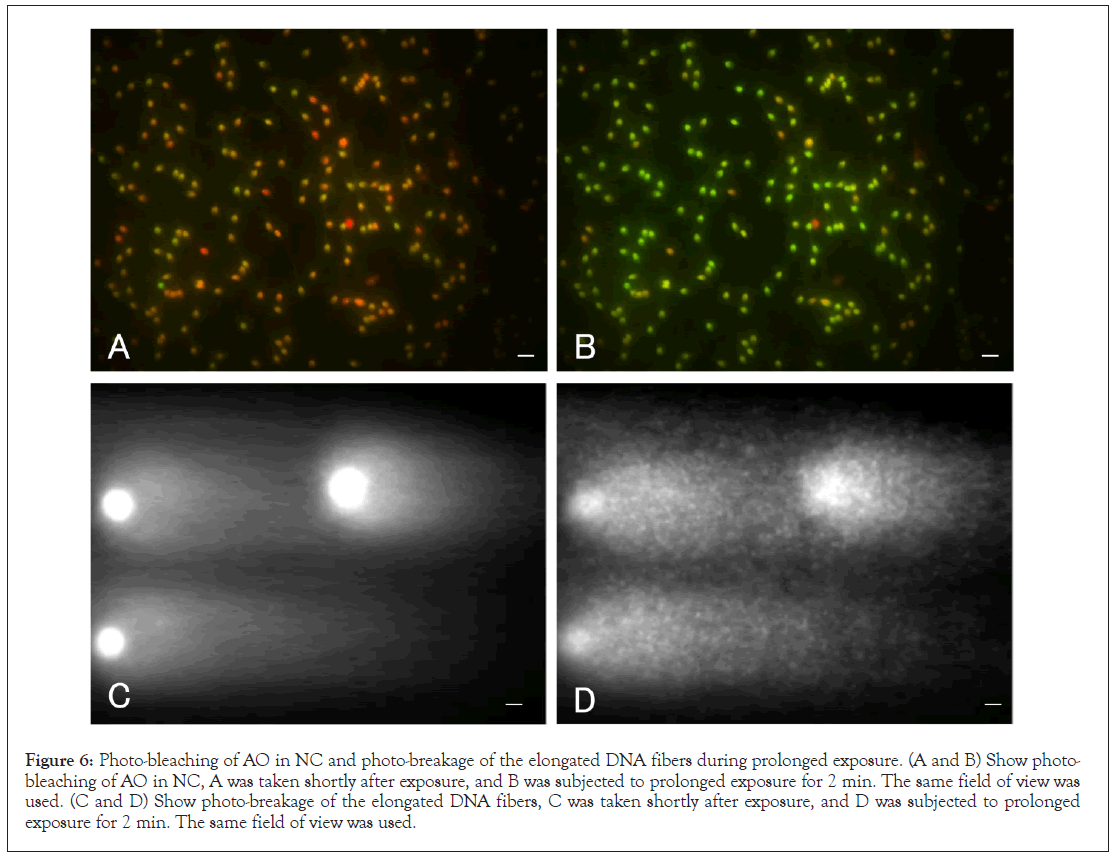
Figure 6: Photo-bleaching of AO in NC and photo-breakage of the elongated DNA fibers during prolonged exposure. (A and B) Show photo- bleaching of AO in NC, A was taken shortly after exposure, and B was subjected to prolonged exposure for 2 min. The same field of view was used. (C and D) Show photo-breakage of the elongated DNA fibers, C was taken shortly after exposure, and D was subjected to prolonged exposure for 2 min. The same field of view was used.
Human semen is a heterogeneous population of cells and non- cellular particles. The sperm used in the present study included only motile sperm; immotile sperm, other cells, and non-cellular particles were excluded (Figures 3 and 4). The semen used for preparing NC was stained with 10 μg/mL AO according to the SCSA protocol and then observed under a green/red dual-band path filter [11]. The sperm mainly emitted green fluorescence, as indicated by the arrows. Non-sperm debris emitted no, green, and red fluorescence. As illustrated in Figure 7, SCSA examines human semen with AO staining, and divided signals in the cytogram into 3 regions. DFI was calculated from the ratio of the signals in regions 1 and 2. The signals of NC were accumulated on the oblique line in region 1, whereas no signal was found in region 2 (Figure 7A). Even after heat denaturation, the signals of PC did not move to region 2, and the cytograms of NC and PC were similar each other (Figures 7A and 7B).
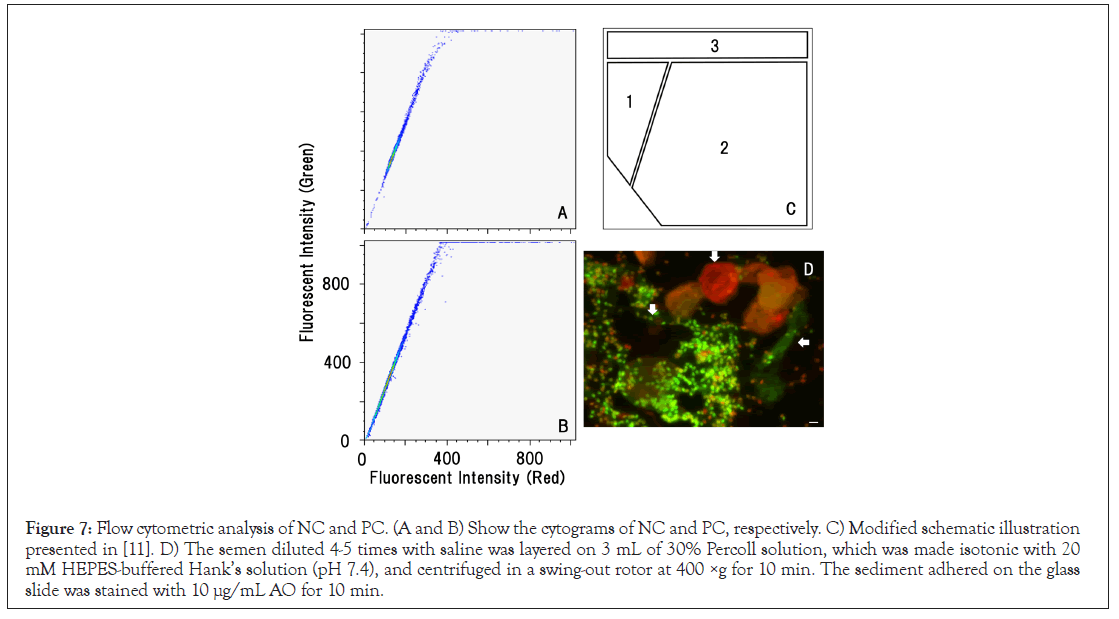
Figure 7: Flow cytometric analysis of NC and PC. (A and B) Show the cytograms of NC and PC, respectively. C) Modified schematic illustration presented in [11]. D) The semen diluted 4-5 times with saline was layered on 3 mL of 30% Percoll solution, which was made isotonic with 20 mM HEPES-buffered Hank’s solution (pH 7.4), and centrifuged in a swing-out rotor at 400 ×g for 10 min. The sediment adhered on the glass slide was stained with 10 μg/mL AO for 10 min.
According to the SCSA principle, adsorption of AO to single- stranded DNA results in emission of red fluorescence. In the present study, double-stranded DNA fibers were cleaved through heat denaturation at 96˚C for 20 min (Figure 2A). This radical treatment also induced DSBs; all long-chain fibers were shredded to form granular fragments (Figure 2B). The single-stranded DNA produced in the sperm nucleus in vivo may be substantially smaller than those observed in PC.
Comparative studies between NC and PC provided the following observations. The AO molecule essentially emitted red and green fluorescence according to the excitation wavelength (Figure 3). The colour tones of NC and PC were dependent on the AO concentration rather than on DNA integrity (Figure 4). After tryptic digestion, the heat denatured DNA in PC stopped emitting red fluorescence (Figure 5). These results indicate that the intercalation of AO into DNA resulted in emission of green fluorescence, and adsorption of AO to proteins resulted in red fluorescence, respectively. The profile of lymphocytes sustained this consideration (Figure 1).
Several papers have reported the interaction of AO with non-DNA materials and discoloration [19-24]. AO is capable of permeating the cell and organelle membranes, and its polychromatic property is used for differential fluorescence staining of organelles [19,20]. Proton pump-driven intra-lysosomal acidity facilitates the accumulation of permeated AO, and the oligomeric aggregates of the agent then exhibit a red shift (640 nm) in the lysosome compared with the monomeric AO that emits at 525 nm [21,22]. When lysosomal pH rises due to membrane damage, AO becomes deprotonated, and the emission shifts from orange to green [23]. AO acts as an indicator of lysosomal localization and proton pump damage [24].
Photo-bleaching under the fluorescence microscope involves degradation of the dye molecule by Reactive Oxygen Species (ROS). N-demethylation of acridine yellow (an analogous derivative of AO) by ROS causes photo-bleaching [25]. The hydroxy radical rose from ascorbic acid shredded DNA fibers dose- dependently [18]. ROS might also have triggered the concurrent occurrence of DNA fragmentation during prolonged exposure (Figure 6). DNA and nucleoproteins are packed monolithically in the sperm head, resulting in a merge of two colours, which leads to the colour variation. Time-dependent discoloration from red to green was observed possibly because green fluorescence from the intercalated AO was more tolerant to ROS than red fluorescence from adsorption of AO to some proteins.
Because human semen is heterogeneous population of cells and non-cellular particles, it is rarely provided for clinical in vitro fertilization. The current procedure for preparing NC is the standard protocol followed in ART to separate motile sperm from immotile sperm, other cellular, and non-cellular debris [16,26]. Although the characteristics of DNA were quite different between NC and PC (Figure 2), flow cytometry with AO staining could not distinguish the cytograms of NC and PC (Figures 7A and 7B), and the signals in PC were not distributed in region 2 (Figure 7C). The lack of the signal in region 2 prevented DFI calculation. As shown in Figure 7D, non-sperm debris also emitted fluorescence, and signals in region 2 might be derived from some debris excluded during processing.
In conclusion, the comparative investigations between NC and PC on the basis of microscopic, electrophoretic, and flow cytometric observations provided following the results;
• Both the controls were changed colour from green to red as the AO concentration increased, and their merge led to the colour variation.
• The colour of the NC was changed from red to green during photo-bleaching. DNA fragmentation concurrently proceeded during prolonged exposure. These behaviours were inconsistent with the SCSA principle.
• The PC lacked red fluorescence after in-gel digestion with trypsin. The red fluorescence was emitted by the nucleoproteins.
• signals of the purified motile sperm (NC) were accumulated on the oblique line in the cytogram. Even after heat denaturation, there found no noticeable change in the signals of PC. Overall results concluded that the green fluorescence was derived from the intercalated AO, whereas the red fluorescence was not emitted by single-stranded DNA but by non-DNA materials. SCSA based on the flowcytometric analysis was incapable of detecting DNA damage in human semen.
[Crossref] [Google scholar] [Pubmed]
[Crossref] [Google scholar] [Pubmed]
[Crossref] [Google scholar] [Pubmed]
[Crossref] [Google scholar] [Pubmed]
[Crossref] [Google scholar] [Pubmed]
[Crossref] [Google scholar] [Pubmed]
[Crossref] [Google scholar] [Pubmed]
[Crossref] [Google scholar] [Pubmed]
[Crossref] [Google scholar] [Pubmed]
[Crossref] [Google scholar] [Pubmed]
[Crossref] [Google scholar] [Pubmed]
[Crossref] [Google scholar] [Pubmed]
[Crossref] [Google scholar] [Pubmed]
[Crossref] [Google scholar] [Pubmed]
[Crossref] [Google scholar] [Pubmed]
[Crossref] [Google scholar] [Pubmed]
[Google scholar] [Pubmed]
[Crossref] [Google scholar] [Pubmed]
[Crossref] [Google scholar] [Pubmed]
[Crossref] [Google scholar] [Pubmed]
[Crossref] [Google scholar] [Pubmed]
[Crossref] [Google scholar] [Pubmed]
[Crossref] [Google scholar] [Pubmed]
[Google scholar] [Pubmed]
Citation: Kaneko S, Takamatsu K (2023) Re-Evaluation of Sperm Chromatin Structure Assay (SCSA). J Med Diagn Meth. 12:399
Received: 04-Feb-2023, Manuscript No. JMDM-23-21699; Editor assigned: 07-Feb-2023, Pre QC No. JMDM-23-21699(PQ); Reviewed: 21-Feb-2023, QC No. JMDM-23-21699; Revised: 06-Mar-2023, Manuscript No. JMDM-23-21699(R); Published: 15-Mar-2023 , DOI: 10.35248/2168-9784.23.12.399
Copyright: © 2023 Kaneko S, et al. This is an open-access article distributed under the terms of the Creative Commons Attribution License, which permits unrestricted use, distribution, and reproduction in any medium, provided the original author and source are credited.