Journal of Geology & Geophysics
Open Access
ISSN: 2381-8719
ISSN: 2381-8719
Research Article - (2023)Volume 12, Issue 7
Your health depends on where you live as much as your diet and genes. All bodily processes depend on the presence of natural metals/minerals in the soil which must come from your diet. Some minor metals/minerals are iron, zinc, manganese, iodine, fluoride, chromium, cobalt, selenium, molybdenum, silicon, and vanadium. Other metals and minerals in soils are potentially toxic. Understanding the natural variations of potentially toxic elements in soils and groundwater is critical for one’s health. Arsenic is a common metal/mineral and is present in soil, water, food, and air. The top 4 common foods that contain arsenic are rice, apple and grape juice, protein shakes and powders, and chicken. Consumer Reports published the following; measurable amounts of arsenic were found in virtually every one of the 60 varieties of rice tested, roughly 10 percent of apple and grape juice samples contained arsenic levels that exceeded the federal drinking water standard of 10 ppb, three of 15 protein powders and drinks contained arsenic, exceeding the limits, and arsenic in chicken feed contained toxic levels and was banned in 2010. In 1998 the United States Environmental Protection Agency (USEPA) identified arsenic as a “known” human carcinogen based on occupational and drinking water exposure. In 2005, the EPA completed the National Human Exposure Assessment Survey and prepared a geochemical map for arsenic in soil throughout the United States that shows a number of regions contain elevated concentrations. The EPA’s soil screening level is 0.4 ppm which corresponds to a cancer risk level of 1 in 1,000,000 for ingesting arsenic. The increasing risk of cancer due to low-level arsenic exposure has prompted the author in this paper to examine the factors controlling the origin and distribution of arsenic in the environment and the ways in which arsenic may be mobilized. This paper reports on arsenic in New England, specifically a detailed study of one geographic area in central Massachusetts that has elevated arsenic levels in soils. The average results of 177 samples from 0-10' depth showed that the concentration of As was 68.72 mg kg-1. The presence of elevated levels of arsenic (As) in a zone that traverses N-S across Central Massachusetts had been periodically noted and reported. Suspected sources included the past applications of lead arsenate in orchards, industrial applications in metal and leather processing facilities, and/or from natural sources. These arsenic concentrations appear to be unrelated to commercial or industrial processes and are natural in origin. The distribution of As “hot spots” appears related to the fluvial and lacustrine depositional environment and is likely due to the bio-geoaccumulation of As throughout its depositional geologic history. Knowledge of the underlying bedrock geochemistry may aid in the prediction of elevated arsenic concentrations in overburdened soils.
Arsenic; Geochemistry; Heavy metals; USEPA; Soils; Groundwater; GIS
Arsenic is a ubiquitous element found in the atmosphere, soils and rocks, natural waters and organisms. This, coupled with mining activities, combustion of fossil fuels, and the use of arsenical pesticides, herbicides and crop desiccants, and the use of As as an additive to livestock feed, particularly for poultry, makes it a common trace constituent of most soils. Arsenic (As) accumulations occur in soil, sediments, surface water, and groundwater [1]. Arsenic in soils and groundwater is widespread and effects most of the world [2]. Affecting countries including Bangladesh [3], the Czech Republic [4], China [5], Argentina [6], Pakistan [7], India [8], Cambodia [9], Ethiopia, the United States, and Mexico [10]. Changes in environmental land use patterns, extensive mining of minerals, overexploitation of resources, and unplanned human activities have significantly enhanced the toxic risk of arsenic [11,12]. Arsenic concentrations in soil due to natural and anthropogenic activities has become a major threat to the environment, microbial communities, and humans throughout the entire world [13].
Arsenic is a hazardous element that occurs naturally in soil. The concentration in soils is substantial, ranging from 10 mg/ kg-10,000 mg/kg [14]. In the weathering process of bedrock containing As bearing minerals arsenic migrates from the bedrock, into the soil, and into the groundwater, which then enters the food chain, plants, and animals [15]. The occurrence of elevated concentrations of inorganic arsenic in groundwater in diverse regions has been reported [16]. The concentration and migration of As is controlled by the soil properties; i.e. clay, silt, sand, ionic charges, and minerals in various soil forms [17,18]. Arsenic adsorption and desorption processes are directly related to soil physiochemical characteristics and consequently vary between different soil types. The availability of As is greater in sandy soils than in clay soils [19]. In sandy soils, bound As is prone to movement by the removal of soil particles through soil erosion. Arsenic is usually adsorbed by soil cations such as aluminum, iron, manganese and calcium forming insoluble salts. Sandy soils generally contain low amounts of Fe and Al oxides and clay minerals thus arsenic availability to humans, plants, animals and groundwater is higher with higher toxicities than other soil types [20]. This shows that soil physical structure, aggregate stability, compactness, and texture may affect the development of arsenic from parent soil, rocks, and minerals [21].
The behavior of arsenic in soil is extremely complex [22]. Arsenic reacts strongly with the soil solid constituents via time-dependent retention and release processes and is often considered as being a relatively immobile element. The release of As from surficial and sub-surface soils, and from bedrock into groundwater, can be controlled by redox reactions [23]. Redox conditions can enhance the inorganic arsenic mobility by the reductive dissolution of arsenic-bearing inorganic mineral oxides and the reduction of arsenic from arsenate (As (V)) to arsenite (As (III)) [24]. There is considerable evidence that As is released from soils following flooding and development of anaerobic conditions. Numerous studies have demonstrated the release of As below the redox boundary in sediments [25]. Most environmental As problems are the result of mobilization under natural hydrogeologic conditions [21].
Arsenic and heavy metals cause adverse effects on human health [26]. The EPA, the International Agency for Research on Cancer (IARC), and the National Toxicology Program (NTP) classify arsenic as a human carcinogen. Epidemiological studies have shown that inhalation exposure to inorganic arsenic increases the risk of a variety of forms of lung cancer. Epidemiological studies have also shown that ingestion of inorganic arsenic increases the risk of developing skin cancer, most commonly squamous and basal cell carcinomas. In addition, evidence exists that ingestion of arsenic may also increase the risk of certain internal cancers, including tumors of the bladder, kidney, and liver. The long-term health effects associated with non-fatal doses include vascular diseases, skin, lung, bladder, kidney, and liver cancer.
Elevated arsenic in some public water systems in New England was revealed after State and federal regulations required all public water systems to test for the presence of arsenic in groundwater supplies. Over 100 public water systems in both New Hampshire and Maine and at least a dozen systems in Massachusetts and Vermont tested above EPA's maximum contaminant level for arsenic. Causes for the elevated arsenic levels in New England groundwater have been investigated by Boudette, et al. [27], Ayotte, et al. [28]. In each case the authors hypothesized a geologic source for arsenic, but a definitive regional source(s) had not been identified except the common finding that the groundwater from bedrock wells had higher arsenic concentrations than the groundwater from surficial wells. Below is a map of central Massachusetts municipalities showing arsenic in groundwater>10ppb (Figure 1).
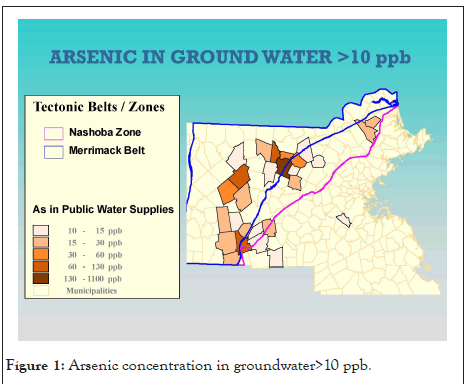
Figure 1: Arsenic concentration in groundwater>10 ppb.
This paper reports on a detailed study of one geographic area of New England that has elevated As levels in soils. High As concentrations were often reported in Worcester county of Central Massachusetts while conducting environmental site assessments to determine the absence/presence of petroleum hydrocarbons and/or hazardous substances due to past land use practices. In developing risk based soil standards for As under Massachusetts environmental regulations, the Massachusetts Department of Environmental Protection (MADEP) designated 20 mg/kg as the reportable concentration and a background concentration of 20 mg/kg for urban fill soils to determine whether a site is contaminated. Arsenic levels in soils measured at a number of hazardous waste sites in Worcester (areas of fill and glacial till) exceeded the MADEP’s background concentrations and do not appear to be related to commercial or industrial processes at the sites.
The main objectives of this study were to comprehend the current status of As and heavy metals at different depths in soil and its correlation with the underlying bedrock with the objectives to (1) evaluate the concentration of arsenic present in soils and bedrock under different depths, locations, and environmental deposits and (2) assess the relationship between arsenic with other heavy metals in the soils, (3) determine if there is a correlation of the underlying bedrock geochemistry and elevated arsenic concentrations in overburden soils. The increasing concern about the risk to human health is the driving force behind the study of the biogeochemical cycling of As in the environment [29].
Geologic features of the study area
The study area for this investigation is located in Worcester and surrounding towns in central Massachusetts. Worcester is on the eastern edge of the central Massachusetts uplands, a plateau dissected by erosion. Regional topography is dominated by small highland areas reaching elevations of 1,015 feet. These small hills (drumlins) trend in a north-south direction and are interconnected by lower lying highlands. The lowlands in between the north-south running hills are at an elevation of approximately 840 feet above mean sea level. These lowlands contain surface waters including wetlands, brooks, and ponds that flow in a southerly direction.
The central Massachusetts area contains two major drainage basins, the northeast flowing Nashua River and the northwest flowing Assabet River. Unconsolidated glaciofluvial deposits of sand and gravel, up to 140 feet thick, constitute the principle aquifers in this basin. The sand and gravel deposits are thick and provide the capability to yield hundreds of gallons of water adequate for home, farm and industrial needs. The water in unconsolidated deposits is generally under water-table conditions.
Most of the bedrock in central Massachusetts are part of the Merrimack terrane, one of four Gondwana terranes in Massachusetts and extends to the coast across northeastern Massachusetts. The Clinton-Newbury fault, a subduction zone between the Nashoba terrane and the Merrimack terrane forms its eastern border. The western margin of the Merrimack terrane is probably the major collision zone between Gondwana on the east and the Bronson Hill belt of Laurentia on the West. The terrane includes a mixture of metamorphosed sedimentary, volcanic, and plutonic rocks of Ordovician, Silurian and early Devonian age. The bedrock in the western portion of Worcester consists of foliated schist, gneiss and granite. Massive granite underlies Malden Hill and millstone to the north and east of the city, respectively, while there is strongly foliated granodiorite to the southeast. Less resistant, thinly bedded and strongly foliated granulite phyllite underlie the downtown and extend up to Wachusett reservoir. Below is a bedrock geologic map showing the type of bedrock and the study area (Figure 2).
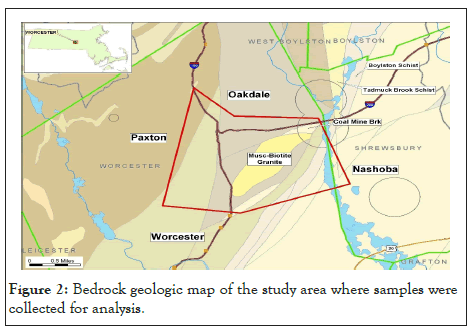
Figure 2: Bedrock geologic map of the study area where samples were collected for analysis.
Existing environmental databases and reports containing soil and groundwater analytical data for As are contained in the archives of state environmental agencies with the Massachusetts Bureau of Hazardous Waste. The arsenic data were compiled from selected sites within the central Massachusetts region. The accumulated set of data provides a confirmation of the widespread reports of arsenic levels that are well above the regulatory “background” levels (20 ppm) in soil (Figure 3). Below is a map (Figure 4) of central Massachusetts showing the maximum As concentrations in soil per town. Below is a table of sites showing the environment of deposition, hillside sites (glacial till), lake and river sites (lacustrine, fluvial, wetland (swamp)), and arsenic concentrations at various depths below land surface (Table 1). A detailed analysis of arsenic distribution reveals a pattern of arsenic migration from the hillside sites to the sites located in valleys and flat lying areas. To validate this theory, a soil sampling study was conducted atop a hillside site (Green Hill) within a small geographic area (400 square feet) near the City of Worcester. Eight continuous soil cores were completed to a depth of 30 feet below ground surface (bgs). At each boring location, a continuous soil core was collected from land surface to the boring depth. From each boring location, composite soil samples were collected in twofoot intervals and analyzed for total As. The soil samples were extracted by acid digestion using EPA Method 3050B and were analyzed by ICP-MS using EPA method 6010B. Below is a bar graph (Figure 5) of arsenic concentrations with depth from each soil sample which confirmed the presence of elevated arsenic concentrations in the hillside.
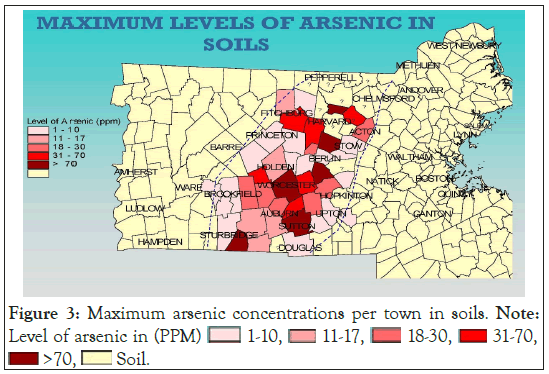
Figure 3: Maximum arsenic concentrations per town in soils. Note: Level of arsenic in (PPM) 


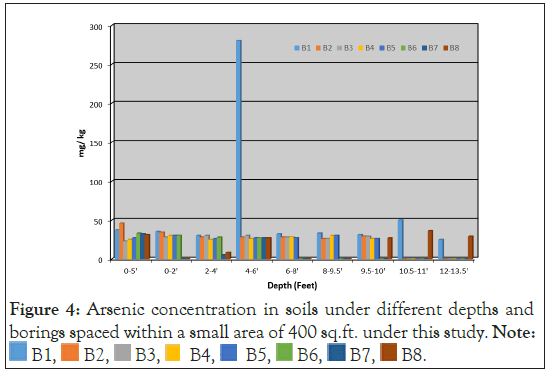
Figure 4: Arsenic concentration in soils under different depths and
borings spaced within a small area of 400 sq.ft. under this study. Note: 
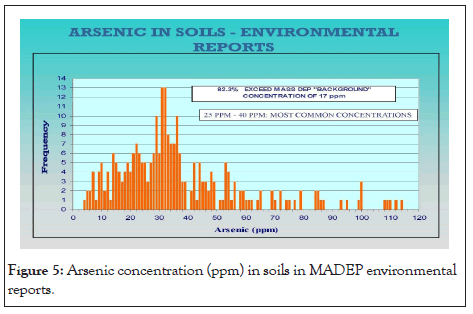
Figure 5: Arsenic concentration (ppm) in soils in MADEP environmental reports.
| Location | Environment of deposition | Depth | Arsenic range (ppm) |
|---|---|---|---|
| West Boylston | Fluvial/Lacustrine | 0-1' | 28 |
| 2-4' | 28 | ||
| 4-10' | 48 | ||
| Weasel Brook | Fluvial | 0-2' | 30 to 60 |
| 2-4' | 23 to 230 | ||
| 4-6' | 40 to 75 | ||
| 6-8' | 115 | ||
| 10-12' | 20 to 230 | ||
| 14-16' | 28 to 160 | ||
| Weasel Brook | Fluvial soil | 2-4' | 20 to 74 |
| 6-8' | 23 to 55 | ||
| Lake Quinsigamond | Fluvial/Lacustrine | 0-1' | 25 to 100 |
| 1-3' | 50 to 750 | ||
| Lake Quinsigamond | Fluvial/Lacustrine | 0-2' | 22 |
| 6-8' | 22 | ||
| 10-12' | 41 | ||
| Worcester Valley | Fluvial | 225 | |
| Worcester Valley | Swamp | 380 | |
| Worcester Valley | Fluvial | 2-10' | 30 to 300 |
| Worcester Valley | Fluvial | 0-1' | 15 to 470 |
| 4-6' | 7 to 340 | ||
| 6-8' | 15 to 770 | ||
| Hancock Hill | Till | 150 | |
| Green Hill | Till | 0-2' | 2.1 to 44 |
| 2-4' | 25 to 36 | ||
| 4-6' | 30 to 280 | ||
| 6-8' | 30 to 38 | ||
| 8-10' | 7 to 72 | ||
| 10-12' | 30 to 53 | ||
| 12-14' | 30 to 40 | ||
| Green Hill, Old Coal Mine | Till | 0-1' | 23 to 34 |
| 2-4' | 37 | ||
| 4-10' | 22 to 40 | ||
| 10-12' | 32 | ||
| Green Hill | Till | 0-2' | 5 to 35 |
| 4-6' | 13 to 53 | ||
| 6-8' | 10 to 55 | ||
| 10-12' | 45 to 60 | ||
| Stone House Hill | Till | 0-1' | 10 |
| 2-4' | 11 | ||
| 4-10' | 9 | ||
| 10-12' | 9 | ||
| Carey Hill | Till | 0-1' | 17 |
| 2-4' | 22 | ||
| 4-6' | 38 | ||
| 6-8' | 20 | ||
| 10-12' | 20 | ||
| Golden Hill | Till | 0-1' | 12 |
| 2-4' | 33 | ||
| 4-10' | 16 | ||
| Eliot Hill | Till | 0-1' | 10 |
| 4-10' | 88 | ||
| 10-12' | 18 |
Table 1: Concentration of Arsenic (As) under different depths and locations with diverse environmental deposits.
Statistical analysis and correlation
Within a small geographic area near the City of Worcester a database of 283 soil sample locations from near the ground surface up to a depth of 30 ft bgs was analyzed and compiled. Soil samples from 126 hillside sites have an average arsenic content of 31 ppm with a range of 4 ppm to 281 ppm. By contrast, 157 samples of soil samples collected from locations in the valleys or flat lying areas have an average of 71 ppm and a range of 7 ppm to 770 ppm. The compiled data are shown below in a frequency histogram.
Both data sets have similar arsenic frequency distribution curves (histograms) with identifiable frequency subsets: 20 ppm to 50 ppm and 50 ppm to 800 ppm. The most common As concentrations ranged from 25 ppm to 40 ppm. The arsenic concentrations exceeded the 17 ppm concentration in 82% of the soil samples as shown below in the histogram below (Figures 6). Statistic 8.1, origin 10.0 and Microsoft Excel were used for statistical analysis and for sorting and plotting the data. R2 was calculated for correlation analysis between As and heavy metals [30], to demonstrate the relationship of As with other heavy metals under the soil profile in the study area. There was a strong relationship of cobalt (Co) R2=99 with As followed by Fe (R2=98), Cr (R2=89) and Ni (R2=66). Arsenic correlated with Nickle which is present in both sulfide phases, cobaltite and pyrite. Nickle concentrations also correlated to cobalt concentrations. Below is a graph (Figure 7) which demonstrates a linear relationship between Arsenic concentrations and Nickle concentrations.
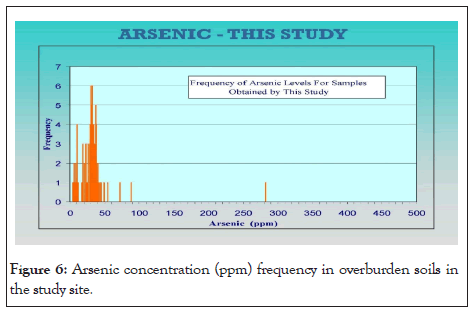
Figure 6: Arsenic concentration (ppm) frequency in overburden soils in the study site.
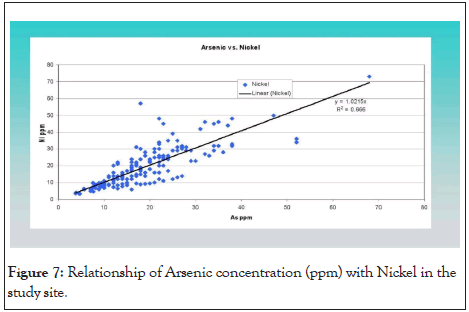
Figure 7: Relationship of Arsenic concentration (ppm) with Nickel in the study site.
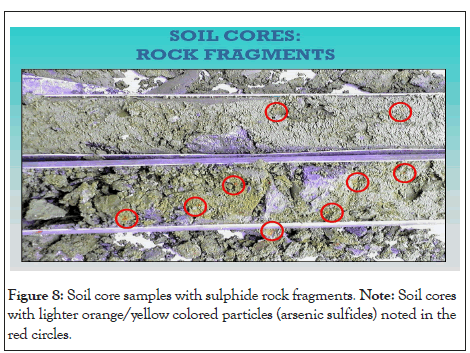
Figure 8: Soil core samples with sulphide rock fragments. Note: Soil cores with lighter orange/yellow colored particles (arsenic sulfides) noted in the red circles.
The vertical distribution of heavy metal concentrations depends on the texture of the soil and the types of soil horizon. The behavior and fractionation of metals, as well as the horizontal profile characteristics such as calcaric, gleyic, stagnic, and mollic, and the corresponding geochemical features, all play an important role in the migration and deposition of metals within the soil horizons (A, E, B, and C). In comparison to sand and silt, the loam clay soil contains twice as much of the heavy metals in soil. Compared to loamy-clay soil, the sandy soil contains less amounts of metals in the upper layer and higher concentrations in the lower soil horizons. Below is a picture of the soil cores with lighter orange/yellow colored particles (arsenic sulfides) noted in the red circles (Figure 8).
The bedrock in the central Massachusetts region is a Paleozoic metasediment, low grade metasedimentary shales and hornfels. Bedrock samples from the soil cores were characterized via electron microprobe analysis which confirmed the presence of pyrites (FeS2) and cobaltites (CoAsS) in the underlying bedrock. Below Table 2 shows the four samples of cobaltite analyzed which shows the elemental compositions of Iron, Nickle, Cobalt, Copper, Sulphur and Arsenic. The As percentages comprised approximately 40%-47%. The sulfide mineralization in the bedrock is typically 0.X% As in Pyrite (FeS2) and ~45% As in Cobaltite (CoAsS).
| Label | Grain 2a | Grain 2a | Grain 2b-1 | Grain 2b-2 |
|---|---|---|---|---|
| Fe | 6.15 | 6.75 | 7.44 | 6.62 |
| Ni | 5.55 | 6.35 | 6.38 | 5.36 |
| Co | 24.01 | 22.76 | 18.82 | 21 .69 |
| Cu | 0.16 | 0.16 | 0.17 | 0. 16 |
| S | 21.93 | 22.52 | 22.40 | 21.63 |
| As | 42.82 | 46.87 | 44.02 | 31.99 |
| Total | 100.61 | 105.42 | 99.22 | 87.45 |
| Note: Spot analyses of Cobaltites from bedrock samples. | ||||
Table 2: Analyses of samples for heavy metals from bedrock.
Other researchers also reported a strong relationship between cobalt and arsenic and showed that with an increased concentration of cobalt there was also an increased concentration of arsenic [31]. They also reported that cobalt bonding was also strong with iron and nickel. Sulfide bonding with cobalt, nickel, and arsenic was also found as (CoNi)As3 , the most common arsenide mineral. Researchers also reported that cobalt contains 36% Co, 45% As and 19% S, Fe, and Ni. In the lithosphere, 70% of the cobalt reserves contain significant arsenic concentration in association with arsenide [32].
The biogeochemical migration of arsenic depends on the oxidation form, or speciation of arsenic [33]. The geology, hydrology and geochemistry are important factors controlling the movement of metallic elements within the solid-aqueous environment [34]. Two geochemical process are responsible for arsenic movement, one to release arsenic from the parent materials and another to retain arsenic in the deep horizon [35]. The redox potential and pH are the major geochemical factor for controlling oxyanion forming elements in the natural process [36].
Analysis of elevated arsenic (30 to 800 ppm) within soils of a broad W-E traverse in Central Massachusetts reveals a pattern of higher concentrations of naturally occurring arsenic at lower elevations, and lower arsenic concentrations at higher elevations. Arsenic levels at each end of the traverse return to the background levels (<20 ppm). Arsenic at the hillside sites vs. sites located in the valleys are on average 50% lower, indicating arsenic migration along the direction of groundwater flow. From our dataset a pattern of arsenic migration can be observed where a substantial proportion of arsenic had been transported from the hillsides toward the valleys. We suggest that groundwater recharged at higher elevations dissolves small amounts of arsenic which is then transported to the flat lying aquifers where the dissolved arsenic is allowed to precipitate on the aquifer material surfaces prior to its discharge to the surface drainage system. It is likely that a changing redox facilitates the dissolution and precipitation: Slightly reduced water due to a decaying organic litter can mobilize minor arsenic which is then reprecipitated when the groundwater enters a zone of atmospheric influence near its discharge point.
Elevated arsenic concentrations in the soils of Central Massachusetts is best explained by the derivation of the soils from local bedrock formations and by the occasional incorporation of sulfides into the soils which may account for the observed arsenic “hot” spots. This study has shown that knowledge of the underlying bedrock geochemistry can aid in the prediction of elevated arsenic concentrations in overburden soils (Figure 9). The Central Massachusetts “arsenic province” is part of a larger lithotectonic zone as previously reported by Ayotte and others (1999-WRIR 99-4162). The map indicates Bedrock geologic map of central Massachusetts and southern New Hampshire prepared from the Massachusetts and New Hampshire geographic information systems. This map is overlain by a bedrock water quality map showing the concentrations of arsenic in groundwater. The elevated arsenic concentrations shown in red circles (large circle=high As concentrations) may be correlated with the geochemistry of the bedrock.
The increasing risk of cancer due to low-level arsenic exposure has prompted the author in this paper to examine the factors controlling the origin and distribution of arsenic in the environment and the ways in which arsenic may be mobilized. The redistribution of arsenic in soils by natural hydrogeologic processes was identified in specific geographic areas. The environment of deposition in which the soils formed correlated to the low to high concentrations of arsenic in soils.
The bedrock underlying Worcester County contains arsenic bearing minerals, specifically Cobaltite (CoAsS), and a correlation of high arsenic in groundwater from bedrock wells with high concentrations in soils may be present. Further studies would be needed to validate this relationship. These same correlating principles of elevated arsenic in bedrock and soil may be applicable to other areas in the U.S for predicting areas with potentially elevated arsenic in soils. A Geographic Information System (GIS) can utilize existing databases to estimate arsenic concentrations in geographic regions throughout the U. S. The issues that can drive arsenic cleanup are legislative mandates, action groups, public awareness/concern, wildlife criteria, groundwater pathway/leachability, surface water pathway, and politics. Increasing awareness and public concern of arsenic in soils, forming arsenic action groups, and creating legislative mandates at the state and local levels can prevent potential exposure to a serious environmental toxin.
[Crossref] [Google Scholar] [PubMed]
[Crossref] [Google Scholar] [PubMed]
[Crossref] [Google Scholar] [PubMed]
[Google Scholar] [PubMed]
[Crossref] [Google Scholar] [PubMed]
[Crossref] [Google Scholar] [PubMed]
[Crossref] [Google Scholar] [PubMed]
[Crossref] [Google Scholar] [PubMed]
[Crossref] [Google Scholar] [PubMed]
[Crossref] [Google Scholar] [PubMed]
[Crossref] [Google Scholar] [PubMed]
[Crossref] [Google Scholar] [PubMed]
[Crossref] [Google Scholar] [PubAg]
[Crossref] [Google Scholar] [PubMed]
[Crossref] [Google Scholar] [PubMed]
[Crossref] [Google Scholar] [PubMed]
[Crossref] [Google Scholar] [PubMed]
[Crossref] [Google Scholar] [PubMed]
[Crossref] [Google Scholar] [PubMed]
[Crossref] [Google Scholar] [PubAg]
[Crossref] [Google Scholar] [PubAg]
[Crossref] [Google Scholar] [Pubmed]
Citation: Doherty K, Hon R (2023) Redistribution of Arsenic in Soils by Natural Hydrogeologic Processes. J Geol Geophys. 12:1121.
Received: 19-Jul-2023, Manuscript No. JGG-23-25759; Editor assigned: 21-Jul-2023, Pre QC No. JGG-23-25759 (PQ); Reviewed: 04-Aug-2023, QC No. JGG-23-25759; Revised: 11-Aug-2023, Manuscript No. JGG-23-25759 (R); Published: 18-Aug-2023 , DOI: 10.35248/2381-8719.23.12.1121
Copyright: © 2023 Doherty K, et al. This is an open-access article distributed under the terms of the Creative Commons Attribution License, which permits unrestricted use, distribution, and reproduction in any medium, provided the original author and source are credited.