Journal of Geology & Geophysics
Open Access
ISSN: 2381-8719
ISSN: 2381-8719
Research Article - (2015) Volume 4, Issue 5
Location of subsurface lithostratigraphic boundaries (breaks) in a drilled sequence requires high precision in identification of the faunal and lithofacies of the sediments or rocks above and below them. Occasionally, difficulties face well site geologists and stratigraphers in locating these boundaries due to the absence of guide faunal assemblages and/or major lithological changes. A new approach is established to delineate breaks between undifferentiated subsurface rock units and to verify the most likely cause for their occurrence using Natural Gamma Ray Spectrometry and High Resolution Dipmeter logs. This depends on the physical response of these tools to the overall characteristics of the rocks penetrated below and above the concerned break. Abrupt changes in the SGR, CGR, Th/K and Th/U of the NGS logs indicate variations in the contents of the radioactive minerals, and consequently changes in geological conditions of deposition of the rocks penetrated i.e. lithostratigraphic breaks. Changes in the quality, density, and regularity of the Dipmeter log patterns of strata are also detected below and above break. A flow chart, illustrating the steps followed for the recognition of lithostratigraphic breaks, is suggested. Ambiguities that may arise in differentiation between unconformities and faults have been discussed.
Keywords: Lithostratigraphic breaks; Undifferentiated rock units; Well logs
Modern stratigraphy pays more attention to the breaks in the sedimentary and stratigraphy records. Measured formations can be subdivided into parastratigraphic units, which can be dated directly if characteristic flora and fauna can be detected in core samples or cuttings [1]. These units are delimited by marker levels above and below. Of substantial extent, these markers are approximately parallel, suggesting a continuous sequence of deposition. Depending on the refinement of the division into stratigraphic units, it may be possible to identify units which correspond to very specific periods in the geological history of a basin, thus providing stratigraphic markers (breaks) of considerable significance. The stratigraphic breaks can vary in their duration in time and in their geographic extent and can be due to non-deposition or erosion or both [2]. In general, these breaks may be surfaces of normal bed boundary between conformable lithostratigraphic sequence, unconformities or faults (Figure 1a). Identification of these breaks in a drilled sequence is of great importance for both academic and practical reasons, especially in reservoir characterization and management.
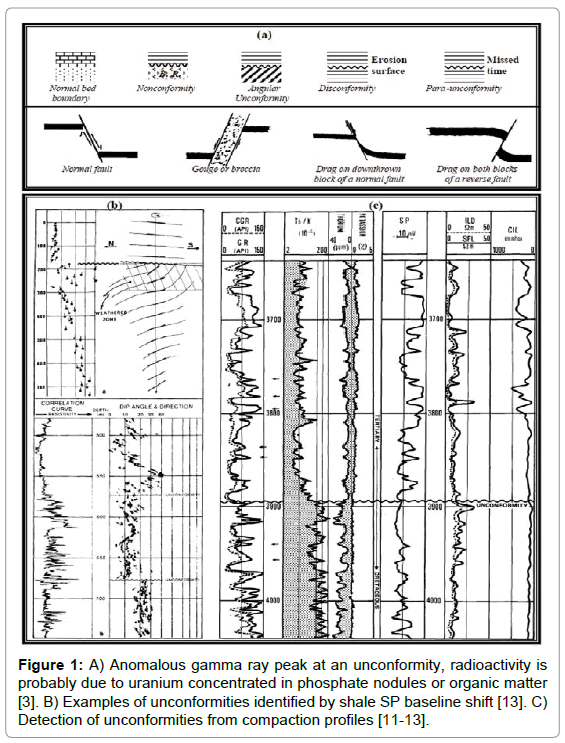
Figure 1: A) Anomalous gamma ray peak at an unconformity, radioactivity is probably due to uranium concentrated in phosphate nodules or organic matter [3]. B) Examples of unconformities identified by shale SP baseline shift [13]. C) Detection of unconformities from compaction profiles [11-13].
In many cases, well-site geologists as well as stratigraphers face difficulties in locating subsurface lithostratigraphic break between undifferentiated rock units having no faunal (marker) assemblages and/or without major lithological changes. Location of these breaks becomes possible, utilizing Natural Gamma Ray Spectrometry (NGS) and Dipmeter (HDT or SHDT) logs, based on the physical response of these tools to the overall characteristics of the rock units below and above the break. The use of these logs to identify this phenomenon involves analyzing each discontinuity on a curve in order to establish the most likely cause for its occurrence.
Major stratigraphic breaks are usually recognizable on dipmeter logs by their dip changes and on NGS log by a change in the thorium/ potassium (Th/K), thorium/uranium (Th/U) ratios or by an anomalous peaks of CGR and SGR (Figures 1b,c and 2a). Nevertheless, many important breaks are far more subtle [3]. Other types of well logging tools such as resistivity, self potential, neutron, density and sonic can be used for detecting breaks but with limited conditions (Figure 2b and c). This is because the types of fluids in the borehole and the logged formations influence these tools. For example, a self-potential or resistivity log discontinuity may arise if there is a change in the salinity and types of drilling mud. Neutron, density or sonic log discontinuities may also arise if there is a gas-oil or oil-water contact.
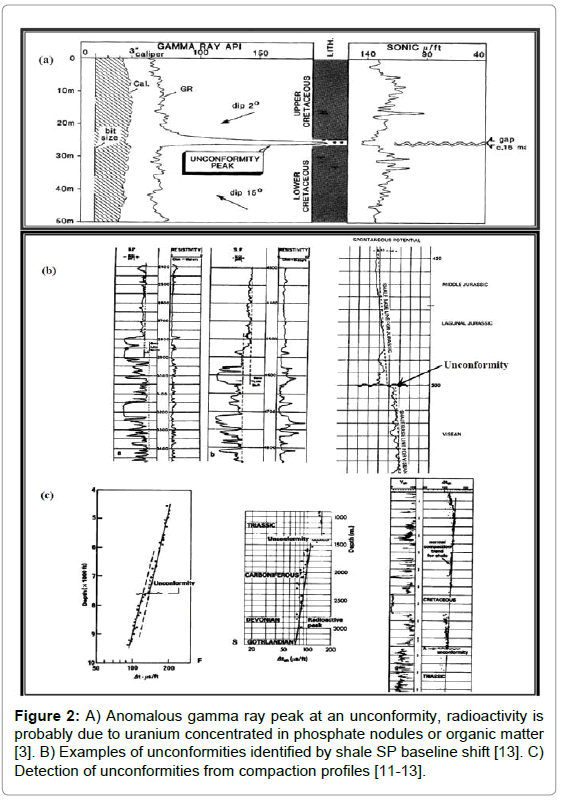
Figure 2: A) Anomalous gamma ray peak at an unconformity, radioactivity is probably due to uranium concentrated in phosphate nodules or organic matter [3]. B) Examples of unconformities identified by shale SP baseline shift [13]. C) Detection of unconformities from compaction profiles [11-13].
A number Natural Gamma Ray Spectrometry (NGS) and High Resolution Dipmeter (HDT or SHDT) logs of several deep exploratory wells have been tested for applying the proposed flow chart in identification the subsurface breaks. These logs have been examined and interpreted to construct a system of sequential steps for tracing subsurface lithostratigraphic breaks between undifferentiated rock units and to establish the most likely cause for break occurrence. This depends on the physical response of these tools to the overall characteristics of the rocks penetrated below and above the concerned break. Two wells of them (FG88-10 and AS418-1X) located at the Geisum and Asharafi oil fields SE the Gulf of Suez and NS21-1 at the off-shore area of northern Sinai, clarify the idea of the research. Locations of these wells are shown in Figure 3.
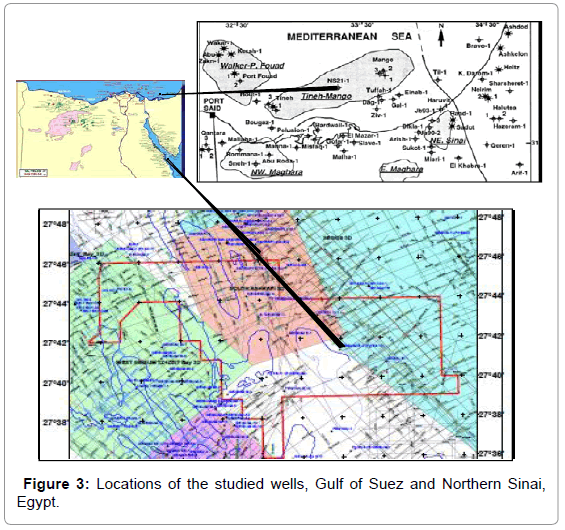
Figure 3: Locations of the studied wells, Gulf of Suez and Northern Sinai, Egypt.
A curve discontinuity or break is any significant response change occurring over a depth interval not exceeding the vertical resolution of the log tool. The break will appear sharper when the depth scale is more compressed and the resolution of the tool is good [4]. Thus it is easier to identify on logs of depth scale 1/1000 than on a 1/500 or 1/200, and if a micro device rather than a macro device records the log data.
Abrupt changes in the SGR, CGR, Th/K and Th/U of the NGS logs indicate variations in the contents of the radioactive minerals, and consequently changes in geological conditions of deposition of the rocks penetrated i.e. lithostratigraphic breaks. In addition, changes in the quality, density, and regularity of the Dipmeter log patterns of strata are also expected below and above break.
Any curve break is an indication of a major change in, at least, one of the factors affecting the response of the tool. This is why a break is significant and why we have to try to determine the reason for it. In addition, any major change in one of the geological parameters will provoke a response change, and thus a discontinuity, but only on those logs which measure parameters susceptible to such changes [4].
Lithostratigraphic breaks on wireline logs fall into two major categories as follows:
I- Breaks corresponding to a major change in lithology
A change in lithology represents a major change in sedimentation conditions and may or may not be a part of a sequential pattern. In the first case, the lithological change only represents the passage from one element of the sequence to the next, e.g. from dolomite to anhydrite. In the second case, several reasons may explain such a change. The choice between them depends on detailed analysis of various log types and making use complementary information on the general geology of the region. These reasons are; unconformity, transgression, erosion, tectonic accident or diagenesis together with mineralogical change [4].
II- Breaks without major lithological changes
The possible causes for these breaks are the following:
- Change in the type of fluid, which appears if there is a gas-oil or oilwater contact and seen by using resistivity, self-potential, neutron, density and sonic logs.
- Textural change, a change in sorting or in cement percentage will affect the porosity and consequently all measurements that depend on it, such as density, hydrogen index, sonic travel time and resistivity.
- Diagenesis, this phenomenon occurs frequently in carbonate sequence. Studying the behaviour of the apparent matrix porosity and transit times from neutron will show up the changes and sonic logs, respectively.
- Erosion may be indicated by a sudden change in the textural parameters. But it may also be the result of an abrupt change with opposing trend on the resistivity curves.
- Tectonic accidents, which may bring into contact two identical lithologies with different petrophysical properties.
- Unconformity, a change in shale baseline, possibly associated with a change in radioactivity may indicate an unconformity. Dipmeter analysis should confirm this.
III- Recognition of lithostratigraphic breaks from NGS logs
The geological significance of radioactivity lies in the distribution of three elemental sources; the radioactive elements of the uraniumradium family, thorium family and the radioactive isotope of potassium 40K [5]. The natural gamma ray spectrometry logs give the amount of each individual radioactive elements in a formation. The abundance of these radioactive elements is controlled by their geochemical behaviour, as follows:
Uranium behaves as an independent constituent, so it has a very heterogeneous, original, sedimentary distribution. Typically, on the logs, uranium is shown by irregular, high peaks corresponding to its uneven distribution. Due to the unusual requirements of its original conditions of deposition, these peaks are associated with unusual environments such as that found in condensed sequence or at unconformity.
Thorium, like uranium, has its origin in the acid and intermediate igneous rocks. It is extremely stable and, unlike uranium, will not generally pass into solution. For this reason it is found in bauxite’s (residual paleo-soils). Thorium and its minerals usually find their way into sediments principally as detrital grains of heavy minerals. Moreover, because of its detrital nature and consequent transport by currents, thorium shows an affinity for terrestrial minerals and, amongst the clay minerals. Potassium is both chemically active and volumetrically common in naturally occurring rocks. It is generally chemically combined in clay silicate structure and in evaporites as salt, and in rock-forming minerals such as feldspars.
The principal use of the natural gamma ray spectrometry logs (SGR, CGR, Th, U, K and their ratios) is the identification of the depositional environments of shales. The affinity of uranium for shales of marine origin has been documented in contrast to the affinity of thorium for terrestrial sediments [6]. Consequently, it has been proposed that the content of uranium in shales compared with that of thorium (Th/U) gives an index of the amount of marine influence in the environment of deposition [5]. Marine shales should have a low Th/U ratio (<2) whereas the reverse is true (>6) for the continental shales [3]. Application of these rules helped in identification the depositional environments of subsurface Cretaceous section in north Sinai [7].
By contrast, the Th/K ratio is a function of the mineralogical composition of the shale. During the weathering processes, thorium and potassium have a different history according to the stability of their host minerals. Thorium bearing minerals are generally more stable than the potassium bearing minerals due to the fact that thorium is insoluble and potassium soluble. Therefore, the stronger the weathering the more the potassium, present in the sediments, will be eliminated and the higher will be the Th/K ratio. Consequently, the Th/K ratio can be used as a compaction indicator [8].
The lithostratigraphical break may represents an interface between different depositional environments. Since thorium, potassium and uranium are environmental indicators, the Th/U and Th/K ratios of the NGS logs can be used for environmental identification. An abrupt changes in the mean Th/K ratio are generally indicative of important variations in the proportion of radioactive minerals that occur when there are changes in geological conditions of deposition (Figure 1c). These correspond to unconformities [3].
Usually high gamma ray values often occur as narrow, isolated peaks (Figure 3a). Considering the geochemistry of the radioactive minerals, these peaks are generally associated with uranium concentrations. As stated above, on the geochemical behaviour of uranium, its concentrations indicate extreme conditions of deposition. Experience has shown that these conditions frequently occur around unconformity where a long passage of time is represented by little deposition. The minerals associated may be uranium-enriched organic matter or phosphate nodules [3].
An example for locating lithostratigraphic breaks, using NGS tools, between subsurface rock units in the AS-418-1X well, Gulf of Suez, is illustrated in Figure 4. This figure shows abrupt changes in shape and magnitude of the NGS logs (SGR, CGR, Th, K, U and their ratios) at three depth intervals in the examined section, separated by the depths 1901 m and 1957-1966.5 m (Figure 4c and d).
At the depth 1901, a distinct decrease in the magnitude of the NGS logs corresponding to variation in the lithology from marl and clay (80->100 GAPI) of the Kareem Formation to salts (<5 GAPI) of the South Gharib Formation with no characteristic gamma ray peak (unconformity) for the break itself at this depth (Figure 4c and d). This unconformity was identified palaeontologically at the same depth (Figure 3b). On the contrary, comparison of the NGS logs of the Rudies and Kareem Formations shows, in general, developed CGR, SGR, Th, K, U logs and their ratios with distinct decrease in the uranium content and the Th/K ratio in the Kareem Formation than those of the underlying Rudies Formation (Figure 4c and d). This NGS pattern suggest different depositional environments of the Rudies/Kareem Formations and confirms the presence of a break (unconformity) between them at depth 1966.5 m, which was identified palaeontologically (Figure 4b). But the NGS logs added that this unconformity has a vertical (upward) extension to a depth of 1957 m (i.e. 9.5 m thick) as deduced from the anomalous CGR and SGR peaks (Figure 4c). This phenomena is matched with the presence of about 9.5 m thick of coarse sandstones separating the examined formations (Figure 4a).
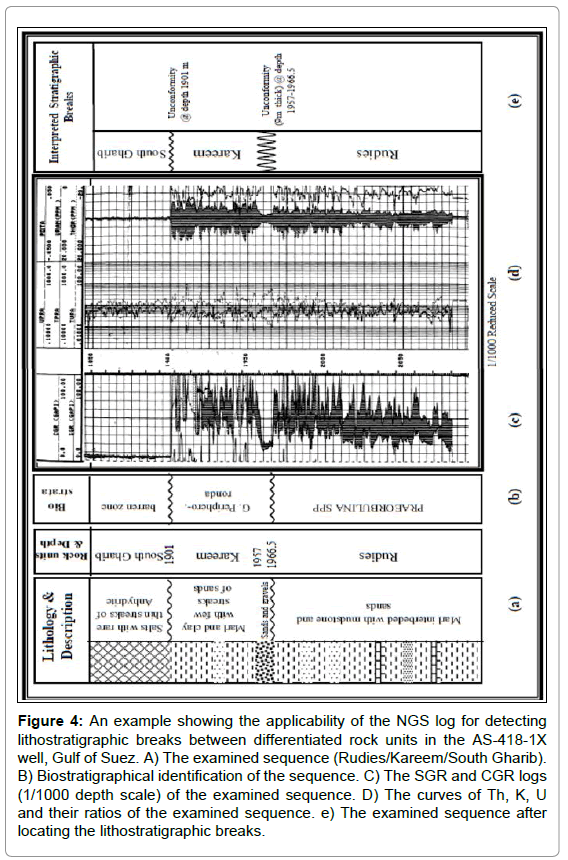
Figure 4: An example showing the applicability of the NGS log for detecting lithostratigraphic breaks between differentiated rock units in the AS-418-1X well, Gulf of Suez. A) The examined sequence (Rudies/Kareem/South Gharib). B) Biostratigraphical identification of the sequence. C) The SGR and CGR logs (1/1000 depth scale) of the examined sequence. D) The curves of Th, K, U and their ratios of the examined sequence. e) The examined sequence after locating the lithostratigraphic breaks.
IV- Recognition of lithostratigraphic breaks from HDT or SHDT logs
As dipmeter logs have specific patterns of each sedimetological, stratigraphical or structural phenomena, they are used for locating discontinuities or breaks between undifferentiated lithostratigraphic units. Unlike the NGS log, dipmeter goes to establish the most likely causes for occurrence of these breaks. The following items describe the dipmeter patterns of the common lithostratigraphic breaks.
1- Normal bed boundary: Since this is an interface between normal lithological sequence, it has a parallel dipmeter pattern (without discontinuity) of constant magnitude, unless there is an obvious difference in dip magnitude and/or direction of the strata (due to differential compaction) below and above it (Figure 5a). Varying conditions of deposition may produce secondary dips not parallel to the enclosing strata. This “cross stratification” will produce a confused DM picture where the parallel dips of the main strata will be mixed with dips of the depositional features (Figure 5b and c). Examination of the NGS log in this case is of utmost importance for solving these ambiguities and locating bed boundary.
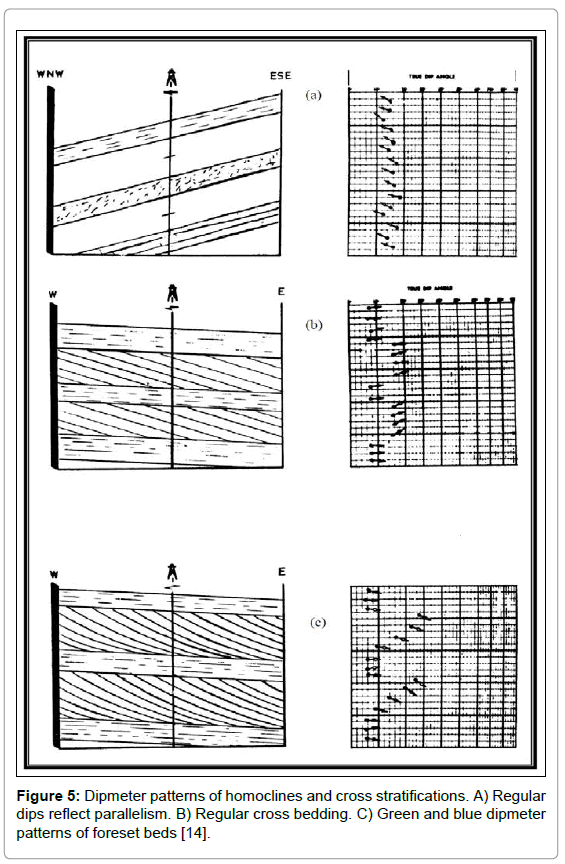
Figure 5: Dipmeter patterns of homoclines and cross stratifications. A) Regular dips reflect parallelism. B) Regular cross bedding. C) Green and blue dipmeter patterns of foreset beds [14].
2- Unconformity: An unconformity is a hiatus in the normal geological sequence caused by a break in the process of deposition, by erosion, or by structural deformation. It results in a missing amount of sediments corresponding to a missing “geological time” as compared to the normal sequence [9]. It is made of two different series of strata separated by a surface (or zone) “surface of unconformity”. The main types of unconformities that shall be concerned in this work are: angular unconformity (in which the strata above and below are not parallel), disconformity (in which strata are parallel on both sides, but there is an erosion surface), and para-unconformity (in which strata are also parallel on both sides, but some time is missed).
a) Detection of angular unconformity: Where the dip of bedding plane above an angular unconformity differs from that of the bedding plane below. Like faults, angular unconformities are characterized by a change of dip trend and magnitude (Figure 6a). In many instances, it is not easy to distinguish a fault from an angular unconformity on a dipmeter log, when there is an increasing or decreasing dip pattern, below the disconformity surface, resulting from erosion of the pre-existing structure. Presence of drag, with blue and/or red DM pattern on one or both blocks of the fault, may be the only way for differentiating the fault from the angular unconformity.
b) Detection of disconformity: Where there is no change in dip trend between the upper and lower strata of the disconformity, it may go unnoticed on the dipmeter log, especially when the unconformity zone is thin (Figure 6b). Nevertheless, a disconformity may be detected by one of the following features:
- Change in the quality, density, or regularity of the dips of strata above and below the break.
- Weathering zone, occurring immediately above or below the break surface which indicated by an interval of incoherent (Random) dipmeter tadpoles (Figure 6c).
- Local erosion, which may result in a local high or local low at the disconformity surface (Figure 6d).
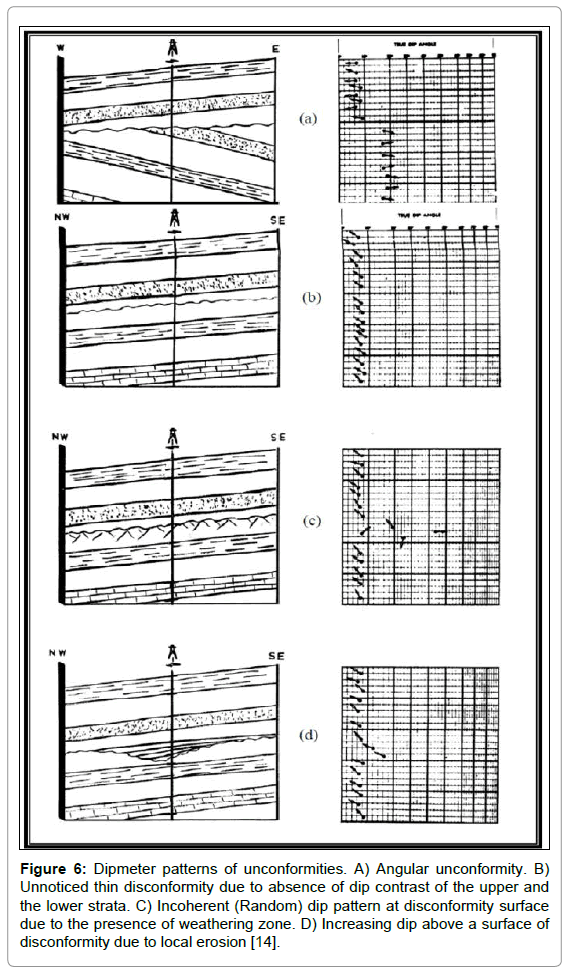
Figure 6: Dipmeter patterns of unconformities. A) Angular unconformity. B) Unnoticed thin disconformity due to absence of dip contrast of the upper and the lower strata. C) Incoherent (Random) dip pattern at disconformity surface due to the presence of weathering zone. D) Increasing dip above a surface of disconformity due to local erosion [14].
In all cases it must be referred to the NGS log to confirm this interpretation by the presence of an anomalous peak(s) at the suggested break level.
c) Para-unconformity on dipmeter logs: A para-unconformity separates parallel strata on both sides, but some time is missed. It appears, in this case as a normal lithological sequence that consists of a series of strata exhibiting the same attitude with parallel, regular dipmeter pattern (Figure 5a). Therefore, break of paraunconformity is almost unnoticed on the dipmeter log, but it may be predictable on the NGS logs if there is a contrast in the depositional environment of the strata below and above it. An anomalous NGS peak may or may not developed at the break level itself.
3- Fault plane (or zone) on dipmeter logs: One of the most important tools for the recognition of faults is the dipmeter. Under favorable conditions it can help to identify the fault, and even provide a means of estimating the strike and dip of the fault plane. Generally, the more drag there is along the fault, the higher the amount of rotation of the two blocks, and the presence of brecciated zone the easier a fault can be seen on dipmeter results [10]. Figure 7a shows how the dipmeter may help in fault identification under various conditions. Figure 7b shows an example of fault prediction using the dipmeter logs in the Gulf of Suez.
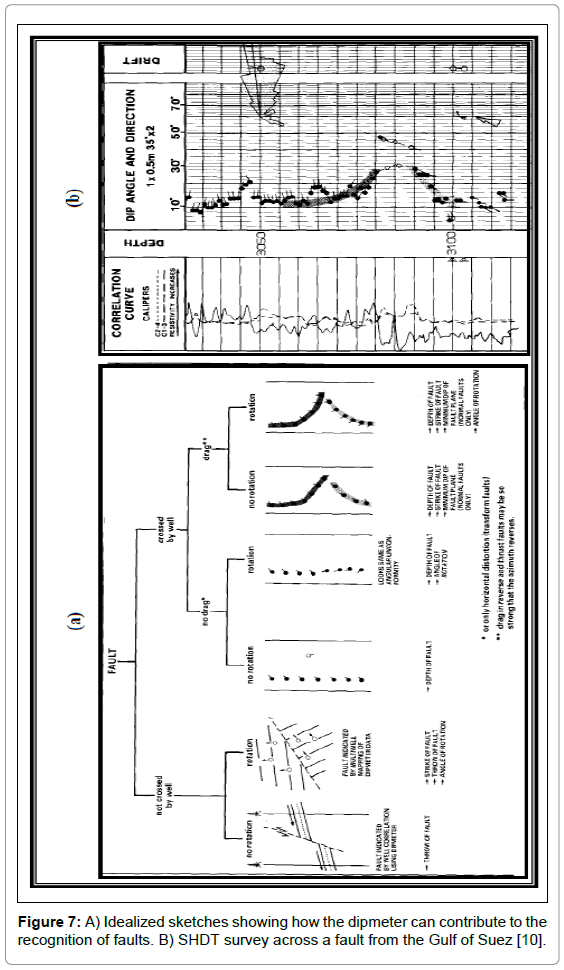
Figure 7: A) Idealized sketches showing how the dipmeter can contribute to the recognition of faults. B) SHDT survey across a fault from the Gulf of Suez [10].
Sometimes, the fault does not show corrlateable anomalies on the dipmeter log (if there is no dip contrast of the faulted blocks) rather than a single large dip arrow (tadpole) when the fracture produces a single clean cut fault plane (Figure 8a). A change of dip from one block to another may be the only distinct evidence of a fault (Figure 8b and c). Generally, a zone of progressive distortion is associated with the fault (Figure 8d).
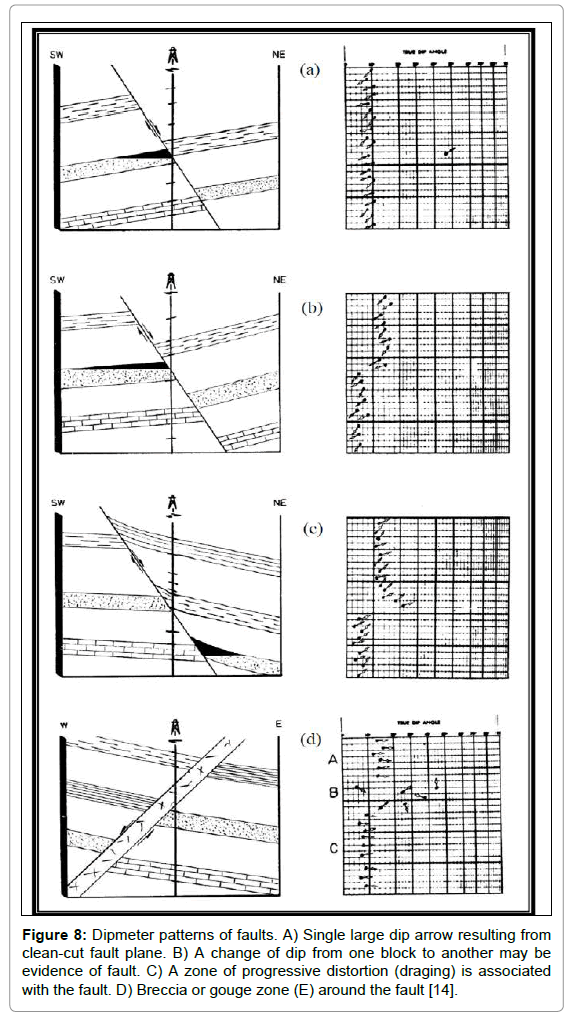
Figure 8: Dipmeter patterns of faults. A) Single large dip arrow resulting from clean-cut fault plane. B) A change of dip from one block to another may be evidence of fault. C) A zone of progressive distortion (draging) is associated with the fault. D) Breccia or gouge zone (E) around the fault [14].
An example for locating lithostratigraphic breaks in the AS-418- 1X well, based on dipmeter tools, and is shown in Figure 9. This figure shows a break (unconformity) between the Kareem and South Gharib Formations represented by incoherent dip pattern at the depth interval from 1901-1904 m (Figure 9c and d). This pattern indicates the presence of weathered zone of about 3 meters between the examined formations. Above this break, a white DM pattern characterizes the salt section of the South Gharib Fm due to the absence of stratification (Figure 9c). Below this break, the Kareem Formation shows a common frequency azimuth of major dip direction eastward (Figure 9c and d). The dipmeter pattern of Kareem Formation differs from that of the underlying Rudies Formation which dips generally northward and NE ward at its top (Figure 8c and d). These formations are separated by a break of white DM pattern at depth ranges from 1957-1966.5 (9.5 m thick) which indicates presence of weathered zone [11-13]. The distinct difference in the dip azimuth that characterizes both the Kareem and Rudies Formations, with the presence of an anomalous NGS peak indicates that this break is an angular unconformity (Figures 4c and d and 9c and d).
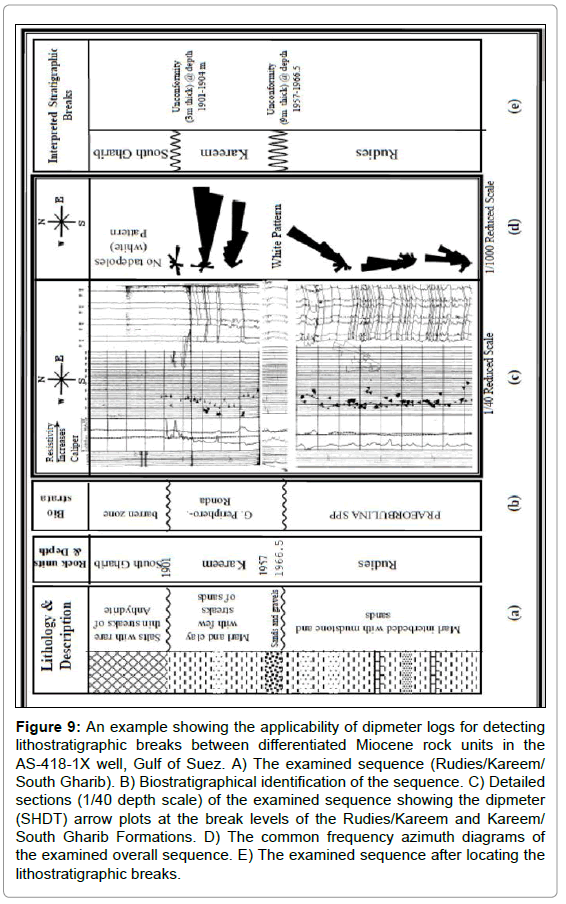
Figure 9: An example showing the applicability of dipmeter logs for detecting lithostratigraphic breaks between differentiated Miocene rock units in the AS-418-1X well, Gulf of Suez. A) The examined sequence (Rudies/Kareem/ South Gharib). B) Biostratigraphical identification of the sequence. C) Detailed sections (1/40 depth scale) of the examined sequence showing the dipmeter (SHDT) arrow plots at the break levels of the Rudies/Kareem and Kareem/ South Gharib Formations. D) The common frequency azimuth diagrams of the examined overall sequence. E) The examined sequence after locating the lithostratigraphic breaks.
Recognition of the lithostratigraphic breaks, in the examined sequence of the AS-418-1X well, using the dipmeter logs shows a great similarity in depth levels with those detected from the NGS logs. In addition, the use of the azimuth frequency diagrams and the tadpole plots of the dipmeter go to establish the thickness of these breaks and the most likely causes for their occurrence [14].
A flow chart has been constructed to illustrate, sequentially, the recommended steps for recognizing breaks between undifferentiated formations that previously identified to time-stratigraphic units (Figure 10). Table 1 summarized the NGS and dipmeter patterns of the common breaks. Examination of these patterns carefully is helpful for solving confusions in interpretation that may arise between unconformities and faults [15].
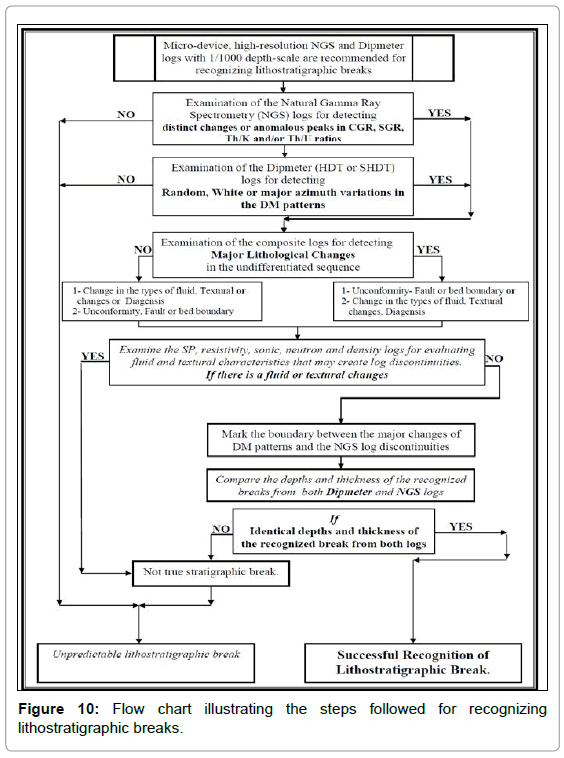
Figure 10: Flow chart illustrating the steps followed for recognizing lithostratigraphic breaks.
| Break | NGS | HDT or SHDT | |
|---|---|---|---|
| Normal Bed Boundary | No Characteristic anomalous peak for the break itself. A change of radioactivity of the strata above and below it may be the only distinct evidence for locating the break. | No random or white patterns characterize the break itself. A dip change of the strata above and below it may be the only distinct evidence for locating the break. | |
| Unconfirmity | Angular Unconfirmity | Distinct anomalous peak or zone with change in Th/K and Th/U ratios above and below the break. | Zone of few, scattered tadpoles of different azimuth forming random or occasionally white pattern separating DM pattern of higher magnitude of the underlying strata than the overlying one. |
| Disconfirmity | Distinct anomalous peak or zone with change in Th/K and Th/U ratios above and below the break. | Zone of incoherent dips or occasionally white pattern separating two identical DM patterns of the strata above and below it. | |
| Para-unconfirmity | No anomalous peak with or without change in Th/K and Th/U ratios of the strata above and below it depending on their radioactivity and depositional environments. | No distinct pattern for the break itself with identical DM patterns of the strata above and below it. Therefore, it is almost unnoticed on the dipmeter logs. | |
| Faults | Brecciated Fault | Zone of distinct anomalous SGR and CGR with or without change in Th/K and Th/U ratios from one block to another. | Zone of no tadpoles (white) pattern due to the absence of stratification. The random pattern is rare. |
| Clean-cut fault | No distinct anomalous peak with or without change in Th/K and Th/U ratios from one block to another. | Single large dip arrow due to the presence of clean cut fault plane. | |
| Normal Fault | Different CGR, SGR, Th/K and Th/U patterns from one block to another below and above the break. | Two identical DM patterns above and below the tracked breack (or an increasing, i.e. Red DM patterns below the break due to dragging on downthrwon block of a normal fault.) | |
| Reverse Fault | Distinct repetition of CGR, SGR, Th/K and Th/U patterns on both sides of the break. | An increasing (Red) and decreasing (blue) DM patterns above and below the traced break, respectively due to dragging that usually affects both blocks of reverse fault. | |
Table 1: Natural Gamma Ray Spectrometry and Dipmeter log responses to various lithostratigraphic breaks.
These rules, illustrated in Figure 10 and Table 1, are followed for detecting the stratigraphic breaks in selected examples of undifferentiated rock units in boreholes of the Gulf of Suez and north Sinai (Figures 11 and 12).
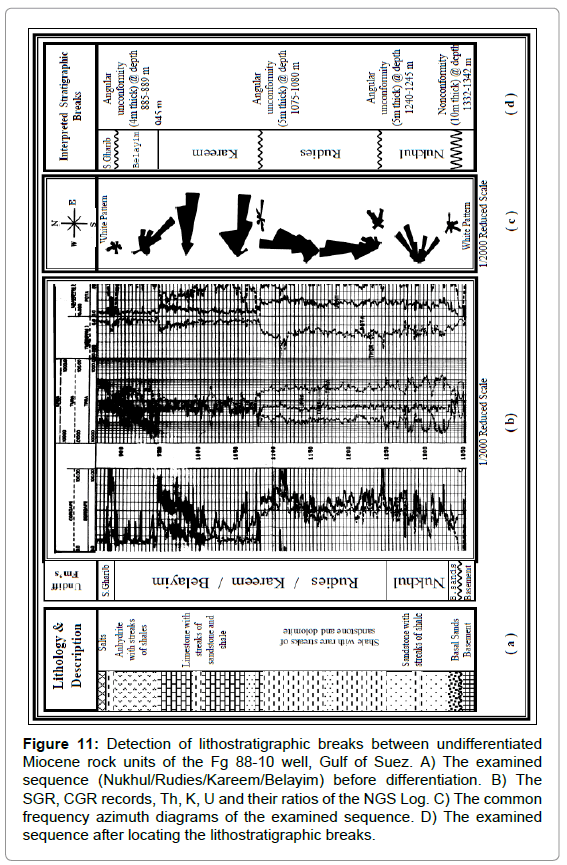
Figure 11: Detection of lithostratigraphic breaks between undifferentiated Miocene rock units of the Fg 88-10 well, Gulf of Suez. A) The examined sequence (Nukhul/Rudies/Kareem/Belayim) before differentiation. B) The SGR, CGR records, Th, K, U and their ratios of the NGS Log. C) The common frequency azimuth diagrams of the examined sequence. D) The examined sequence after locating the lithostratigraphic breaks.
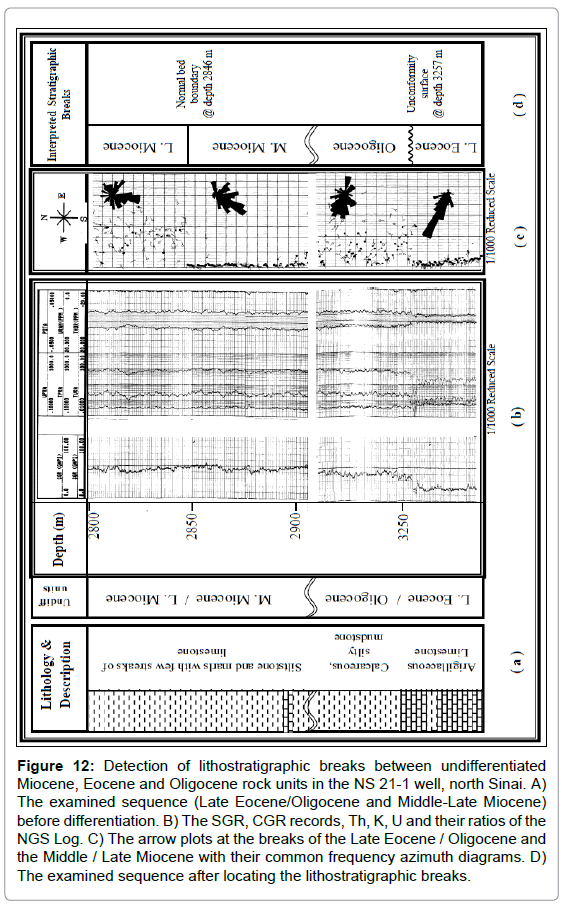
Figure 12: Detection of lithostratigraphic breaks between undifferentiated Miocene, Eocene and Oligocene rock units in the NS 21-1 well, north Sinai. A) The examined sequence (Late Eocene/Oligocene and Middle-Late Miocene) before differentiation. B) The SGR, CGR records, Th, K, U and their ratios of the NGS Log. C) The arrow plots at the breaks of the Late Eocene / Oligocene and the Middle / Late Miocene with their common frequency azimuth diagrams. D) The examined sequence after locating the lithostratigraphic breaks.
The present study introduces a new approach for delineating subsurface breaks in undifferentiated rock units and to establish the most likely cause for their occurrence using natural gamma ray spectrometry and dipmeter logs. This approach deals essentially with already identified time-stratigraphic units, but undifferentiated by boundaries, where there is a difficulty in locating the breaks due to the absence of guide faunal assemblages and/or major lithological changes.
Identification of breaks begins with examination of the given lithology of the undifferentiated rock units, followed by examination of the dipmeter patterns and NGS log curves through a sequential steps of specific targets. A flow chart is constructed, summarizes the steps followed in the break recognition. This is depending on the physical response of both gamma ray and dipmeter tools to the overall characteristics of the rock units below and above the concerned break. Solved examples are tested and proved that this approach is powerful for tracing breaks. Undifferentiated subsurface rock units in boreholes from the Gulf of Suez and north Sinai are examined carefully and lithostratigraphic breaks are successfully recognized.
The authors are greatly indebted to the authorities of the Egyptian General Petroleum Corporation (EGPC) for supplying the wireline logs on which the present work has been based.
SGR: Total gamma-ray reading
CGR: Gamma-ray without uranium
DM: Dipmeter
NGS: Natural gamma-ray spectrometry
HDT: High Resolution Dipmeter Tool
SHDT: Stratigraphic High Resolution Dipmeter Tool
UPRA: Uranium/Potassium ratio
TPRA: Thorium/Potassium ratio
TURA: Thorium/Uranium ratio
SP: Self potential
GAPI: Unit of gamma ray log reading (American Petroleum Institute)