Organic Chemistry: Current Research
Open Access
ISSN: 2161-0401
ISSN: 2161-0401
Research Article - (2014) Volume 3, Issue 1
Copeland and comprehensive multi-index comparison methods were used to rank and screen hazardous chemicals using original and pre-treatment data sets. The results show that the Copeland method can yield similar results for the two data sets. The results of a comprehensive multi-index comparison with the pretreatment dataset also show some similarities to those obtained using Copeland method. The results of the two methods show 18 common chemicals that belong in the top 20 chemicals. Of these chemicals, six are different types of dichlorodiphenyltrichloroethane, seven are POPs, three are polycyclic aromatichydrocarbons, and two are pesticides. These substances should be regarded as chemicals of concern, and appropriate handling should be followed. Overall, the Copeland method with the original dataset can rapidly, reasonably, and effectively rank and screen hazardous chemicals.
With the recent rapid development and change in technologies, the chemical industry frequently produces new materials that can pose a threat to public health and the environment if improperly handled. Approximately 46,000 chemicals have been registered in China. However, a significantly higher number of chemicals have been produced and used, with some produced in significant amounts. The chemicals have brought considerable convenience but can also have drastic effects to the environment and human health. Thus, the management of chemical hazards has become increasingly important. Screening, ranking, and scoring systems are key technologies to the determination of hazardous chemicals.
Ranking, decision-support, and scoring systems can be used to determine potential risks. In environment chemistry, ranking and scoring systems are always used to identify the hazardous chemicals as well as the project to consider. Although numerous ranking and scoring systems have been developed, a consensus on the effective ranking methods has been made. In recent years, chemical risk-ranking programs have been implemented in China, for example, to identify which chemical should be placed in the priority pollutant lists.
To date, chemical risk ranking and scoring methods have been developed in countries such as the US, Canada, EU members, Japan, and Germany. In general, ranking methods can be classified as a “scalar approach method” and “vector performance” method by Halfon and Reggiani [1]. The “scalar approach method” means that an overall rank or score is determined by its own characters. Each object can obtain a score according to the indicators used in the ranking model and the score will not change. The objects are then ranked according to these scores. “Vector performance” is based on the elements of the vector and uses mathematical analysis to obtain the scores. The vector is created by using the indicators of objects. An increase or decrease in the objects will affect the scores. The variability of the score is the main difference between the two methods. Some examples of the “scalar approach method” are CHEMS-1 by Swanson et al. [2], CHEMS-2 by Dunn [3], EURAM by Hansen et al. [4], and SCRAM by Snyder et al. [5]. Some examples of “vector performance” are the Hasse diagram by Halfon et al. [1], Copeland score method (Al-Sharrah [6]), and the comprehensive multi-index comparison (Ren and Xiong [7]).
The aim of this paper is to identify the chemicals that are hazardous to human health in Southeast China and to determine the hazard ranking of these chemicals. The results may provide realistic information that can be used in developing hazard control policies and management. In this study, human health effects, environmental effects, octanol–water partitioning, bioaccumulation, human exposure concentration, and frequency of detection were used as indicators to determine the chemical hazards. The human exposure concentration data of these chemicals were obtained by the project team that completed the previous measurement. The other data for the study can be found in the “Case study” section. The Copeland score method and comprehensive multi-index comparison method were used in this study.
Copeland score method
The Copeland score method was proposed by A. H. Copeland (1951) in a seminar on applications of mathematics to the social sciences at the University of Michigan [8]. It is a simple nonparametric method that has been used to evaluate the election results after voting. To use the method outside the voting field, candidates are replaced by objects, and votes are replaced by indicators. Two papers reported on the investigation of the properties and flaws of the Copeland score method [9,10].
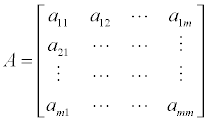
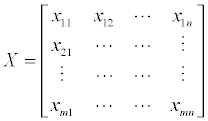
The Copeland score method is based on a comparison of one indicator with another for each pair of objects. For example, assume that the number of chemicals is m, and each chemical has n indicators. From there, we can create a matrix X, as follows:

The next step is to compare each indicator for chemical i and j. Sk,ij is the result of the k indicator comparison. The original Copeland has elements of the comparison matrix of (1,0,-1), so we quote this matrix in our method. Equivalent to the matrix are the (1, 1/2, 0) and (1/3, 1/6, 0) [9].
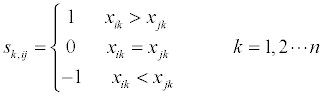
The sum of the comparisons is set as a comparison matrix A. aij is the sum of comparisons for chemicals i and j. The comparison matrix is a special matrix; it has all zeros as its diagonal elements because a comparison of a variable to itself always results in zero. The element in any row i and j is the negative of the element in rows j and i, respectively [6].

After evaluating all the matrix elements, the sum of the row forms the Copeland score for each chemical:

Consequently, the chemicals are ranked according to the Copeland score values. However, the method does not guarantee that the chemicals would have different scores; some objects may have the same rank. The Copeland scores can be easily calculated using a computer.
Comprehensive multi-index comparison method
Again, assume that the number of chemicals is m, and each chemical has n indicators. From there, we can create a matrix X:
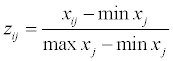
The minimum and maximum values of each column of matrix X is normalized to [0 1], as follows:
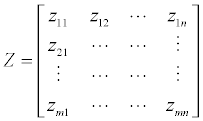
We then create the transposed matrix ZT:
We then determine the weights of each indicator. In our case study, the indicators were given equal weight by assigning a value of 1.
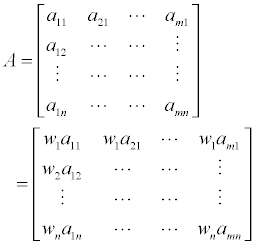
We then create the comparison matrix A.
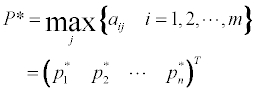
Ideal point:
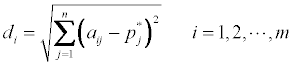
We can then calculate the di and Ti values, as follows:
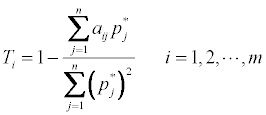
Consequently, the chemicals are ranked according to Ti. The lower the Ti value, the more accurate the ranking. When the Ti are equal in size, then we can use di to rank, the lower the more accurate the ranking [7].
A total of 79 chemicals were selected for screening; all these chemicals were requested by the 2008 Commonwealth and Environmental Protection Project of the Ministry of Environmental Protection of the People’s Republic of China (MEP): “Bioconcentration of Toxic Hazardous Substances in body adipose tissues and risk analysis on human health.. Sample collection and detection were performed in previous. The human exposure concentration and detection frequency data were reported in two articles [11,12]. Human exposure concentration experiments show that eight chemicals were not detected in human adipose tissue samples. Therefore, these eight chemicals are not potential hazards. Thus, at first screening, these eight chemicals can be ignored. The remaining chemicals were then used in the subsequent experiments.
Table 1 presents the toxicological and exposure endpoints used in this article. Four human health effects, two environmental effects, octanol–water partition, bioaccumulation, human exposure concentration, and frequency of detection are included. Human health effects and environmental effects are important indicators that reflect the hazards or toxicities of chemicals; these effects are indispensable in risk assessment. Octanol–water partition is also an important parameter. Octanol is a long-chain alcohol that can reflect the transmission and distribution capacity of organisms.
| Type | Endpoint | Definition |
|---|---|---|
| Human health effects | ||
| Acute | Rodent oral LD50 | The mass of the substance administered per unit mass of the test subject that will kill half of the test subjects within 14 days when orally administered as a single dose. |
| Chronic | Carcinogenicity | Based on supporting evidence. |
| Chronic | Reproductive and Developmental Toxicity | |
| Chronic | Endocrine Toxicity | |
| Environmental effects | ||
| Aquatic, acute | Fish LC50 | The concentration of a substance in water that will cause 50% of fish deaths in the 96 h test. |
| Terrestrial, acute | Bird LD50 | The mass of the substance administered per unit mass of the test subject that will kill half of the test subjects within 14 days when orally administered as a single dose. |
| Exposure potential | ||
| Partition | Octanol–water Partition (Kow) | The ratio of the distribution of a substance between octanol and water. |
| Bioaccumulation | Bioconcentration factor (BCF) | The ratio of the concentration of a chemical in a biological tissue to that in the water surrounding that tissue. |
| Human exposure concentration | The concentration of a chemical in human adipose tissues. | |
| Frequency of detection | Frequency of detection in human adipose tissue samples. |
Table 1: Toxicological and exposure endpoints.
The experimental data were obtained from the Hazardous Substances Data Bank, Pesticide Properties Database, U.S EPA Aggregated Computational Toxicology Resource, and U.S EPA ECOTOX Database whenever possible. Structure-activity relationships (SARs) and quantitative structure-activity relationships (QSARs) such as EPI Suite™ v3.20 and ECOSAR™ v 1.00 were used to estimate missing data. This estimation depends on the availability of reliable SARs or QSARs. If an SAR or QSARs was not available, the missing data were decided through expert judgment. The human exposure concentration and detection frequency data were quoted from previously published two articles.
Toxicological values such as rodent oral LD50, fish LC50, and bird LD50 have negative correlations with the hazards of human health. To simplify the comparison calculations, we used the negative number of the values. Moreover, the octanol–water partition (Kow) and bioconcentration factor (BCF) values were sometimes too large to calculate. Thus, we used log Kow and log BCF. The properties of each chronic effect were divided into three classes: recognized, suspected, and not likely. These parameters were qualitative and could not be calculated using formulas. For this reason, the parameters were assigned the quantitative values of 5, 3, and 0, respectively. At this step, the original dataset was established.
To apply the Copeland method and the multi-index comparison method, programs were written using the MATLAB mathematical software.
After the original data set was constructed, the Copeland and multi-index comparison methods were used to determine the ranking order. The results are listed in Table 2.
| NO. | Chemical | Copeland method | Multi-index comparison | ||
|---|---|---|---|---|---|
| Original data | Pretreatment data | Original data | Pretreatment data | ||
| 1 | 2,4'- DDD | 19 | 19 | 25 | 15 |
| 2 | 2,4'- DDE | 13 | 13 | 12 | 12 |
| 3 | 2,4'- DDT | 1 | 1 | 1 | 1 |
| 4 | 4,4'- DDD | 10 | 10 | 9 | 11 |
| 5 | 4,4'- DDE | 3 | 3 | 6 | 9 |
| 6 | 4,4’- DDT | 2 | 2 | 3 | 2 |
| 7 | alpha-Hexachlorocyclohexane | 35 | 35 | 26 | 28 |
| 8 | beta-Hexachlorocyclohexane | 8 | 9 | 2 | 6 |
| 9 | gamma-Hexachlorocyclohexane | 24 | 23 | 32 | 21 |
| 10 | Lindane | 44 | 44 | 33 | 45 |
| 11 | Hexachlorobenzene | 7 | 6 | 4 | 3 |
| 12 | Mirex | 18 | 18 | 14 | 18 |
| 13 | Aldrin | 9 | 8 | 10 | 8 |
| 14 | Endrin | 5 | 5 | 15 | 5 |
| 15 | Heptachlor | 12 | 11 | 8 | 10 |
| 16 | Chlordane | 36 | 37 | 35 | 47 |
| 17 | Chlordane | 26 | 26 | 31 | 41 |
| 18 | Acenaphthylene | 63 | 63 | 67 | 64 |
| 19 | Acenaphthene | 58 | 58 | 49 | 58 |
| 20 | Anthracene | 49 | 46 | 46 | 48 |
| 21 | 1,2-Benzanthracene | 25 | 22 | 29 | 23 |
| 22 | Benzo[a]pyrene | 6 | 7 | 7 | 7 |
| 23 | Benzo[b]fluorathene | 38 | 38 | 30 | 31 |
| 24 | Benzo(ghi)perylene | 29 | 27 | 39 | 40 |
| 25 | Benzo[k]fluorathene | 11 | 12 | 17 | 13 |
| 26 | Dibenz[a,h]anthracene | 23 | 25 | 21 | 25 |
| 27 | Fluoranthene | 37 | 36 | 59 | 37 |
| 28 | Fluorene | 53 | 53 | 41 | 57 |
| 29 | Indeno[1,2,3-cd]Pyrene | 16 | 15 | 18 | 14 |
| 30 | naphthalene | 32 | 32 | 11 | 24 |
| 31 | Phenanthrene | 22 | 24 | 23 | 32 |
| 32 | Pyrene | 40 | 41 | 42 | 46 |
| 33 | Butyl benzyl phthalate | 52 | 52 | 28 | 43 |
| 34 | 59 | 59 | 38 | 59 | |
| 35 | Dibutyl phthalate | 30 | 30 | 27 | 30 |
| 36 | Dicofol | 14 | 14 | 13 | 17 |
| 37 | Methamidophos | 51 | 51 | 65 | 56 |
| 38 | Chlordimeform | 56 | 56 | 34 | 50 |
| 39 | Acetamiprid | 67 | 67 | 70 | 67 |
| 40 | Alachlor | 43 | 42 | 22 | 35 |
| 41 | Amitraz | 45 | 45 | 20 | 39 |
| 42 | Buprofezin | 60 | 60 | 58 | 60 |
| 43 | Machette | 61 | 61 | 61 | 62 |
| 44 | Carbofuran | 57 | 57 | 63 | 55 |
| 45 | Chlorothalonil | 42 | 43 | 24 | 29 |
| 46 | Clorpyrifos | 17 | 16 | 36 | 16 |
| 47 | Clomazone | 71 | 71 | 68 | 71 |
| 48 | Cyfluthrin | 46 | 48 | 54 | 44 |
| 49 | Cypermethrin | 28 | 28 | 45 | 22 |
| 50 | Deltamethrin | 48 | 49 | 56 | 51 |
| 51 | Diazinon | 55 | 54 | 50 | 52 |
| 52 | Thiosulfan I | 34 | 34 | 48 | 38 |
| 53 | Thiosulfan II | 31 | 31 | 47 | 36 |
| 54 | Mocap | 21 | 20 | 37 | 20 |
| 55 | Phenvalerate | 41 | 39 | 57 | 34 |
| 56 | Esfenvalerate | 15 | 17 | 40 | 26 |
| 57 | Hexythiazox | 64 | 65 | 44 | 63 |
| 58 | Isoproturon | 68 | 68 | 64 | 68 |
| 59 | Cyhalothrin | 39 | 40 | 53 | 42 |
| 60 | Metolachlor | 62 | 62 | 52 | 61 |
| 61 | Nitrfen | 33 | 33 | 16 | 27 |
| 62 | O,O-Dimethyl-S-methylcarbamoylmethylphosphorothioate | 65 | 64 | 66 | 65 |
| 63 | Oxyfluorfen | 47 | 47 | 43 | 49 |
| 64 | Parathion-methyl | 50 | 50 | 51 | 53 |
| 65 | Pirimicarb | 66 | 66 | 71 | 66 |
| 66 | Prometryn | 70 | 70 | 62 | 69 |
| 67 | Pyridaben | 54 | 55 | 60 | 54 |
| 68 | Triazophos | 27 | 29 | 55 | 33 |
| 69 | Tricyclazole | 69 | 69 | 69 | 70 |
| 70 | Trifluralin | 20 | 21 | 19 | 19 |
| 71 | Chlorobiphenyl | 4 | 4 | 5 | 4 |
Table 2: Ranking order of the Copeland method and the multi-index comparison method after data pretreatment.
We calculated the correlation coefficient of these two methods from the results. The correlation coefficient can explain the similarities between the ranking orders. If the correlation coefficient is close to 1, the two ranking orders are highly similar. However, the correlation coefficients of the Copeland and multi-index comparison methods are 0.8424, the two ranking orders are not much similar. Why is there a big difference between the Copeland method and the multiindex comparison method? The principles of these two methods can provide some explanations. The Copeland method only focuses on the numerical magnitude between two values. Therefore, the results of 1
Value pretreatment was performed to improve the results of these two methods. Each indicator to the oral LD50, fish LC50, and bird LD50 toxicity terms can range from zero to five. A cutoff value set for each indicator so that the hazard value for very high or low toxicities would not exceed five or be below zero.
The hazard value for the acute oral toxicity (HVOR) was based on the oral LD50 and was calculated using a continuous, linear function, with the cutoff values at 5,000 and 5 mg/kg:
HVOR = 6.165-1.667log(oral LD50) or 5mg/kg
HVOR = 0 for oral LD50 > 5,000 mg/kg
HVOR = 5 for oral LD50 ≤ 5 mg/kg
The hazard value for the acute aquatic toxicity (HVFA) was based on the acute fish LC50 and was calculated using a continuous, linear function, with the cutoff values at 100 and 0.01 mg/l:
HVFA = 2.5 - 1.25log(LC50) for 0.01 mg/l < LC50 ≤ 100 mg/l
HVFA = 0 for LC50 > 100 mg/l
HVFA = 5 for LC50 ≤ 0.01 mg/l
The hazard value for the acute bird toxicity (HVBA) was based on the acute bird LD50 and was calculated using a continuous, linear function, with the cutoff values at 5,000 and 5 mg/kg:
HVBA = 6.165-1.667log(bird LD50) for 5 mg/kg < bird LD50 ≤ 5,000 mg/kg
HVBA = 0 for bird LD50> 5,000 mg/kg
HVBA = 5 for bird LD50≤ 5 mg/kg
Kow and BCF can range from one to five. Cutoff values were also set for the indicators so that the hazard value would not exceed five or be less than one. The Kow hazard value (HVKow) was calculated using
HVKow = 0.6667log Kow + 0.3333 for 1 < log Kow≤ 7
HVKow = 1 for log Kow≤ 1 and for LD50 > 7
The BCF hazard value (HVBCF) was calculated using
HVBCF = 1.3333log BCF - 0.3333 for 1 < log Kow≤ 4
HVBCF = 1 for log Kow ≤ 1 and for LD50 > 4
The hazard value of the frequency of detection (HVFD) was also calculated using continuous, linear functions, with the cutoff values at 0.001 and 1:
HVFD log(FD) + 3 for 0.001 < FD < 1 and for FD ≤ 0.001
On the other hand, the hazard value of human exposure concentration (HVHEC) was calculated using continuous, linear functions without cutoff values.
HVHEC = log(HEC)
The carcinogenicity, reproductive and developmental toxicity, and endocrine toxicity data did not need pretreatment; the values used in this step are the same as those in the original data.
After data pretreatment, a new dataset was created. The Copeland method and the multi-index comparison method were then used.
Table 2 shows the ranking order of the Copeland method and the multi-index comparison method after data pretreatment, as well as the ranking order of the Copeland method using original data. The correlation coefficients were calculated and are listed in Table 3. The correlation coefficient between the original data and pretreatment data was much higher when the Copeland method was used, indicating that the two results have a high degree of similarity (Figure 1). The correlation coefficient between the original data and pretreatment data in multi-index comparison method is 0.8784, it seem that the pretreatment of the data have much influence on the ranking result. Besides, the correlation coefficient between the multi-index comparison with original data and Copeland method are all about 0.84. While the correlation coefficient between the multi-index comparison with pretreatment data and Copeland method are all about 0.97, which also indicated that the pretreatment of the data have significant influence on the ranking result.

Figure 1: Relationship between the Copeland method results using original data and pretreatment data.
| R | |
| Copeland method onoriginal data vs. pretreatment data | 0.9989 |
| multi-index comparison of original data vs.multi-index comparison of pretreatment data | 0.8784 |
| Copeland method onoriginal data vs.multi-index comparison of original data | 0.8424 |
| Copeland method onoriginal data vs. multi-index comparison of pretreatment data | 0.9718 |
| Copeland method onpretreatment datavs.multi-index comparison of original data | 0.8419 |
| Copeland method onpretreatment datavs. multi-index comparison of pretreatment data | 0.9736 |
Table 3: Correlation coefficients of the Copeland method and the multi-index comparison method.
Although the correlation coefficients between the Copeland method and the multi-index comparison method reached 0.97, the ranking orders were not very similar, particularly the middle part of the rank orders (Figure 2). However, the top and last parts of the rank order are highly similar. This similarity is sufficient in identifying the hazardous chemicals.

Figure 2: Relationship between the Copeland method and the multi-index comparison method results using pretreatment data.
As a result, the Copeland method seems much more convenient, it can give a good ranking result without data pretreatment. The multiindex comparison method is not very good at deal with original data, but it also can give a good ranking result with data pretreatment.
The top 20 ranked chemicals are presented in Table 4. In the top 20, the three ranking results share 18 common chemicals. These chemicals were then classified into four general groups: six kinds of dichlorodiphenyltrichloroethane (DDTs), seven kinds of other POPs, three kinds of polycyclic aromatic hydrocarbons, and two kinds of pesticides. These substances should be regarded as chemicals of concern for human health, and appropriate management should be taken. From the result, the ranking of 2,4ʹ-DDT, 4,4ʹ-DDT, 4,4ʹ-DDE, chlorobiphenyl, endrin, benzo[a]pyrene, hexachloro cyclohexane, and aldrin were relatively high because of their chronic effects and high human exposure concentrations. Some of these pesticides are still being used in some regions of China. Thus, the use of these products may increase the concern on the potential health hazards to humans.
| Rank | Copeland method | Multi-index comparison | ||
|---|---|---|---|---|
| Original data | Pretreatment data | Original data | Pretreatment data | |
| 1 | 2,4'- DDT | 2,4'- DDT | 2,4'- DDT | 2,4'- DDT |
| 2 | 4,4'- DDT | 4,4'- DDT | beta-Hexachlorocyclohexane | 4,4'- DDT |
| 3 | 4,4'- DDE | 4,4'- DDE | 4,4’- DDT | Hexachlorobenzene |
| 4 | Chlorobiphenyl | Chlorobiphenyl | Hexachlorobenzene | Chlorobiphenyl |
| 5 | Endrin | Endrin | Chlorobiphenyl | Endrin |
| 6 | Benzo[a]pyrene | Hexachlorobenzene | 4,4'- DDE | beta-Hexachlorocyclohexane |
| 7 | Hexachlorobenzene | Benzo[a]pyrene | Benzo[a]pyrene | Benzo[a]pyrene |
| 8 | beta-Hexachlorocyclohexane | Aldrin | Heptachlor | Aldrin |
| 9 | Aldrin | beta-Hexachlorocyclohexane | 4,4'- DDD | 4,4'- DDE |
| 10 | 4,4'- DDD | 4,4'- DDD | Aldrin | Heptachlor |
| 11 | Benzo[k]fluorathene | Heptachlor | naphthalene | 4,4'- DDD |
| 12 | Heptachlor | Benzo[k]fluorathene | 2,4'- DDE | 2,4'- DDE |
| 13 | 2,4'- DDE | 2,4'- DDE | Dicofol | Benzo[k]fluorathene |
| 14 | Dicofol | Dicofol | Mirex | Indeno[1,2,3-cd]Pyrene |
| 15 | Esfenvalerate | Indeno[1,2,3-cd]Pyrene | Endrin | 2,4'- DDD |
| 16 | Indeno[1,2,3-cd]Pyrene | Clorpyrifos | Nitrfen | Clorpyrifos |
| 17 | Clorpyrifos | Esfenvalerate | Benzo[k]fluorathene | Dicofol |
| 18 | Mirex | Mirex | Indeno[1,2,3-cd]Pyrene | Mirex |
| 19 | 2,4'- DDD | 2,4'- DDD | Trifluralin | Trifluralin |
| 20 | Trifluralin | Mocap | Amitraz | Mocap |
Table 4: Top 20 Hazardous Chemicals.
The results of this study show that the Copeland method is a simple and effective ranking and screening method. The ranking order of the Copeland method using original data can rationally explain the hazard relationships between 71 chemicals. In our study, the indicators of human exposure concentration and detection frequency are more significant for ranking results. The Copeland method can be easily performed using software, thus making the ranking, screening, and assessing of hazardous chemicals more convenient. If necessary, expert judgment can be used to add weight to the indicators.
We gratefully acknowledge the financial support from the 2008 Commonwealth and Environmental Protection Project of the Ministry of Environmental Protection of the People’s Republic of China: Bioconcentration of Toxic Hazardous Substances in Body Adipose Tissues and Risk Analysis on Human Health and the 2009 Commonwealth and Environmental Protection Project of the Ministry of Environmental Protection of the People’s Republic of China: New Chemical Substances’ Harmful Impact Prediction and Evaluation of Ecological Research. This work was also supported by the Natural Science Foundation of China (Nos. 50872052, 51172107, and 21106072), the National High Technology Research and Development Program of China (863 Program, No. 2009A A05Z313), the Jiangsu Province Environmental Protection Scientific Research (No. 201123), and A Project Funded by the Priority Academic Program Development of Jiangsu Higher Education Institutions and National High Technology Research and Development Program 863 (No,2013 AA06A308).