Journal of Developing Drugs
Open Access
ISSN: 2329-6631
ISSN: 2329-6631
Research Article - (2018) Volume 7, Issue 1
Drug discovery research based on marine organisms is a big challenge. However, lack of facilities and competent human resources stand as a barrier on the way of research. More in-depth study especially on deep-sea natural products needs to be carried out to solidify the research on the potential for marine organisms to contribute to the future of drug discovery. The total drug discovery processes including collection of marine organisms, extraction, isolation, structure elucidation, biological assay and experimental screening as well as clinical trials is a very long journey and big challenge. Therefore, researchers pay a big attempt to design and discovery of synthetic congeneric leads by derivatizing the natural potent compounds. Therefore, In-silico High throughput screening based on QSAR and molecular docking has been attempted in the present study for the design and discovery of promising anticancer compounds considering existed marine sponge-derived hymenialdisine analogs which are protein kinase inhibitors having nanomolar activities against CDKs, Mek1, GSK 3β and CK1. It may crystallize crucial features for the design and discovery of promising anticancer HMD compounds which could be proposed for further synthesis and testing. QSAR and molecular docking analysis of HMD analogs are being carried out by freely accessible open source software which are very economical and potential in drug discovery attempt.
Keywords: Marine sponges; Hymenialdisine (HMD); CDK5/p25 inhibitors; QSAR; Computed structural indices; Molecular docking; Anticancer drug design
Microbial symbionts of marine sponges play a significant role for the generation of medicinal leads. Lacking any protective shell or means of escape, sponges are evolved to synthesize a variety of natural novel leads against cancer, bacterial, viral, fungal and parasitic diseases. Drug resistance is one of the major issues which could be solved by the treatment with potent natural products [1,2]. Many marine natural products have successfully been undergoing on the late stages of clinical trials, as for example ara-A (vidarabine), an anti-viral drug used against the herpes simplex encephalitis virus. Moreover, many marine-sourced candidate structures have been selected as promising leads for extended preclinical assessment, including manzamine A (activity against malaria, tuberculosis, HIV, and others), lasonolides (antifungal activity) and psammaplin A (antibacterial activity).
Potential secondary metabolite hymenialdisine was isolated from marine sponges belonging to the genera Acanthella, Axinella and Hymeniacidon isolated [3,4]. It was shown to be a potent inhibitor (IC50=10-40 nM) of the protein serine/threonine kinases CDK5, mitogen-activated protein kinase-1, and casein kinase 1. These protein kinases regulate several vital cellular functions such as gene expression, cellular proliferation, membrane transport and apoptosis [5]. HMD in the micromolar range was shown to produce antiproliferative effects against human tumor cell lines, presumably as a result of CDK and Mek inhibitory activity [6]. Further, HMD was shown to be a micromolar inhibitor of NF-kB mediated gene transcription in U937 cells, [7-9]. Indoloazepines were designed from the structure of natural template hymenialdisine and these compounds were tested against the production of IL-2 and TNF-α. The indoloazepines were shown to treat inflammatory diseases, particularly diseases associated with kinases NF-κB or GSK-3β activation or NF-κB activated gene expression products. The indoloazepines were also useful for the treatment of cancer by the inhibition of kinases CHK1 and CHK2 [10]. The challenging syntheses and their evaluation as kinase inhibitors of hymenialdisine and its analogues were described by Nguyen et al. in a review [11].
Therefore, HMD was taken as a major scaffold to synthesize a number of potential compounds. An attempt has been made by Wan et al. to synthesize many congeners having significant anticancer activities against different protein kinases [12]. Hymenialdisine contains pyrrolo[2,3-c]azepine nucleus. In order to explore crucial structural features of the pyrrolo[2,3-c]azepine skeleton as a protein kinase inhibitory scaffold, descriptor based QSAR has been developed. Theoretical molecular descriptors include topological indices or numerical graph invariants that are widely used in the theoretical QSAR research for predicting biological activities of chemical compounds. Molecular descriptors considered in our study consist of topological, constitutional, electrostatic, geometrical and physicochemical parameters solely computed from the structures of HMD compounds. Such QSARs are useful for the prediction of newly designed HMD congeners prior to the experimental testing.
A synthetic medicinal chemist using traditional methods of synthesis can produce a limited number of compounds. In contemporary drug design one can generate millions of virtual combinatorial compounds shortly. Therefore, it is necessary to develop QSAR models by using non-empirical parameters which are also called as theoretical molecular descriptors. In experimental drug design, synthesis and structure activity relationship of molecules are time consuming, expensive and involves animal sacrifices. Before the experiment, one can tackle such situation with a different view based on the application of QSAR models for predicting biological activity of the virtual compounds which are being subjected for further ligandreceptor interaction studies to predict mechanism of action.
In the next step, structure based molecular docking is being carried out for predicting the mode of binding of congeneric HMD compounds. This study will help to design and screen new active congeneric potent analogs. Promising newly designed hits with potential activities arising out of these studies will be proposed for the synthesis and testing against different protein serine/threonine kinases such as CDK5, mitogen-activated protein kinase-1, casein kinase 1, etc for biological screening.
Selection of biological activity data
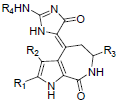
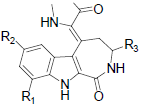
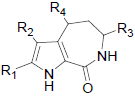
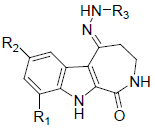
In the present study, a series of 52 HMD compounds having Pyrrolo[2,3-c]azepine scaffold showing good inhibitory effects on CDK5/p25 (Table 1) were taken into consideration for QSAR based on computed structural indices based QSAR modeling. Pyrrole ring was replaced by halo indole to generate potent compounds. 2-amino imidazole and pyridine derivatives showed a potent inhibition towards CDK5/p25 kinases. Hydrazone and glycocyamidine indole analogs also play a great role for producing biological activities. IC50 were calculated by conducting assays at 1.5 μM ATP for CDK5/p25 [12].
 |
|||||||||||
| Compound number | Substitution points | Activity (pIC50) |
|||||||||
| R1 | R2 | R3 | R4 | ||||||||
| 1 | Br | H | H | H | 1.431 | ||||||
| 2 | Br | Br | H | H | 1.251 | ||||||
| 3 | H | H | H | H | 0.95 | ||||||
| 4 | H | Br | H | H | 1.102 | ||||||
| 5 | Cl | Cl | H | H | 1.207 | ||||||
| 6 | Br | Br | CH3 | H | 0.6 | ||||||
| 7 | Br | Br | H | CH3CO | 0.273 | ||||||
| 8 | Br | Br | H | C2H5 | -0.959 | ||||||
 |
|||||||||||
| Compound number | Substitution points | Activity (pIC50) |
|||||||||
| R1 | R2 | R3 | R4 | ||||||||
| 9 | H | H | H | H | 0.752 | ||||||
| 10 | H | F | H | H | 0.752 | ||||||
| 11 | H | Cl | H | H | 0.718 | ||||||
| 12 | H | Br | H | H | 0.671 | ||||||
| 13 | H | SO2CH3 | H | H | -0.093 | ||||||
| 14 | H | NO2 | H | H | 0.146 | ||||||
| 15 | H | NH2 | H | H | 0.166 | ||||||
| 16 | NO2 | H | H | H | 0.962 | ||||||
| 17 | NH2 | H | H | H | 0.728 | ||||||
| 18 | H | Br | CH3 | H | -0.004 | ||||||
| 19 | H | Br | H | CH3CO | -0.708 | ||||||
 |
|||||||||||
| Compound number | Substitution points | Activity (pIC50) |
|||||||||
| R1 | R2 | R3 | R4 | ||||||||
| 20 | Br | Br | H | 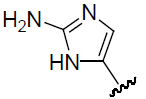 |
-0.911 | ||||||
| 21 | Br | Br | H | 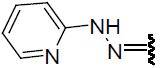 |
-1.915 | ||||||
| 22 | Br | Br | H | 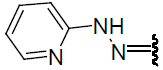 |
-0.101 | ||||||
| 23 | Br | Br | H | 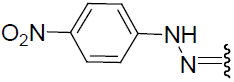 |
-0.579 | ||||||
| 24 | Br | Br | H | 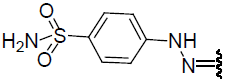 |
-1.1 | ||||||
| 25 | Br | Br | H |  |
-0.274 | ||||||
| 26 | Br | Br | H |  |
-0.534 | ||||||
| 27 | Br | Br | H |  |
-1.082 | ||||||
| 28 | Br | Br | H |  |
-1.352 | ||||||
| 29 | C6H5 | H | H | 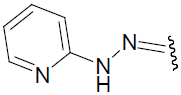 |
-1.365 | ||||||
| 30 | Cl | Cl | H | 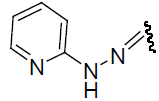 |
-0.839 | ||||||
 |
|||||||||||
| Compound number | Substitution points | Activity (pIC50) |
|||||||||
| R1 | R2 | R3 | |||||||||
| 31 | H | H | 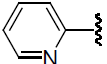 |
0.120 | |||||||
| 32 | H | F | 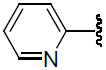 |
1.091 | |||||||
| 33 | H | Cl | 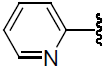 |
0.090 | |||||||
| 34 | H | Br | 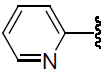 |
0.359 | |||||||
| 35 | NH2 | H |  |
-1.352 | |||||||
| 36 | H | Cl | 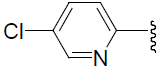 |
0.747 | |||||||
| 37 | H | Cl | 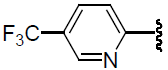 |
0.060 | |||||||
| 38 | H | Cl |  |
0.928 | |||||||
| 39 | H | Cl |  |
1.494 | |||||||
| 40 | H | Cl |  |
-0.725 | |||||||
| 41 | H | Cl | 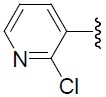 |
1.301 | |||||||
| 42 | H | Cl | 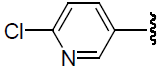 |
1.301 | |||||||
| 43 | H | Cl | 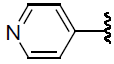 |
0.363 | |||||||
| 44 | H | Cl | 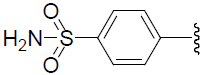 |
1.229 | |||||||
| 45 | H | Cl |  |
1.091 | |||||||
| 46 | H | F |  |
1.124 | |||||||
| 47 | H | F |  |
0.359 | |||||||
| 48 | H | F |  |
1.920 | |||||||
| 49 | H | F | 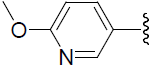 |
-0.466 | |||||||
| 50 | H | F | 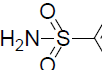 |
1.920 | |||||||
| 51 | H | F | 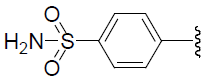 |
1.2 | |||||||
| 52 | H | F | 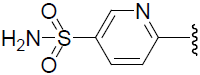 |
0.752 | |||||||
Table 1: Biological activity data.
Optimization of chemical structures
The chemical structures were drawn into 2D which was then converted into 3D modules. 3D structures were minimized by MM2 force field [13] using a value of 0.001 as dielectric constant considering Chem3D Ultra. Optimization of all the structure was performed by using Chemdraw software for making them stable energetically [14]. For the computation of theoretical molecular descriptors, these energetically minimized stable conformations were then taken into consideration into descriptor calculation module.
Descriptor calculation
Many theoretical Molecular descriptors were calculated using PaDEL Descriptor Computation [15] open source molecular property calculation freeware which can calculate a number of 1875 descriptor including 1444 1D, 2D descriptors and 431 three dimensional (3D) descriptors and 12 types of fingerprints (total 16092 bits) using the Chemistry Development Kit. These structural indices are numerical quantification of molecular size, shape, symmetry, complexity, branching, cyclist, stereo electronic character, etc. derived by the application of graph theory and play a crucial role in QSAR and molecular modeling [16-19].
Prior to the QSAR model development, the descriptor set is reduced into 1177. The rationale behind the data mining is that descriptors with perfectly constant and highly inter-correlated descriptors were removed considering variance and correlation coefficient cut-off values of 0.0001 and 0.99 using V-WSP algorithm [20] incorporated into vWSP module of Nano BRIDGES software [21]. Descriptor data is given in Table S1. As the number of structural predictors greatly exceeds the number of compounds, selection of important predictors is necessary for the QSAR modeling. Genetic algorithm-multiple linear regression (GA-MLR) has been used for the development of QSAR model considering reduced predictors data after variable selection by genetic algorithm method [22,23].
Statistical modeling by GA-MLR
Computational programming has been incorporated as a stochastic optimization tool in GA which is based on the cross over and mutation concept of combination of genes to produce chromosome. GA is a very powerful tool to explore many solutions to a large problem space. In this method, each gene is numerically encoded by a descriptor and each chromosome consists of combination of genes representing a population consisting of combination of molecular descriptors. In descriptor combination, a binary string of digits containing the values of “1” or “0” are given. It signifies its presence of absence. The value of “1” implies that the corresponding descriptor is included for the parent and “0” indicates that the descriptor is excluded. The length of each string is same and is equal to the total number of descriptors. Fitness function is calculated by considering the following default parameters as modeled in Nano Bridges software: Total number of iterations=100, equation length=5, crossover probability=1, mutation probability=0.5, initial number of equations generated=100, number of best equation selected=20, smoothing parameters (LOF calculations)=10. A population of 100 different random combinations of the calculated molecular descriptors is generated. A QSAR model is developed based on each parent combination of descriptors for the entire data set using MLR. Fitness function of each model is formulated in term of Q2 Loo or R2 where, Q2 Loo represents cross-validated R2. Values of Q2 Loo and R2 are calculated by the standard equation [24,25].
Molecular docking
The crystal structure of CDK5/p25 (PDB ID: 1UNG) complexes with aloisine co-crystal was selected as receptor for the docking studies. The protein was downloaded and prepared by removing water molecules and hydrogen atoms in the H-depleted target molecule were added. A grid was generated surrounding co-crystallized ligand bound with the active cavity of target. Flexible docking method was incorporated in Argus Lab 4.0.1 freeware which allows free rotation of the ligand inside target cavity to generate multiple conformers that can produce many 50 docked complex poses considering grid resolution (angle) of 0.4 degrees as default value. The best complex pose with minimal interaction energy has been taken into consideration for better explanation of mode of interaction between the ligand and active amino acid residues of the receptor protein [26,27].
QSAR modeling
Quantitative structure activity relationship models have been generated for 52 Pyrrolo[2,3-c]azepine skeleton of hymenialdisine analogs by considering various set of molecular descriptors including 1 dimensional, 2 dimensional and 3 dimensional descriptors by using GA-MLR methods of NanoBridges software. The impact of the different computed descriptors on CDK5/p25 inhibition has been captured by the various validated training QSAR modeled parameters. A number of training models were generated by dividing the data set into different test and training set using Kennard stone method [28]. In this study, QSAR model showing best results in terms of CDK5/p25 inhibition was reported in Table 2. Test set consists of 27% of the total data whereas training set consists of 73% of the total observation. Compound number 1, 6, 16, 21, 22, 23, 28, 31, 37, 39, 40, 48, 49, 50 were taken as test set. It can produce the maximum model quality in terms of R2, Q2 Loo, R2 pred and r2 m (for the test set) values of 0.781, 0.685, 0.620 and 0.763 respectively.
| B.A=-0.97669(+/-0.93078)+0.06475(+/-0.02067) RDF60m+0.26238(+/-0.10625) SdsN-0.9632(+/-0.35784) RDF20s+0.00302(+/-0.00273) fragC+3.41726(+/-1.08703) MATS8i +3.59907(+/-0.81349) MATS7e | |
| N=52, R2=0.781, Q2Loo=0.685, R2pred=0.620, SEE=0.429, RMSEP=0.713, F=18.486 (DF :6, 31), r2m (test)=0.763, average r2m(test)=0.747, delta r2m(test)=0.031 (Equation 1) | |
| Model parameters | Physical interpretation |
| RDF60m | Radial distribution function-6.0/weighted by atomic mass |
| SdsN | (Atom-type E-state indice): Sum of dsN E-states |
| RDF20s | Radial distribution function index |
| fragC | (2D): Complexity of a system |
| MATS8i | (2D autocorrelations): Moran autocorrelation of lag 8 weighted by ionization potential |
| MATS7e | (2D autocorrelations): Moran autocorrelation of lag 7 weighted by Sanderson electronegativity |
Table 2: Best QSAR model showing CDK5/p25 inhibition along with physical parameters.
R2 and Q2Loo of a model are calculated by
R2=1-[Σ(Yobs-Ycalc)2/Σ(Yobs-Ῡ)2] and
Q2Loo=1-[Σ(Yobs-Ypred)2/Σ(Yobs-Ῡ)2]
Where Yobs and Ypred indicate observed and predicted activity values, respectively, and Ῡ indicates mean activity value of training molecules. A model is considered acceptable when the value of Q2Loo exceeds 0.5.
Rpred2=1-[Σ(Ypred test-Ytest)2/Σ(Ytest-Ῡtraining)2]
where, Ypred test and Ytest indicate predicted and observed activity values respectively of the test set compounds and Ῡtraining indicates mean of observed activity values of the training set. For a predictive QSAR model, the value of R2pred should be more than 0.5 [29].
It was shown that the equation 1 can produce an explained variance of 78.1% and an internal predicted variance of 68.5% of the observed data. A simple R2 represent the goodness-of-fit as R2 value can be increased even on addition of insignificant descriptors. Therefore, R2pred, standard error of estimation (SEE) and root mean square error of prediction (RMSEP) are calculated and given as 0.620, 0.429 and 0.713 respectively. F statistics is calculated as 18.486 whereas degree of freedom is given as (6, 31) for the training data considered in the present study. It was observed that QSAR result based on combination of the descriptors from the randomized sets produce lower values of R2, Q2Loo and R2pred.
Further, external predictability of the generated QSAR models was evaluated by calculating modified r2 (r2m) which is given as
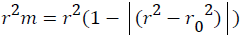 Where, r2 and r⁄m2 are squared correlation coefficient between the observed (Y axis) and predicted (X axis) activity values of the test set with and without intercept, respectively. r2m value must be greater than 0.5 to have a significant model. r2m (test) is calculated as 0.031 which produce significant predictability of this model [30].
Change of the axes gives the value of r⁄02 and r⁄m2 is calculated by the following formula which depends on the value of r⁄02.
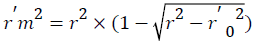 Where, r2 and r⁄m2 are squared correlation coefficient between the observed (X axis) and predicted (Y axis) activity values of the test set with and without intercept, respectively. Therefore, average r2m and delta r2m are now calculated by Average
 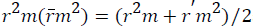 and Delta
 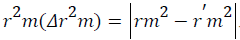 An acceptable QSAR model must produce the value of "Average r2m" >0.5 and "Delta r2m" should be <0.2 respectively [30-32]. So, this model produces average r2m and delta r2m given as 0.747 and 0.031 respectively. These parameter values are well accepted as per the standard values and the model produce significant predictability. The above QSAR model is further applied for predicting biological activities of the test compounds. The observed and predicted activities of the test compounds along with their square residuals are given in the following Table 3. Further correlation between observed and predicted activities was graphically represented in the Figure 1.
| Test molecule number | Observed activities | Predicted activities | (Residual)^2 |
|---|---|---|---|
| 1 | 1.431 | 0.922 | 0.258 |
| 6 | 0.600 | 0.424 | 0.030 |
| 16 | 0.962 | 0.772 | 0.035 |
| 21 | -1.915 | -0.671 | 1.546 |
| 22 | -0.101 | -0.412 | 0.097 |
| 23 | -0.579 | -0.432 | 0.021 |
| 28 | -1.352 | -0.273 | 1.163 |
| 31 | 0.120 | -0.288 | 0.166 |
| 37 | 0.060 | 0.589 | 0.280 |
| 39 | 1.494 | 0.590 | 0.817 |
| 40 | -0.725 | -0.594 | 0.017 |
| 48 | 1.920 | 0.921 | 0.996 |
| 49 | -0.466 | -0.302 | 0.026 |
| 50 | 1.920 | 0.628 | 1.668 |
Table 3: Observed and predicted activities of the test compounds along with their square residual.

Figure 1: Observed activity vs. predicted activity of test molecules.
From this graph, it is evident that predicted activities of all compounds in test set are good corresponding to the observed activities. The square correlation coefficient between observed activities vs. predicted activities is calculated as 0.767 which suggests good model predictivity.
The above model contains two important parameters such as coefficient MATS8i and MATS7e having higher positive coefficient values of 3.417 and 3.599 respectively. These represent 2D autocorrelation descriptor encoding ionization potential and Sanderson electronegativity of the HMD analogs. These parameters indicate the relative tendency of a charge distribution, like the electron cloud of an atom or molecule which may motivate charge or hydrogen bond interaction with the target. Further structure based molecular docking would be helpful for predicting mode of binding of congeneric HMD compounds.
Structure based docking findings
Molecular docking of 52 HMD analogs consisting of five series has been done to study the essential binding interaction of HMD analogs with CDK5/p25. Details of interactions have been given in Table 4. Most common amino acids responsible for producing H-bonding and hydrophobic interactions for these series have been highlighted by bold font.
| Ligand | Mode of interactions of the ligands with amino acid residues inside the binding pocket |
|---|---|
| 1 | ASN 144, CYS 83, LYS 33, VAL 18 |
| 2 | ASN 144, CYS 83, LYS 33, VAL 18, GLU 81, ILE 10 |
| 3 | CYS 83, LYS 33, GLU 81 |
| 4 | ASN 144, CYS 83, LYS 33, VAL 18, ILE 10, ALA 31, PHE 80 |
| 5 | ASN 144, CYS 83, LYS 33, VAL 18, GLU 81, PHE 80 |
| 6 | ASN 144, CYS83, ILE 10, ALA143 |
| 7 | ASN 144, CYS 83, VAL 18, ILE 10, ASP86, GLN 130 |
| 8 | CYS 83, VAL 18, ILE 10 |
| 9 | ASN 144, CYS 83, ILE 10, PHE 82 |
| 10 | ASN 144, CYS 83, ILE 10, ALA 31, PHE 82, ASP 84, GLN 85 |
| 11 | ILE 10, GLN 85, LYS 20 |
| 12 | CYS 83, LYS 33, GLU 81, ASP 86 |
| 13 | ILE 10, GLY 16 |
| 14 | ILE 10, ASP 86 |
| 15 | CYS 83, GLU 81, ILE 10 |
| 16 | CYS 83, ILE 10 |
| 17 | CYS 83, ILE 10, ASP 86 |
| 18 | ASN 144, ILE 10, ALA31, ASP 86, GLN 130, PHE 82 |
| 19 | CYS 83, GLU 81, ASP 86, PHE 82, LEU 133 |
| 20 | ASN 144, CYS 83, LYS 33, VAL 18, GLU 81, ALA 143, PHE 82, LEU 133 |
| 21 | ASN 144, CYS 83, ILE 10, ALA 31, PHE 80, ALA 143, PHE 82, GLN 85, LEU 133, GLU 85, VAL 64 |
| 22 | CYS 83, LYS 33, VAL 18, PHE 80 |
| 23 | ILE 10, ASP 84, LYS 20, LYS89, GLN 8 |
| 24 | ILE 10, PHE 80, PHE 82, LYS 89 |
| 25 | CYS 83, LYS 33, VAL 18, PHE 80, ASP 86, PHE 82 |
| 26 | ASN 144, LYS 33, VAL 18, ILE 10, PHE 80, ALA 143, ASP 84, VAL 64 |
| 27 | ASN 144, CYS 83, LYS 33, GLU 81, ILE 10, ALA 31, PHE 80, ASP 86, LEU 133 |
| 28 | CYS 83, VAL 18, ILE 10, ASP86, LYS 20 |
| 29 | LYS 33, ILE 10, PHE 80, ALA 143, ASP 86, VAL 64 |
| 30 | GLU 81, ALA 31, PHE 82 |
| 31 | ASN 144, CYS 83, LYS 33, ILE 10, PHE 80, ALA 143, PHE 82 |
| 32 | ASN 144, CYS 83, LYS 33, ALA 31, PHE 80, ASP 86, PHE 82, LEU 133 |
| 33 | ASN 144, CYS 83, LYS 33, GLU 81, ALA 143, PHE 82, LEU 133, VAL 64, GLU 51 |
| 34 | VAL 18, ILE 10, ALA 31, GLN 130, PHE 82 |
| 35 | ASN 144, CYS 83, ILE 10, ALA 31, ASP 86, GLN 130, PHE 82, LEU 133 |
| 36 | ASN 144, LYS 33, VAL 18, ILE 10, ALA 31, PHE 82 |
| 37 | ASN 144, ILE 10, ASP 86, LYS 20, LEU 133 |
| 38 | ASN 144, LYS 33, ILE 10, PHE 82 |
| 39 | ASN 144, CYS 83, LYS 33, VAL 18, ILE 10, ALA 31, PHE 82, LEU 133 |
| 40 | VAL 18, ILE 10, PHE 80, ASP 86, LYS 20 |
| 41 | ASN 144, CYS 83, LYS 33, VAL 18, ALA 31, ASP 86, PHE 82, ASP 84 |
| 42 | CYS 83, LYS 33, VAL 18, GLU 81, ASP 86, GLN 85 |
| 43 | ASN 144, VAL 18, ILE 10, ALA 31, ALA 143, PHE 82, VAL 64, GLU 51 |
| 44 | ASN 144, LYS 33, ILE 10, ASP 86, LYS 20 |
| 45 | ILE 10, ASP 86, LYS 20 |
| 46 | ASN 144, CYS 83, GLU 81, PHE 80, ALA 143, ASP 86, GLN 130, PHE 82, LEU 133, VAL 64 |
| 47 | ASN 144, LYS 33, VAL 18, ASP 86, LEU 133, ALA 143, VAL 64 |
| 48 | ASN 144, CYS 83, GLU 81, PHE 80, ALA 143, ASP 86, GLN 130, PHE 82, LEU 133, VAL 64 |
| 49 | ILE 10, ASP 86, GLN 8 |
| 50 | ASN 144, CYS 83, LYS 33, VAL 18, PHE 80, PHE 82 |
| 51 | CYS 83, ASP 86, ASP 84, ALA 31, LYS 20 |
| 52 | CYS 83, ALA 31, ASP 86, ASP 84 |
Table 4: Details study of HMD analogs-receptor interactions.
There are three factors primarily involved in influencing binding conformation between ligand and protein: binding energy, hydrogen bonding, and hydrophobic bonding. ILE 10 is common for mostly compounds. Docking analyses of HMD analogs including serial no 1-8, 9-19, 20-30, and 31-52 have been discussed taking CDK5/p25 cleft. Serial no 1-8 has shown common interactions with ASN 144, CYS 83 and VAL 18 amino acid residues. ASN 144 and CYS 83 influence on hydrogen bonding while VAL 18 produces hydrophobic interactions.
Mostly -NH group of pyrrole of pyrrolo [2,3c] azepine skeleton interacts with C=O group of ASN 144. Carbonyl group of azepine of HMD analogs interacts with NH and CH group of ASN144. N atom and NH group of imidazole of HMD analog interacts with CO group of ASN 144. Br atom produces hydrophobic bonding with VAL 18 and H-bonding with CYS 83. NH and CO group of imidazole of HMD analogs shows interactions with CO, NH and SH group of CYS 83. Carbonyl and hydroxyl group present in azepine of HMD analogs interacts with NH group of CYS 83.
Most common amino acids interactions with ligand serial no 9-19 are CYS 83 and ILE 10. CYS 83 produces hydrogen bonding while ILE 10 influences both hydrogen bonding and hydrophobic interactions. NH group of indole present in HMD analogs interacts with CO group of CYS 83. CO and NH group of azepine of HMD analogs interacts with CYS 83. Amino group of imidazole of interacts with CO group of ILE 10. Amino group attached at second position of imidazole of HMD analogs interacts with CO group of ILE 10. The most common amino acids interactions with ligand serial no 20-30 are ILE 10 and PHE 80. N and NH group of hydrazone and NH group of Indole interacts with CO group of ILE 10.
Pyrrole ring, benzene ring and Br atom present at third position of pyrrole, of HMD analogs produce hydrophobic bonding with ILE 10 and PHE 80 while N atom of pyrrole produces electrostatic bonding with PHE 80. HMD analogs from serial no 31-35 have shown most common amino acid interactions with ASN 144, CYS 83 and PHE 82. CYS 83 and PHE 82 influence H-bonding, hydrophobic bonding, halogen bonding and ASN 144 produces H-bonding. CO group of azepine ring and pyridine ring of HMD analogs produces interaction with NH group of ASN 144 while NH group of both azepine and hydrazine interacts with CO group of ASN 144.
CO group of azepine interacts with CH group of PHE 80. NH group of indole and N atom of hydrazine interacts with CO group of CYS 83. Benzene ring of indole produces hydrophobic interaction with CYS 83 and PHE 82. HMD analogs from serial no 36-52 have shown common amino acid interactions with ASN 144, ILE 10 and ASP 86. NH group of azepine of HMD analogs interacts with CO group of ASN 144 while Fluorine atom of trifluoromethyl attached at second position of pyridine, N atom of pyridine, pyridine nucleus of HMD analogs interacts with NH group of ASN 144 and produces hydrogen bonding.
NH group of Hydrazine interacts with CO group of ILE 10 and produce for hydrogen bonding. Benzene ring of indole, Cl atom present at forth position of indole and pyridine produces hydrophobic bonding with ILE 10. Cl atom present at second position of pyridine interacts with NH group of ASP 86 whereas CH group present at fifth and sixth position of pyridine of HMD analogs interacts with CO group of ASP 86. N atom of pyridine ring, hydrazine and azepine ring also produces electrostatic interactions. Cl atom at second position of pyridine, Cl atom at forth postion of indole and F atom at forth position of indole produces halogen bonding.
QSAR of marine sponge derived HMD analogs elucidate the crucial features of radial distribution function, ionization potential and Sanderson electronegativities which are correlated with the polarity character of the compounds. Evaluation of docking results of HMD analogs has been compared with the docking findings of compound 48 carried out by Wan et al. [4]. Docking results of highest active compounds 48 showed same hydrogen bonding interaction with the amino acid residues such as CYS 83 and GLU 81 already reported by Wan et al [4]. As per the in-silico docking experiments done by us it was observed that amino acid residues ASN 144 produced nonclassical H-bonding with pyridine ring. Other amino acid residues including Phe 80, Leu 133, ALA143 and Val 64 can interact with different substituents of the ligand 48, cleft at hydrophobic pocket of the target. 7-fluoro can interact with GLN130 and Asp 86 by halogen bonding. Therefore, it is concluded that these residues are also important for inhibition of CDK5/p25. Pattern of interactions is given in Figure 2. It was also observed that amino acid residues such as CYS 83, ILE 10 and ASN 144 are commonly interacted by the moderate active such as 3-4, 9-11, 16-17, 32, 36, 45-46 and 52 as well as lower active compounds such as 6, 7, 8, 12-15, 18-20, 21-37, etc.

Figure 2: Best docked conformer pose of compound 48 cleft at target (PDB ID: 1UNG).
This work has been performed by using softwares which are freely accessible from the internet resources. Therefore, studies in this direction are very economical and could be highly focused in predicting essential HMD structural features for the design of potent hybrids utilizing free internet resources.
The authors are thankful to Professor Kunal Roy, Drug Theoretics and Chemoinformatics Lab, Department of Pharmaceutical Technology, Jadavpur University, Kolkata, India for providing ‘NanoBridges’ software.
No potential conflict of interest was reported by the authors.