International Journal of Advancements in Technology
Open Access
ISSN: 0976-4860
ISSN: 0976-4860
Short Communication - (2022)Volume 13, Issue 2
Measurement of sizes of geometrical structure can have small units based on the metric system. Profilometry was an important aspect of research study (National Measurement Institute 2022). Inaccurate data collection can impact the results. These processes can change from vernier-caliper and micrometer to microscopy. The former was regarded as quantitative methods and the other qualitative for data collection. The research showed the external factors contributing to inaccuracy can be reduced using qualitative methods.
Profilometry; Quantitative; Qualitative
The quantitative data collection methods such as vernier caliper and micrometer rely on random sampling of precise positions and then averaging the measurements [1-4]. These can be summarized, compared together. Quantitative methods were concerned with testing hypothesis derived from theory to estimate the size of samples [5]. This was not feasible for research to collect data on participant and situational characteristics [6].
Profilometry was a quantitative technique with computer assistance. This method involved processing data and storing for carrying out many interpolated measurements [7]. These can be used to improve the quality and produce a hypothesis of design evaluation the [8,9].
Open ended
Qualitative have less structured protocols to change the data, collect and refine measurements [10].
Highly interactive
These were highly interactive and required responses for many times to check the reliability of the results.
Interpolation
This used interpolation to increase the reliability of the results on multiple data and to check the authenticity of the results used [11].
Regardless of the kinds of data involved it can take considerably lengthier time. The researcher recorded the data accurately, systematically. A microscope was used as the technique for recorded the data accurately, systematically. A microscope was used as the technique for preserving the complexity of the fine structures. The specimen was prepared using nitinol to expose the surface for performances of the microscope.
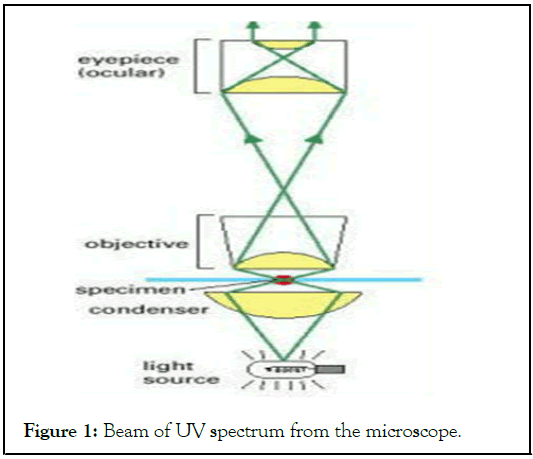
The microscope had low emittances because radiation could not be used to measure structural detail much smaller than its own wavelength. The resolution of the microscope was set by wavelength of UV Spectrum. This was between 0.4 to 0.7 μm (Figure 1).

Figure 1: Beam of UV spectrum from the microscope.
The microscope was a compound microscope. The beam was focused on the specimen by lenses in the condenser. When the beam comes into contact with the specimen it caused diffraction effects. The interaction with the sample changes the phase relationships of the waves (Figure 2).
Figure 2: Interaction of beam phase with the sample.
Resolution
The resolution depended on both the wavelength of the microscope and numerical aperture of the lenses system. Under the optimal conditions UV (wavelength=0.4 μm) and numerical aperture 1.4 has a resolution of lower than 0.2 μm in theory (Figure 3).
Figure 3: Resolution of the microscope as a profilometric technique.
The resolution depends according to equation 1 the width of the cone, condenser and objective lens [1].
Resolution=0.6λ/nsinθ
ϴ – Half the angular width of the beam (maximum width w as 180 ̊)
n – Refractive index of medium separating the specimen from the objective and condenser lenses
λ – Wavelength of the beam
Image processing
The images produced were in binary form these can be readily digitized and transferred to a computer and processed in various ways to extract latent information. Image processing compensates for various factors affecting the microscope and resolution. The processing enhances irregularities in the system. Certain areas were removed by subtracting and image of empty region of the field.
Computer assistance
This makes it possible to display even smaller samples such as microtubules. These have diameters of 0.025 μm less than a tenth of wavelength of UV spectrum. The image sections were taken at different depths stored on a computer. The confocal microscope achieved similar deconvolution by manipulating the measured image. The micrographs were intact from the profilometry measurements. The conventional unprocessed image was not clear. The microscope resolved the structural of numerous complex three dimensional samples. The image processing reconstructed the confocal microscope images (Figure 4).
Figure 4: Microscope image used for sample before processing.
The detectors were used to record the images from the microscopes to produce two dimensional micrographs. The large depth of field of the microscope all the parts of the three dimensional specimen were in focus. The resulting image was a projection of structure along the viewing direction.
The computer assistance redeveloped in a chosen orientation by combining a set of views of many molecules of the field of view. These were used to make a three dimensions and taking an average. The data in the far field was removed to give a clear view of the molecular structure.
Profilometry was used for observing the structure of samples. These were studied in a conventional microscope. The samples could be seed with phase-contrast, differential-interferencecontrast, near and far field of views. The confocal microscope provided sections used to construct three dimensional images. The higher resolution was attained by confocal microscope. Computational methods, multiple images and views in different directions were combined to produce detailed redevelopments of macroatoms and atomic complexes through the profilometry technique.
Citation: Ubani IS (2022) Profilometry Modelling as a Measurement Method of Geometries. Int J Adv Technol 13:173.
Received: 04-Mar-2022, Manuscript No. IJOAT-22-16135; Editor assigned: 08-Mar-2022, Pre QC No. IJOAT-22-16135; Reviewed: 22-Apr-2022, QC No. IJOAT-22-16135; Revised: 28-Mar-2022, Manuscript No. IJOAT-22-16135; Accepted: 28-Mar-2022 Published: 04-Apr-2022 , DOI: 10.35248/0976-4860.22.13.173
Copyright: © 2022 Ubani IS. This is an open-access article distributed under the terms of the Creative Commons Attribution License, which permits unrestricted use, distribution, and reproduction in any medium, provided the original author and source are credited.