Journal of Biomedical Engineering and Medical Devices
Open Access
ISSN: 2475-7586
ISSN: 2475-7586
Short Communication - (2017) Volume 2, Issue 2
Keywords: Cardiovascular system; Forecasting; Heartbeat intervals; Records; Assessment
In recent years, the problem of the study of rare (extreme) event attracted a lot of attention [1-3]. Generally, rare events with values much higher than the average value are considered to be independent, as the typical time between them is very large. However, in recent years it has become increasingly clear that this assumption is not always satisfied. To quantify rare events is usually the interval time between the appearance of successive events above (or below) a certain threshold Q. This is investigated as a function of the probability distribution of these repeated intervals (return intervals), as well as their long-term dependence (autocorrelation, conditional periods and reps etc.). In the numerical analysis, definitely not considered very high thresholds the Q, which provide a good statistical estimates of repeat intervals, and then try to extrapolate these results to the very high thresholds for which statistics are very poor.
For independent sets of data repeated intervals are independent and (according to Poisson statistics) is exponentially distributed. Clustering of rare events indicates the existence of a certain memory in repeated intervals, and, as shown by recent studies [4-6], this type of memory is a sequence of long-term dependency of time series Long-term memory may be: (i) a linear (ii) or nonlinear (iii) for linear and nonlinear characteristics of some other process characteristics. In the first case, which is often called “monofraktal” (linear) the autocorrelation function of the Cx(s) of input data decreases with time s power law  and exponent gamma fully It describes the correlation between the records (extreme values). In this case, as repeated intervals, and records have long-term correlations and their distribution on a large scale is characterized by a stretched exponential exponential gamma c, but on a small scale are subject to a power law with an exponent γ-1 [4,6,7]. Such phenomena are observed in long-term climate records [4] and volatility (variability) of the financial records of [5], despite the fact that the volatile memory comprises non-linear and, therefore, relates to the case (iii).
In the second case, when the records form a “multifractal” linear autocorrelation function Cx(s) vanishes for s>0, and the records are characterized by non-linear multifractal correlations that cannot be described by a single exponential. With the generation of a multiplicative random cascade (multiplicative random cascade-MRC) in [8] that the non-linear correlations inherent in such a time series provide statisticians repeated intervals peculiar effect, which manifests itself in submission to a power law probability density functions (probability density functions-PDFs), the autocorrelation function (autocorrelation functions - ACFs), and repeated periods of conditional (conditional return periods-CRPs), which contradicts the properties of independence and monofractal in the presence of long-term correlations in the original data. [2] Exhibitors corresponding power laws essentially depend on the selected threshold level, i.e., repeated intervals will have different behavior at high and low thresholds. Consequently, direct extrapolation of the laws governing repeated intervals with low thresholds would not be lawful for a quantitative description of repeated intervals with large rapids.
In [9], based on 24-hour Holter monitoring data shows that the linear and non-linear long-term memory, inherent in repeated intervals heart, leading to a power law changes PDF. As a result, the power law will satisfy the probability WQ(t;Δt) that Δt. of time units that have elapsed since the last re-interval with an extreme event (record) larger than the threshold Q (Q-short interval), there will be at least a Q-interval if for t time units until the last Q-Q-interval appeared heartbeat interval.
In this paper, prediction of large (with a record of more than a certain high threshold Q) re Q heartbeat interval is carried out using the procedure of forecasting [9] with repeated intervals statistics estimates [10] and with the preliminary selection of repeat Q-intervals with persistent (steadily increasing) records on the basis of conversion [11] of the original signals (in this case repeated Q-intervals) in a time to reach a predetermined change threshold.
1. Prognosis large repeated intervals heart with a great record. Preexisting repeated intervals forecasting strategy is based, as a rule, short-term pre-history, and were based on the construction of the training sample (precursors)  consisting of the events preceding the extreme events yn>Q. These strategies are based mainly on two approaches. In the first approach considers the big events with the appropriate precursors and their frequencies, which are determined based on the posterior probability P(yn,k=yn>Q) In the second approach considers all the precursors of
  which is preceded by some record yn, and calculates the probability
  while yn,k considered a precursor of extreme events yn>Q [12,13]. The second approach is more comprehensive because it takes into account information precursors of all the events, thus providing additional information about the studied ranks contained in the shortand long-term correlations of the original data [14,15].
A more direct way of dealing with the study of the problem is proposed in [12] a method in which the precursor is sought prior to the consideration of extreme events and with the highest probability of a generation of alarm (alarm) of the appearance of such a precursor. For physiological extreme events (records) that appear in the nonlinear complex systems (which, in particular, relates cardiovascular system), the said precursor may not be representative due to the fact that many other precursors may be of comparable probability to determine a second interval following During the extreme event yn . In this case it is advisable to generate an alarm signal in accordance with a preliminary estimate of the probability P with which there are extreme events exceeding the threshold QP. Selecting QP usually carried out optimally, minimizing the total loss associated with the forecast errors, including false alarms and disturbing events (artifacts), with a preliminary specification of losses from a false alarm and a disturbing event (which can vary greatly in different tasks [12]).
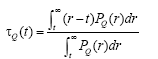
In this regard, [9] developed a third approach to the problem of predicting large repeated intervals, requiring less information and therefore more convenient than the conventional approach. This approach, which uses non-volatile memory and named [9] RIAapproach (return intervals appkoach), based on the use of statistics repeated intervals and very useful, in particular, in the study of records having nonlinear(Multifractal) long-term memory. PDFbased assessments repeated intervals size r, consisting of events with a value greater than Q (briefly, this PDF is designated PQ(r); Properties of PQ(r); are considered in [11] estimates) obtained two values, it is essential to predict the record (extreme events) with a value greater than Q (Q-short event) that appears after the last Q-events. The first of these variables, the expected number of τQ(t) time units, after which you receive the following Q-event will take place as soon as the t time units after the last Q-events. By definition, Q(0). τ is equivalent to the period of repetitive intervals RQ Q-events (Q-short interval). In general, τQ(t) associated with PQ(r) ratio:
 (1)
(1)
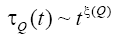
and τQ(t) for multifaraktalnyh data satisfies the scaling relation
 (2)
(2)
PDF to repeat r>r0 size intervals denoted briefly by PQ(r|r0). Generalization values τQ(t) on Q events included in repeated intervals size r>r0 (summarized these events will be denoted by Q(r0) Events), leads to the concept of magnitude τQ(t|r0) in which the definition of Q-event replaced to Q(r0)-event. Figure 1a and 1c of [9] shows the value of the global τQ(t) and conditional τQ(t|r0) the magnitude of the expected temporary units until the next event, their numerical values obtained for the MRC-models: (a) RQ=10 and (c) for RQ =70. The values of r0 only considered when r0=1, r0=3. From Figure 1, it follows that τQ(t) satisfies a power:

Figure 1: The values of global τQ(t) and the value of the conditional τQ(t|r0) the expected time units until the next event.
 (3)
(3)
where the exponent ξ(Q) decreases with increasing Q(ξ=0.6 for RQ=10 and ((ξ=0.47 for RQ=70) Conditional expected number of time units τQ(t|r0) for r0=1 may also be described by a power law. about the same exponential ξ(Q,r0), as well as the global value of ξ(Q). On the contrary, the value for r0>3 τQ(t|r0) significantly deviates from the power law for small values of the argument t/RQ. For large values. t/ RQ, corresponding τQ(t|r0) graphics for both values r0=1 and r0=3 close to collapse (merge) Wa(t,Δt) is the probability that the time Δt for the units following the last Q-event will be at least one heartbeat interval Q-, if for t units of time before the last Q-event event appeared interval. This value is related to PQ(r) ratio:
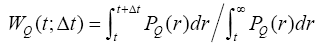 (4)
(4)
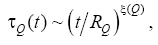
Since the value of WQ(t;Δt) is limited by the number 1 when t/RQ→0, it can satisfy the power law only if  and written as [9]:
 (5)
(5)
Figure 1c and 1d shows graphs for WQ records MRC-model, characterized the power spectrum of the form 1/f 1 when RQ=10 and RQ=70, respectively. For such records PDF is better described by a gamma distribution than the power law, significantly deviate from it on a large scale, to obtain an analytical expression for the WQ in this case is very difficult. Empirically [9] shows that the best estimate for WQ obtained in this case, if the denominator of the fraction (5) is replaced by at
at which leads to the estimate:
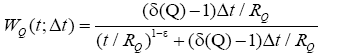 (6)
(6)
For large t/RQ there are strong finite-dimensional effects that manifest themselves especially at high RQ (Figure 1d). These finitedimensional effects are reduced with a decrease in RQ and with increasing length l of the time series, understating the denominator in (5), and thereby artificially inflating assessment WQ.
The simplest forecast is obtained by choosing the estimate (6) with a high probability of a fixed value Δt=1. These results agree well with the corresponding results for the model MRC. To build a more accurate prediction [9] propose an algorithm, providing a comparison WQ assessments at various fixed values of QP and calculating the relevant risk probabilities. For a fixed value of QP determined by two indicators: sensitivity (sensitivity) Sens, who correctly predicted the share harakteriruet Q-Events and specified index (specifity) Spec, which characterizes the proportion correctly predicted not Q-events. Larger values and Sens Spec provide a better prognosis. To increase the efficiency of use of the forecast analysis using the reception signal operator (receiver operator characteristic), called the ROC-analysis, according to which plotted by Sens Spec for all possible values of QP. By opredelnie Q|P=0, when Sens=1 Spec=1 and 0, while QP=1 when Sens=0 and Spec=1. At 0

Figure 2: Graph Spec Sens depending on all possible values of Qp.
Figure 2 [9] has shown that when RQ=10, both approaches provide similar results in three representative cases, patterns of k=2, k=3 and k=6, and for RQ=70 ROC-curve is systematically located above the RIAcurve, especially near Sens=1. Experimental studies suggest [9] that the PRT-forecasts using the “training” of the observed sample records are usually more accurate than forecasts obtained through records MRCmodel. The reason for this is the limited ability to MRC-model for describing the dynamics of short-term heart rate intervals, including individual variations in the physiological regulation. In this regard, the high sensitivity of RIA-techniques results in significantly fewer false alarms than PRT-technique.
Thus, the use in the study of records in non-volatile memory heartbeat intervals inherent in events that appear after the last Q-events, has the undoubted advantage compared with PRT-technique, using only short-term memory. RIA- approaches main disadvantage is that it typically cannot predict the events of the first Q-cluster event, a large number of heartbeat intervals t used when W (t; Δt) becomes low. However, due to multifractality records in clusters of extreme events, benefit from better than expected, following the first event in the cluster Q-events, and from the reduction of false alarms in the RIA-approach is much higher than the loss of the weak predictability of the first event in the cluster Q-events that confirmed ROC-analysis. In addition, RIA-intensive approach does not require the use of multiple training procedures and test patterns facilitating its numerical implementation compared to PRT-approach.
To improve the efficiency Q-event prediction obtained RIAmethod, we will use a combination of this method with the method of achieving change threshold [10]. The basis of this method is necessary the original signal into a number of time to reach the threshold of change p [16]. It allows, firstly, the aggregate signal without loss of significant information about it, and secondly, not predict the next signal value, and the time in which the signal change exceeds the known threshold p. Prediction made two-layer perceptron. Consequently, the original signal is converted as follows:
 (7)
(7)
 (8)
(8)
 (9)
(9)
 (10)
(10)
where N-number of samples in the original signal, x’-converted signal, in which left only the values relative difference between the intervals is greater than the threshold p, N-number of samples in the transformed signal, τ-number time to reach a predetermined change threshold, where each value means the time it took the signal to exceed the threshold p changes. Furthermore, this method enables a combined prediction, which includes:
1) assessment for the x ' next value 


The agreement marks the differences  and
and  svidetelst- It exists on the persistence (sustainable growth) as the values
 and the time
 between the values of
 and
and When applied to the records (extreme events) heart which means a steady growth of Records and the intervals between consecutive records
The transformation (7) - (10) with the replacement of (9) to
 (9)
(9)
You can apply for the pre-selection of records in the heart of the above Q-range forecasting process at large Q-based RIA-technology that will speed up the last procedure and increase the reliability of the proqnosis.