Journal of Medical Diagnostic Methods
Open Access
ISSN: 2168-9784
ISSN: 2168-9784
Research Article - (2017) Volume 6, Issue 2
Background: Malaria is a major public health concern and leading cause of morbidity and mortality in Uganda. Failure to get accurate predictions of the malaria incidence in the population does not only make difficult it to effectively reduce the burden of the disease but also increases the risk of the development of resistant malaria strains which may result from use of insufficient dosages for treatment. Objective: This study aimed to develop a model that predicts new cases of malaria in a month using routine data and to use the model as a monitoring tool in the fight against malaria. Methods: This was retrospective longitudinal study design that involved a secondary analysis of data from two sources. Malaria count data was obtained from department of health information Ministry of Health while population projection data was obtained from Uganda Bureau of statistics (UBOS).The model was formulated using the theory of malaria transmission between the human and mosquito host. The model was then developed using the law of mass action in the Susceptible- Infectious-Susceptible (SIS) modelling framework. Results: The proposed model was considered good for one-month to 12 month ahead prediction accuracy in the range of 45 cases per 10000 people. The findings revealed that among the Ugandan population one infectious individual is likely to infect on average about three susceptible individuals in a month. Our finding of one infectious individual being likely to infect on average about three susceptible individuals indicates that even in the population where the Insecticide Treated Nets (ITNs) are being distributed there are many asymptomatic individuals. Conclusions: The proposed model is simple and can be used to produce reasonable predictions of malaria incidences in Uganda. The model can also detect the presence of asymptomatic infectious individuals in the general population. To further strengthen the use ITNs as a strategy for malaria prevention in the general population, it is important that authorities incorporate a malaria testing strategy to recipients to reduce on the number of asymptomatic individuals in the population. This effectively reduces the incidence originating from asymptomatic individuals infecting other members of the population.
Keywords: Malaria; Susceptible; Infectious; Prediction
Malaria is a major public health concern and leading cause of morbidity and mortality in Uganda. The entire population of Uganda is at risk of malaria but children under five years of age: Pregnant women and people living with HIV/AIDS have a much higher risk for the disease and thus associated burden [1-6]. Malaria accounts for 26% of the burden of disease in Uganda (BOD Uganda, 1995), 30-50% of outpatient consultations, 20% inpatient admissions and 9 to14% inpatient deaths per year (MoH [7]).
Effective control of malaria relies largely on two broad strategies namely: Prevention and effective case management. Effective malaria case management, which includes prompt diagnosis and timely treatment with appropriate, affordable, effective, and safe anti-malarial, remains a cornerstone for malaria control and management in Uganda. Commonly used preventive measures include use of Insecticide Treated Mosquito nets (ITNs), Indoor spraying and Fansidar preventive treatment for the pregnant women. In all these interventions there is need to quantify appropriate the amounts of medicines and supplies that meet the demand for the control and treatment of malaria across the treatment and preventive paradigms. Health systems research has persistently shown that frequent stockouts of anti-malarial medicines and supplies at health facility and community level as well as non-availability of Rapid Diagnostic Tests (RDTs) have remained a chronic challenge in Uganda for so long. The malaria commodity stock outs are mainly attributed to lack of appropriate methods for projecting the incidence of malaria in the country and this compromises the ability of those involved in projecting stock needed malaria case management for specific periods Recent research has largely focused on anti-malarial drug resistance and prediction of epidemics but a dearth of evidence exists on models that can predict the incidence of the malaria based on routine statistics generated from health facilities where care is routinely provided. This study aimed to develop a statistical model that can predict the monthly malaria incidence in Uganda [8-10].
Malaria is endemic in the whole of Uganda with an average malaria parasite prevalence rate of 45%. Reported malaria cases from outpatient departments have increased from 28% in 2001 to 45% in 2010 and parasitological testing for malaria has minimally increased from 5% in 2001 to 24% in 2010 (MoH [7]). Based on the current malaria epidemiological profile, a rapid scale up of insecticidal coverage to achieve a significant level of community protection, either through LLINs and/or IRS, parasitological diagnosis and prompt treatment with effective ACTs is required to achieve a Malaria-Free Uganda. This implies that Uganda should focus on efficient use of its available resources to significantly reduce the burden of malaria which still remains unacceptably high. Availability of accurate malaria incidence forecast is one of the key strategies that can greatly improve on logistical challenges involved in providing right quantities of medicines and other supplies for effective case management of malaria to all those in need. Accurate forecast can be done based on context sensitive and reliable estimation methods which must use accurate routine data on malaria incidence. Consumption is one of the primary approaches currently used to determine stock quantities that are needed for the various catchment populations across health facilities in Uganda. Due to limitations in accurate estimation of malaria incidence, the quantification of malaria diagnostic supplies is based on the number of suspected malaria cases. Currently there is no systematic approach of collecting accurate facility consumption data for RDTs and microscopy reagents. Resultantly, the supply of medicines required for the management of malaria is based on malaria associated morbidity estimates, which makes forecasting and prevention of stock outs difficult (MoH [7]). Frequent stock-outs and sometimes mismatch of reagents combination for malaria microscopy delivered at the health facilities, poor logistics management practices for supplies and poor storage facilities have greatly contributed to the low performance in malaria microscopy targets. Failure to get accurate forecasts of the malaria incidence in the population does not only make difficult to reduce the burden of the disease but also increases the risk of development of resistant malaria strains which may result from use of insufficient dosages for treatment. This study therefore aimed to develop a malaria incidence model based on the routine data to forecast the number of cases expected which will be used to quantify the amount of malaria medicines and supplies in the country.
Data source
The materials used in this study were obtained from two secondary data sources. Malaria data were obtained from Ministry of Health Uganda (MoH) while the population projection data were from Uganda Bureau of statistics (UBOS).
Malaria data
In Uganda Health Facilities routinely observe and record information for all the services they provide to the relative catchment population. The data at the facility level is collected by a standard Health Management Information System (HMIS) form (Form No.105) which is available for all facilities in the country. The HMIS form 105 is structured in sections that depend on the nature of the services provided in the health facility. Section one of the form collects data on outpatients (OPD) attendance, outward referrals to higher levels of service delivery, and outpatient diagnoses. Under the outpatient diagnoses Section monthly observed cases of infectious/communicable diseases, non-communicable diseases as well as other neglected diseases are recorded. Section two of the form collects data on maternal and child health (MCH), while Section three records data on HIV/AIDS counselling and testing [11-15].
Sections four and five capture data on outreach activities in the communities and essential drugs, vaccines and contraceptive stock outs and consumptions respectively. Lastly Section six of the form captures data on key laboratory tests for various diseases, and section seven collects data on primary health care funds. This study utilized data on outpatients recorded in
Section one with special attention to malaria. The population susceptible to malaria in the different districts were obtained from the Uganda Bureau of Statistics (UBOS). The population at risk of malaria was estimated from the population projections that were estimated by Uganda Bureau of Statistics for the period 2002-2017.
Data analysis
Data was analysed using STATA version 12.0 statistical software package. Data were analysed in stages starting with descriptive analysis. Total counts and confidence intervals stratified by time (monthly) were computed. In addition to these computations graphical methods were used to illustrate variations in the number of cases and population at risk of being infected with malaria. To further understand the evolution of malaria among the Ugandan population point incidence rates were computed and Analysis of variance (ANOVA) was used to assess the differences in monthly malaria incidences over months. The incidence rate is defined as the number of new malaria cases observed in the population at risk at the start of the month per unit person per month. Therefore further analysis using the proposed model in predicting monthly malaria incidence was performed.
Model development
The process of estimating the population of female Anopheles mosquitoes responsible for the transmission of malaria in humans is quite complex. In the human- mosquito malaria process the assumption is made that; the effect of infected mosquitoes transmitting malaria in humans is captured by considering the indirect interaction between susceptible and infected subpopulations in a given month. In this regard, the total population Nt is a mixture of the susceptible St and the infected It subpopulations. Since the population is divided into the susceptible and the infected malaria transmission can be modelled through the infectious disease framework of the SIS-model with modification. This implies that malaria transmission involves a consecutive process describing the indirect interactions between susceptible and infected subpopulations. Considering just two months the process is summarized by the equation 1.
S1 + I1 → S2 + I2 (1)
S1, is the proportion of the population susceptible to malaria infection in the previous month, I1, is the proportion of the population infected with malaria in previous month, S2, is the proportion of the population susceptible to malaria infection in next month while, I2 is the proportion of new malaria cases observed in the next month which is our prediction. The rate of association between the two subpopulations that are infected with malaria and that susceptible to malaria is represented in terms of the proportion of each subpopulation according to the law of mass action. Mathematically the rate law is expressed in both the population of susceptible as well as the infected one, as differential equation 2.
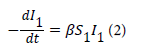
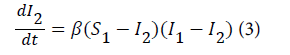
where β is referred to as the transmission parameter which determines how susceptible individuals get infected with malaria as result of indirect contact with the infected population. The above model is expressed using the predicted proportion of the population infected with malaria. Let (S 1-I 2) be the proportion of the susceptible population that is infected with malaria in the previous month and (I 1- I 2) is the proportion of infected population who were infectious in the previous month. Therefore the rate of malaria infection in the next month is given by equation 3.
Like any other process it is important to define the transmission process in a more general way. Therefore, the malaria transmission process represented above is defined generally by equation 4.
St + I t → S t+1 + I t+1 (4)
where t=1,2, . . . , I t+1, is the proportion of the population with malaria infection in the next month resulting from It proportion of the population that were infected with malaria from the previous month. The differential equation describing the transmission process in the population is given by equation 5.
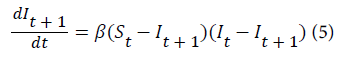
where (St –I t+1)is the proportion of susceptible individuals who get infected with malaria in the next month while (It –I t+1)is the proportion of infected individuals who are infectious in the previous month. Upon integration the proposed model that predicts the number of new malaria cases in the next month is given by equation 6.
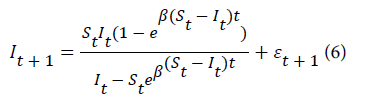
where εt+1 is the random error assumed to be normally distributed with mean zero and constant variance.
St It =1
The only parameter of the model was estimated by nonlinear least squares.
Model diagnostics
Model development is not complete if the developed model is not checked for its inadequacy and assumptions about the distribution of the residuals. In light of this residual analyses were performed to detect inadequacies in the proposed model. A plot of the residuals against the fitted values of monthly malaria incidence was used to assess for normality in the model residuals. Inadequacies in the proposed model were assessed by a plot of the residuals against the fitted values. The presence of serial correlation in the residual was assessed using the run test. The test involved counting the number of runs or sequence of positive and negative residuals and comparing this result to expected number of runs under the null hypothesis of independence.
Out-of-sample forecasts
The main objective of this study was to develop a model that can predict monthly malaria incidence among the Ugandan population. Therefore assessing the model for goodness of fit on the data is not sufficient to answer the primary study objective. A model that might have a good fit in the sample does not necessary imply it provides the best forecasts. Therefore our model was assessed using the four measures of out of sample forecasts. The data for the 6 years were divided into two sub-periods. The first sub-period of the five years (60 months) were used in the fitting of the model commonly referred to as estimation sub-sample. The second sub-period of one year (12 months) were used to evaluate the 12 month forecasting performance and therefore referred to as forecasting sub-sample. To evaluate the forecasting power of the model different errors dimensions were computed for one-month ahead to 12 month ahead forecasts. The first error that was computed is the bias which measures the arithmetic mean of the forecasting errors.
Sensitivity of analysis of the transmission rate
In the proposed model, time, proportion of infected individuals It and proportion of susceptible individuals St are input variables in the system while the transmission rate β is the model system parameter. In this section we assess the effect of varying the transmission rate on the monthly malaria incidence using partial derivatives. The transmission rate estimated in the proposed model is normally distributed with mean 2.73 and variance 1.83.
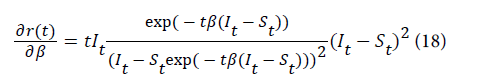
Since the transmission rate is not observed random samples were generated from the normal distribution to assess the effect of transmission rate on malaria incidence. Six random samples of size 72 observations were generated by varying the transmission mean by its standard deviation that is at , 2and 3. The sampling was repeated 1000 times till the mean and variance of the distribution converged to the desired mean and variance. The samples were then used to compute the change in the monthly malaria while setting the proportion of infected and susceptible individuals to their average. The partial derivative of malaria incidence with respect to the transmission rate is given by equation 18. For other equations please see the Appendix.
Monthly malaria cases
The monthly average malaria cases were estimated to be approximately 1million people with the minimum of 0.64million and maximum of 1.4million people. Furthermore, the average relative variability in monthly malaria cases was about 14.2%. The results reveal slight temporal variability in the observed malaria infections among the Ugandan population. The findings also indicate that malaria transmission among the Ugandan population take place at any month of the year. For example in the period 2006-2011, on average 0.98 million cases were observed at various health facilities across the country. The relative variation in observed malaria cases in the month of January was estimated to be about 14.6% Table 1. The relative variations across the other months are relatively small which implies that malaria transmission is stable in the population.
| Parameters | Monthly malaria cases(10) | |||||||
|---|---|---|---|---|---|---|---|---|
| Months | 2006 | 2007 | 2008 | 2009 | 2010 | 2011 | Average | CV (%) |
| January | 0.76 | 1.11 | 0.97 | 0.92 | 1.17 | 0.99 | 0.98 | 14.6 |
| February | 0.71 | 1.02 | 0.92 | 0.81 | 0.99 | 0.9 | 0.89 | 12.95 |
| March | 0.64 | 1.01 | 0.91 | 0.96 | 1.04 | 0.94 | 0.91 | 15.89 |
| April | 0.68 | 0.98 | 1.03 | 0.88 | 1.14 | 0.95 | 0.94 | 16.39 |
| May | 0.81 | 1.02 | 1.08 | 0.93 | 1.19 | 1.11 | 1.02 | 13.13 |
| June | 0.83 | 1.08 | 1.14 | 1.19 | 1.38 | 1.3 | 1.15 | 16.65 |
| July | 0.99 | 1.04 | 1.12 | 1.23 | 1.09 | 1.03 | 1.08 | 7.69 |
| August | 0.92 | 1.07 | 0.97 | 1 | 1 | 0.88 | 0.97 | 6.72 |
| September | 0.8 | 0.84 | 0.95 | 1.09 | 1.12 | 0.98 | 0.96 | 13.6 |
| October | 0.87 | 1.03 | 1.05 | 1.19 | 1.07 | 1.01 | 1.04 | 9.82 |
| November | 0.83 | 1.02 | 1 | 1.14 | 1.11 | 0.78 | 0.98 | 14.95 |
| December | 0.81 | 0.84 | 0.94 | 1.1 | 1.06 | 0.85 | 0.93 | 13.03 |
| Average | 0.8 | 1 | 1 | 1.04 | 1.11 | 0.98 | 0. 99 | 0 |
| CV (%) | 12.37 | 8.52 | 7.76 | 13.17 | 9.32 | 13.77 | 14.22 | 0 |
Table 1: Monthly malaria incidence 2006-2011.
The average monthly malaria incidence is about 473 (69) cases per 10,000 people. The minimum monthly malaria incidence among the Ugandan population is about 313 cases while the maximum incidence is 631 cases per 10,000 people. The monthly malaria incidence seems to be relatively varying across the months of the year with the risk being slightly higher in the months of June and July Table 2. February seem to have the lowest number of malaria incidences although this does not achieve statistical significance (Figure 1). The relative variability in monthly malaria prevalence for the period 2006-2011 was about 14.6%. Furthermore, across the years and months the average monthly malaria incidence in the Ugandan population is relatively stable (Table 2).

Figure 1: Gives the graphical representation of monthly variation in malaria incidence rates. Monthly malaria incidence over time.
| Months | 2006 | 2007 | 2008 | 2009 | 2010 | 2011 | Average | CV (%) |
| January | 0 | 596 | 472 | 448 | 564 | 420 | 500 | 15.2 |
| February | 381 | 538 | 434 | 378 | 451 | 371 | 426 | 15.1 |
| March | 336 | 516 | 436 | 449 | 468 | 371 | 429 | 15.3 |
| April | 370 | 490 | 496 | 423 | 527 | 393 | 450 | 14.1 |
| May | 445 | 523 | 541 | 455 | 549 | 455 | 495 | 9.7 |
| June | 458 | 565 | 560 | 564 | 631 | 545 | 554 | 10 |
| July | 537 | 524 | 567 | 579 | 487 | 436 | 522 | 10.2 |
| August | 488 | 564 | 474 | 481 | 460 | 353 | 470 | 14.5 |
| September | 425 | 441 | 462 | 510 | 500 | 396 | 456 | 9.7 |
| October | 451 | 519 | 501 | 564 | 468 | 390 | 482 | 12.5 |
| November | 431 | 518 | 484 | 557 | 482 | 313 | 464 | 18.3 |
| December | 427 | 424 | 461 | 535 | 449 | 328 | 437 | 15.3 |
| Average | 432 | 518 | 491 | 495 | 503 | 398 | 473 | 14.6 |
| CV (%) | 12.9 | 9.5 | 9.1 | 13.2 | 11 | 15.6 | 14.6 | 0 |
Table 2: Monthly malaria incidence among the Ugandan population.
As observed for the malaria prevalence, the monthly malaria incidence rates are not easily predictable unless we get to understand the malaria transmission process involving the population at risk and that already infected with the disease.
Nonlinear least squares were used to estimate the parameter of the proposed model. The estimation was done using STATA version 12 statistical software. The beta parameter that describes the rate at which infected individuals interact indirectly with susceptible individuals resulting into new malaria cases was estimated. In addition the standard error, 95% confidence of the parameter and the adjusted Rsquared were also computed. The results of the modelling effort are presented in the Table 3.
| Parameter | Estimate standard error | Adj-R2 | 95% CI | ||
|---|---|---|---|---|---|
| Beta (b) | 2.73 | 1.35 | 0.986 | 0.018 | 5.44 |
Table 3: Parameter estimates for the proposed model.
Goodness of fit
The adjusted R2 indicates that the fitted model is very close to the observed data. This was further demonstrated in the bivariate plot of the observed and model predicted over time. This implies that the developed model fits the data reasonably well. Figure 2 shows the comparison of the observed malaria count with that of the fitted model.
The proposed model fits the data reasonably well since the model curve is close to the observed data Figure 2.

Figure 2: Observed incidence and fitted model.
Model diagnostics
Before interpreting the results of the model we assessed the adequacy of the model by evaluating the residual errors. The errors were first assessed for serial correlation using the run test already defined above. The findings of the run test revealed that the errors were randomly distributed (z=0.71, p=0.48). In addition to the run test plots of residual errors against model predicted monthly incidence, scatter plot of the errors and p-plot were done. The results are shown in Figure 3.

Figure 3: Model diagnostics.
The three plots confirm that the residuals are normally distributed therefore the results of the model can be used in the prediction and analysis.
Out-of- sample prediction
The Out-of-sample assessment was carried out by dividing the sample into two; the estimating sample of the first 59 observations that was used to estimate the parameter and the evaluation sample of 12 months that was used to evaluate the predicting power of the model by computing one-month ahead to 12 months ahead prediction errors. The bias which is the average of the errors, the Mean Absolute Deviation (MAD), Mean Square Error (MSE) and Mean Absolute Percentage Error (MAPE) were computed for the one-month ahead to 12-month ahead predictions. The results are summarized in the Table 4.
| Error Measure | Estimate | Estimate per 10000 people |
|---|---|---|
| Bias | -0.0006575 | -6.575 |
| MAD | 0.003763883 | 37.64 |
| S.E | 0.004489513 | 44.895 |
| MAPE | 12.35 | 0 |
Table 4: Out-of-sample prediction for the malaria model.
All the measures of the out-of-sample predictions for one-month ahead to 12-month ahead suggest the model give reasonable predictions Table 4. The standard error in the one month ahead and 12 months ahead out of sample prediction revealed that the predicted monthly malaria incidences were more or less by only 45 cases per 10000 people. The difference of 45 malaria cases from the actual observed seems reasonable for any predicting model to give onemonth to 12 months ahead prediction. Table 5 show the summary of the observed malaria incidence for the year 2011 compared with the model predicted incidences.
| Parameters | Monthly incidence per 10000 | |
|---|---|---|
| Month | Observed | Predicted |
| January | 310 | 345 |
| February | 282 | 309 |
| March | 293 | 282 |
| April | 298 | 293 |
| May | 347 | 299 |
| June | 409 | 349 |
| July | 327 | 412 |
| August | 277 | 324 |
| September | 306 | 276 |
| October | 316 | 307 |
| November | 245 | 317 |
| December | 264 | 243 |
Table 5: Twelve month ahead Prediction.
Table 5 shows the summary of the model prediction in comparison with observed monthly malaria incidence. The model estimates were close to what was observed at the health facilities. Therefore the proposed model can be adopted to monitor malaria incidence at the health facility level across the country.
Sensitivity analysis of the transmission rate
The qualitative analysis of the effect of the transmission rate on malaria incidence is represented in Figure 4.

Figure 4: Sensitivity analysis of the transmission rate.
The variation in monthly malaria incidence with transmission rate revealed that the monthly malaria incidence is always positive Figure 3. Furthermore, increasing transmission rate is associated with rapid increase in monthly malaria incidence. Similarly decreasing transmission rate is associated with decreasing monthly malaria incidence. Therefore, transmission rate greater than one is an indicator of increasing risk while transmission rate less than one indicates decreasing risk in the population. Further analysis of the effect of the transmission rate on the monthly malaria incidence is qualitatively represented in Figure 5.

Figure 5: Variation in malaria incidence and transmission rate.
Figure 5 reaffirms the findings of the partial derivative that revealed that monthly malaria incidence increases with increasing transmission rate. For example the monthly malaria incidence when the transmission rate is equal to 0.341 is less than when the transmission rate is equal to 2.73 Figure 5. Transmission rates greater than one are indicators of high malaria incidence rates in the population while transmission rates less than one are indicators of low malaria incidence among the population. First when the transmission rate is equal to zero, the monthly malaria incidence is zero leading to a malaria free population. Secondly if the transmission rate is equal to one, the expected number of new cases of malaria in the next month is almost equal to the number of new cases of malaria in the previous month. Thirdly if the transmission rate is between zero and one the number of new cases of malaria in the next month will be less than the number of new cases of malaria in the previous month. This is likely to happen if the disease is commonly diagnosed and identified cases immediately treated to reduce the risk in the population. Fourthly if the transmission rate is greater than one, the number of new cases of malaria in the next month will be more than the number of new cases of malaria in the previous month implying increasing incidence in the population. This always happens when asymptomatic infectious individuals among the population are not commonly diagnosed and treated. As a result one infectious asymptomatic individual will continue to infect more susceptible individuals in the population.
This chapter explained the model construction based on how infected persons in the population infect mosquitoes which in turn infect the susceptible individuals. The model has been developed using the theory of infectious disease modelling framework of the Susceptible Infectious Susceptible (SIS) model and the law of mass action. Solving the differential equation enabled us to obtain an analytic expression of a nonlinear model that explain monthly malaria incidence among people seeking treatment from government health facilities in the population. The estimate of the parameter is based on routine data obtained from health facilities during service delivery. The developed model gives insights into the usefulness of the routine data beyond being used for routine reporting. If this data is provided in a timely and accurate manner it can be used by planners and those involved in service delivery to design better interventions to prevent, control and manage the disease in the population. The model was considered good for one-month ahead to 12month ahead forecasts based on the four measures of prediction error. The proposed model could therefore be used not only to monitor malaria incidence at the various facilities but also in the quantification of malaria medicines and supplies in the country. Furthermore the model could also be used to design better preventive measures to reduce the expected number of new cases of malaria. However, further research is needed to extend the model to include factors that affect monthly malaria incidence in tropical contexts. The extension of the predictive model will give insights into the effectiveness of existing interventions within the malaria control programme and their impact in reducing the disease occurrence among the population. It should be noted that model will provide good estimate of the expected number of cases which can be used as proxy measure of the intensity of the disease in the population but does not quantify the risk in the population. There is also need to investigate how the model can be used to assess the risk in the population.
In our study we estimated the transmission rate based on the monthly observed new cases of malaria to be about 2.7(1.35). This implies that in Uganda the monthly malaria incidence among the population is increasing since the transmission rate is greater than one. This increase in malaria incidence is attributed to the presence of asymptomatic infectious individuals in the population. The findings further revealed that one infectious individual is likely to infect on average about three susceptible individuals in the population. Furthermore, the maximum number of new cases of malaria expected from one infectious individual was about five while the minimum was about zero. This implies that the incidence of malaria in the population can be reduced to negligible levels if the preventive interventions are scaled up.
Therefore reducing the current malaria incidence to zero should be carried out in phases. First phase should aim at reducing the current transmission rate from three to one. This strategy will ensure that the number of expected new cases of malaria in the next month is almost same as the number of new cases of malaria in the previous month. This can be achieved using the already existing preventive interventions to avoid new cases from already infected individuals. The most effective method used in Uganda to prevent malaria is sleeping under Insecticide Treated Nets (ITNs). According to Uganda Demographic and Health Survey (UDHS) 45% of the total population have access to ITNs (UBOS [10]). Furthermore 35% of those who had access to ITNs were sleeping under the ITNs at night (UBOS [10]).
Currently the government has scaled up the distribution of ITNs across the country with the objective of releasing 100% coverage. However the strategy may not necessary result into reduced incidence since there are many already infected individuals in the population. Our finding of one infectious individual likely to infect on average about three susceptible individuals indicate that in the population where the ITNs are being distributed there are many asymptomatic individuals. These are infected individuals who have not yet shown clinical symptoms of malaria but they are infectious. Mosquitoes that can pick a blood meal from these individuals will continue to spread the disease and hence the incidence may not decline in the short run. The best option would be where the ITNs are distributed after the individuals have gone through a malaria test. The asymptomatic cases are then treated and the nets can now be used to protect a malaria free person. This might be expensive due to lack of diagnostic facilities at most of the health facilities. However the use of Rapid Diagnostic Test (RDT) might efficient and cost effective. Therefore the combination of the diagnostic test and distribution of ITNs might provide a better strategy for the prevention and control of malaria in the population.
The second phase should involve routine diagnosis and treatment of all identified symptomatic and asymptomatic cases in the population. This can be achieved by stream ling the clinical care guidelines to emphasize that all individuals should be tested for malaria whenever they present at the health facilities if there is a functional laboratory facility. This can also be achieved within the existing Primary Health Care (PHC) community activities to prevent malaria. Once the all cases are commonly diagnosed and treated the transmission parameter will be between zero and one. This will imply that the number of new cases of malaria in next month would be less than the number of new cases of malaria in the previous month. The implementation of this strategy might prove problematic due to lack of diagnostic facilities across the country. However this limitation can be eliminated by reducing on the number of nets distributed and using those funds to purchase Rapid Diagnostic Test which are relatively cheap but also effective. For the ITNs to be effective you do not need to have 100% coverage since the ITN is supposed not only protect the person sleeping under it but also those within the household where it is used.
The study gives insights on the usefulness of routine data collection in quantifying malaria risk in the population and how they can be used to design better interventions. These findings can be used to better the Health Management Information System (HMIS) and boosts the analyses that can be performed on the routine data for better management and control of the disease.