Journal of Proteomics & Bioinformatics
Open Access
ISSN: 0974-276X
ISSN: 0974-276X
Research Article - (2023)Volume 16, Issue 1
The regulation of gene expression in response to changes in cell population density is known as Quorum Sensing (QS). The bacterium called Pseudomonas aeruginosa utilizes QS to control gene transcription in humans. So it is essential to analyse the structural characteristics of Pseudomonas aeruginosa. Secondary structures of proteins have been identified as physical processes of primary sequences, folding into functional tertiary structures that allow proteins to participate in biological events of life science. Prediction of protein secondary structure from the associated amino acids sequence is importance in bioinformatics and it is a challenging assignment for machine learning based algorithms. Even though the utilization of NN for predicting secondary structure of protein is an innovative approach, it is complex at the time of network formulation. In order to overcome this problem, learning algorithm can be utilised to train the synaptic weights. Hence, in this work, the secondary structure analysis of QscR protein (Pseudomonas aeruginosa (PDB ID: 3 szT) is obtained by adopting PSO tuned neural network. It predicts the 3 state secondary structure of QscR protein. This proposed algorithm has resulted prediction of single protein domain with higher accuracy.
Pseudomonas aeruginosa (PDB ID: 3 szT); QscR; Protein secondary structure prediction; Neuralnetwork; PSO
The Amino Acid (AA) sequence is mostly responsible for the determination of the 3-D arrangement of protein. However, it is more challenging to determine the structure of protein based on AA sequence [1,2]. Thus, the major task in computational biology, understands of complex sequence/ structure of protein as it is critical to analyse its functions and applications like drug/enzyme design [3,4]. The accurate function and the structure prediction of protein depend on the efficiency of Secondary Structure (SS) prediction [5].
Protein Secondary Structure (PSS) refers to the arrangement of polypeptides, which are the backbone of proteins. Alpha helix (H) and beta strand (E) are the two regular SS states suggested by Pauling before six decade and coil region (C) is the irregular SS type [6]. To categorize the SS into 8 fine textured states, Sander established a DSSP algorithm. DSSP precisely authorized Helix in 3 Category- (G-helix, H-alpha-helix and I-pi-helix) Strand in 2 types-(E-beta-strand and B-beta-bridge) and Coil in 3 types-(T-beta turn, S-high curvature loop and L-irregular).
Comprehensively, PSS can be considered as a link between the primary sequence as well as tertiary structure. Thus, it is utilized in many functional and structure analysis devices.
PSS prediction has been studied in a detailed manner [7]. Further, more computational methods have been established to visualize both 3 state and 8 state SS. More detailed local structure information is concurrently availed in 8 state predictions [8,9] were the first who utilised NN to predict the SS. Rost and [10,11] achieved the furthermost significant development in SS prediction by utilizing the sequence profile obtained from multiple sequence alignment. Jones et al., [12] improved a NN method called PSIPRED that acquires PSIBLAST sequence profile as input. Few other machine learning devices that implicate bidirectional recurrent neural networks (that can obtain spatial dependency) [13-18], probabilistic graphical models, a backing vector model and HMM were also used to predict PSS [19-25].
To smash this long-lasting record, an inspiring technique has to be upgraded. However, the relatively shallow architectures (currently available modes) cannot model the accurate complex sequence–structure relationship. On the other hand, 3 state SS prediction can also be examined by SOV score which is referred as SS segment based accuracy.
So far, by implementing ANN, an innovative approach for predicting the PSS has been designed. It is a tedious task to frame an ANN, as the fabrication relies on the construction, the chosen transfer function and the learning algorithm which is utilized to train the synaptic weights. The SS of QscR (Q3 prediction) is predicted in this suggested work using PSO which is utilized to train the ANN neural network.
By deriving the details from relative similarity groups of QscR, which includes both short and long range interactions existing among the AA of proteins, the database is created. The dictionary of Database of PSS (DSSP), has 8 categories of protein structures. In these categories, a shortened set of 3 SS termed as α-helix (H), β-Strand (E) and Coil (C) are considered in this work. By using 100 non- homologous protein sequences, a profile matrix is designed.
Design of PSO tuned ANNIn this, for categorization ANN is used. The variables of the ANN are tuned using the PSO.
Encoding of ANN: The input of an ANN has prearranged patterns (Residues). Each pattern is said to have 27 features with values lying between 0 and 1. There are three units in the output and these units correlate any one of the three secondary structure elements. The correlation is defined as 1 for a class of interest and a –1 for the remaining two classes. At the hidden layer, the given input along with a bias and weights generates an activation function. The hidden layer’s output associated with a different set of weights earns three outputs. The predicted class which has the maximum value is treated as an output with lowest MSE.
To construct a model, the ANN makes use of a set of
training samples. At the time of training phase, the variables like weights, bias and designed hidden neurons of ANN is enhanced using the PSO [26].
The variables are stored and used at the time of the testing stage. Initially, input weights are selected randomly and later on they are adjusted by the PSO. The output weights obtained from the hidden layer are empirically determined by utilizing the pseudo inverse. In the hidden layer, sigmoidal activation function is utilized and regarding the output neurons, linear activation function is implemented.
In ANN algorithm, the elementary steps involved are as follows
One of the stochastic optimization methods is PSO. This technique imitator of intelligent social act of colony of birds (or) schools of fish, identified as a particles in a community. In a minimum possible time, these particles by working together give a transparent and excellent solution to a problem. A random set of values called particles initialise the formation of PSO algorithm. These particles contribute collectively to achieve the desired solution. Several parameters defined by these values will increase the performance of the system. To attain the finest possible solution, this method constantly explore a multi- dimensional space set on by a fitness basis, The best values for input weights, hidden layer neurons and bias values are found using a PSO [27,28].
PSO trained ANN: The following strategies are taken into discussion to accommodate ANN with PSO algorithm [29]. In the ANN models by using the PSO algorithm, the optimum weights and the bias are realized. The search space of the algorithm with ‘n’ dimensions is formed by the weights and biases. Here ‘n’ represents the total number weights and biases that are to be developed. There are n-dimensions of position vector and velocity for every single particle. The letter ‘w’ denotes both the weights and biases. By flying the particles on all sides of the search space, the exclusive set of weights are acquired. On every repetition, a set of weights with their fitness accessed comes up along with the algorithm. This occurs by applying these weights to the nodes and by determining the value to be achieved. Subsequently, the correctness of the forecasting using the allocated weights is calculated by the variation between the original and forecasted values, the variation must be reduced using the optimization techniques. Using this view, the particle with best fitness has been attained and until now it is treated as the individual best.
Correspondingly, the swarm with the best fitness is treated as the best one globally. The present procedure is reproduced for the definite number of repetitions until the correct weight for the ANN is earned. The procedures for an ANN optimized by PSO is stated below. For a perceptron with three layers, W [1] denotes the relation among the input layer and the hidden layer whereas W [2] denotes the relation among the hidden layer and the output layer commonly. Multi-layer perceptron is trained by using the PSO method. The ith particle can be represented by
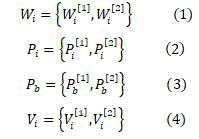
Where
j = 1, 2;
m = 1,. . . ,Mj ;
n = 1,. . . ,Nj ;
Mj & Nj - row and column size
W, P, V, r , s-Constants;
a and b-Random numbers ranges within 0 to 1;
t - Time step between observations. Usually it is unity;
V'' and W''-New values.
Applying Equation,

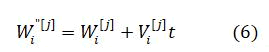
The current velocity of a particle is calculated by applying its earlier velocity and the distance of its recent location based on Pbest and Gbest value. On the right hand side of the equation, the second element serves as the exclusive thinking of the particle by its own and at the same time the third element, represents the combination in the midst of the particle as a group. The current location based on the recent velocity can be resolved by the equation as follows
The MSE is the fitness function and is given by
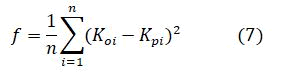
Where
F-Fitness value,
n-No.of data points.
For training 100 protein set and to test 5 protein set are used and the parameters adopted for this work is tabulated in Table 1. All the 3 SS (α-helix, β-strand and coil) exists in the form of a mixture in every sets mentioned above.
Table 1: The parameter configuration used in PSO.
| Parameters | Values |
|---|---|
| No. of Particles | 100 |
| C1 | 1 |
| C2 | 2 |
| Max. Iteration | 1000 |
Among the training data set, 47% were about coil, 31% were strand and 21% were Helix. In the testing data set, it was about 48% of C, 31% of E and 21% of H (Figure 1).

Figure 1: Best validation performance curve.
For training, validation and test steps the figure 1 depicts the MSE of ANN model. With reference to the graph at the epoch 6, the least MSE occurs and it has best validation performance equivalent to 0.35. Thus, for the sequence of chain A of QscR, the predicted SS is tabulated in (Table 2).
Table 2: Predicted secondary structure of QscR under different topology.
| Methods | Secondary structure | |||||
|---|---|---|---|---|---|---|
| Sequence (1-50) | MHDEREGYLE | ILSRITTEEE | FFSLVLEICG | NYGFEFFSFG | ARAPFPLTAP | |
| Structure | DSSP | ******SHHH | HHHH** SHHH | HHHHHHHHHH | HTT*SEEEEE | EE***STTS* |
| MLNN | CHHHHHHHHH | HHHHCCCHHH | HHHHHHHHHH | HHCCCEEEEE | EECCCCCCCC | |
| Proposed PSONN | CHHHHHHHHH | HHHHCCCHHH | HHHHHHHHHH | HHCCCEEEEE | EECCCCCCCC | |
| Sequence(51-100) | KYHFLSNYPG | EWKSRYISED | YTSIDPIVRH | GLLEYTPLIW | NGEDFQENRF | |
| Structure | DSSP | *EEEEE*** H | HHHHHHHHTT | GGGT*HHHHH | HHHS*S* EEE | ETTT*SS*HH |
| MLNN | CEEEECCCCH | HHHHHHHHHC | CHHHCHHHHH | HHHCCCCEEE | CCCCCHHHHH | |
| Proposed PSONN | HEEEECCCCH | HHHHHHHHHC | CHHHHHHHHH | HHHCCCHEEE | CCCCHHHHHH | |
| Sequence(101-150) | FWEEALHHGI | RHGWSIPVRG | KYGLISMLSL | VRSSESIAAT | EILEKESFLL | |
| Structure | DSSP | HHHHHHHTT* | *EEEEEEEE* | GGG*EEEEEE | EESSS*** HH | HHHHHHHHHH |
| MLNN | HHHHHHHHCC | CCEEEEEEEC | CCCCEEEEEE | ECCCCCCCHH | HHHHHHHHHH | |
| Proposed PSONN | HHHHHHHHCC | CCEEEEEEEC | CCCCEEEEEE | ECCCCCCCHH | HHHHHHHHHH | |
| Sequence(151-200) | WITSMLQATF | GDLLAPRIVP | ESNVRLTARE | TEMLKWTAVG | KTYGEIGLIL | |
| Structure | DSSP | HHHHHHHHHH | HHHHHHHHSG | GGG**** HHH | HHHHHHHHTT | **HHHHHHHH |
| MLNN | HHHHHHHHHH | HHHHCCCCCC | CCCCCCCHHH | HHHHHHHHCC | CCHHHHHHHH | |
| Proposed PSONN | HHHHHHHHHH | HHHHCCCCCH | CCCCCCCHHH | HHHHHHHHHE | HCHHHHHHHH | |
| Sequence(201-237) | SIDQRTVKFH | IVNAMRKLNS | SNKAEATMKA | YAIGLLN | ||
| Structure | DSSP | TS*HHHHHHH | HHHHHHHTT* | SSHHHHHHHH | HHTT*** | |
| MLNN | CCCHHHHHHH | HHHHHHHHCC | CCHHHHHHHH | HHHCCCC | ||
| Proposed PSONN | CCCHHHHHHH | HHHHHHHHCC | CCHHHHHHHH | HHHCCCC | ||
With reference to the above table it is observed that the suggested PSOANN shows better accuracy in predicting PSS than that of the other conventional methods. Apart from the detection of SS of QscR, the domination of the configuration of the amino acids is also investigated for determining the structures.
The results obtained from many SS prediction methods are expressed in terms of commonly used three SS. At the AA level, it is strange to notice an investigation of the results with few deviations. To recognize the designs of prediction accuracies in connection to various AAs, the results of categorization from many SS prediction servers are observed [30]. Thus, the influence of the composition and physicochemical properties of AAs is investigated.
In SS analysis, the AAs are not present in uniform quantities. Very few amino acids such as Glutamine, Leucine and Isoleucine possess the highest number of helix residues while Cysteine as well as Proline possesses the exact number helix residues in them. The Strand, Serine, Leucine as well as Phenylalanine are having the highest content. On the other hand, most of the acids like Asparagine, Aspartic acid do not exist strand. Similarly, Cysteine and Glutamine does not exhibit coil property. Serine and Proline are the acids which bear more number of residues in the coil structures. Alanine and Asparagine seem to have the same content in the coil and the same is depicted in Figure 2.

Figure 2a: Content of AAs in SS of QscR.

Figure 2b: Percentage of secondary structures in an amino acid.
From the above graph (Figure 2b), it is concluded that cys and gln are helix in nature and amino acids such as asn, glu and thr have not exhibited strand nature. From the analysis, it is concluded that a helix plays a vital role in QscR protein.
Various steps to calculate the forecasting efficiency have been used in this approach. In the three states of secondary structures, the percentage of residues which are correctly predicted is illustrated by Q3 accuracy. By adding together the identified and recognized segments and by calculating their overlap, the precision is furnished by Segment Overlap Measure (SOV) and it is depicted in the Table 3 (Figure 3).
Table 3: Performance analysis of Q3 and SOV of the proposed topology.
| Qoverall (%) | QH (%) | QE (%) | QC (%) | |
|---|---|---|---|---|
Q3 |
77.71 |
85.23 |
60.41 |
87.5 |
SOV |
77.6 |
85.4 |
72.9 |
52.7 |

Figure 3: Accuracy of the proposed topology.
The Figure 3 shows the parameters like Q3-training, Q3-testing, Sensitivity and Specificity for a given set of proteins which is tested. By using the terms of TP correct and FP error, the achievement of allotment can be checked out. Regarding TN and FN, they are influenced by identical explanation. The forecasted class conforming to a pre-set threshold is determined by the calculated probabilities supplied by the output of a classification. The ROC is graphed by taking the TP rate and FP rate as the co-ordinate pairs. The region below the ROC assists to combine the achievement of all the tasks which are tested.
Comparative analysisFinally, the results obtained using proposed methodology is compared with the performance of other networks which depicted the secondary structure of QscR (Tables 4,5 and Figures 4-6).
Table 4: Comparative analysis of performance of the other methods in secondary structure prediction.
| Method | Alpha (%) | Beta sheet (%) | Coil (%) |
|---|---|---|---|
| DSSP | 54 | 13 | - |
| STRIDE | 54 | 11 | - |
| MLNN | 56.96 | 11.39 | 31.64 |
| PSO-NN | 59.07 | 12.23 | 28.69 |
Table 5: Performance comparison of Q3 and SOV of the proposed topology.
| Overall (%) | QH (%) | QE (%) | QC (%) | Methodology | |
|---|---|---|---|---|---|
| Q3 | 75.74 | 83.89 | 58.33 | 85 | MLANN |
| SOV | 75.6 | 85 | 72.9 | 42.6 | |
| Q3 | 77.71 | 85.23 | 60.41 | 87.5 | PSOANN |
| SOV | 77.6 | 85.4 | 72.9 | 52.7 |

Figure 4: Comparative analysis of performance of the other methods in secondary structure prediction.

Figure 5: Overall Q3 comparison with other topologies.

Figure 6: Overall SOV comparison with other topologies
From the overall comparison study, it is concluded that the proposed PSO-NN gives more and better prediction of secondary structure than the other topologies. Similarly, it exhibits greater accuracy and high per-residue accuracy than MLNN topology.
An innovative method, ANN which depends on PSO, is implemented to identify the secondary structure of a protein during this research. The recommended predictor has achieved encouraging results and has surpassed a lot of other advanced predictors. In an individual dataset, an accuracy of 95% is achieved. The empirical performance determined by the suggested technique put up helpful hands for the detection of major protein modifications and this approach will be dynamic in the research domains where structure of proteins are predicted.
Not Applicable
I, give my consent for the publication of identifiable details, which can include photograph(s) and/or videos and/or case history and/or details within the text (“Material”) to be published in the above Journal and Article.
Not Applicable
The authors declare no conflict of interest.
This research received no external funding.
Conceptualization, Saravanan.K and Sivakumar.S.; methodology, Sangeetha. B; validation, Saravanan. K and Sivakumar., S.; formal analysis, Sangeetha. B and Guru Prasad. L.; investigation, Sangeetha. B and Guru Prasad L.; resources, Saravanan. K and Sivakumar., S.; data curation, Saravanan.K.; writing—original draft preparation, Saravanan.K and Sivakumar.S.; writing—review and editing, Sivakumar.S.; supervision, Sivakumar.S;
Not Applicable
Not Applicable
Not Applicable
Not Applicable
Citation: Balashanmugam S (2023) Prediction of 3 State Secondary Structure of Bacterial Protein (Quorum-Sensing Control Repressor - Pseudomonas Aeruginosa) Using Optimized Ann Topology. J Proteomics Bioinform. 16:630.
Received: 17-Feb-2022, Manuscript No. JPB-22-15903; Editor assigned: 21-Jun-2022, Pre QC No. JPB-22-15903; Reviewed: 08-Mar-2022, QC No. JPB-22-15903; Revised: 22-Apr-2022, Manuscript No. JPB-22-15903; Published: 01-Mar-2023 , DOI: DOI: 10.35248/0974-276X.23.16.630
Copyright: © 2023 Balashanmugam S, et al. This is an open-access article distributed under the terms of the Creative Commons Attribution License, which permits unrestricted use, distribution, and reproduction in any medium, provided the original author and source are credited.