Journal of Chemical Engineering & Process Technology
Open Access
ISSN: 2157-7048
ISSN: 2157-7048
Research Article - (2021)Volume 12, Issue 12
The voltage imbalance in distribution networks is a very common element that influences the quality of the electricity supply, which is why its study generates great interest in several researchers. In this work, the electrical supply system of the Moa 2 circuit was statistically characterized, in terms of the IEEE criteria, and a neural network was implemented, whose function is to determine the voltage unbalance; for this, the MATLAB R2018 b software was used. Likewise, for the statistical analysis, the Minitab 6 tool was used. The voltage unbalance obtained in the Moa 2 circuit was described, with 83.17% of the unbalance results being less than or equal to 2%. The chosen neural network was a network with 15 and 10 neurons in hidden layer one and two, respectively, both with sigmoidal logarithmic transfer function and a neuron with linear transfer function in the output layer.
Characterize; Red neuronal unbalance
The problems associated with the quality of energy are phenomena present in daily life. They basically consist of any deviation in voltage, current or frequency, which causes the equipment to malfunction in its final use and deteriorates the comfort, reliability, availability or economy of users, increasing consumption and demand. and significantly affecting business competitiveness [1].
The behavior of the voltage is one of the elements most approached in research related to electrical networks [2-5]. The main reason for the existence of unbalanced three-phase networks is the distribution of unbalanced single-phase loads throughout the network, although open connections, difficulties in splices, unions, bridges, incomplete transposition of lines, etc. can also be representative; therefore, it is very common, particularly in primary distribution networks, where there is a certain complexity in the system in terms of number and type of customers and circuit extension.
Cuban researchers refer to the voltage imbalance and the presence of harmonics, due to the increase in non-linear loads in the residential, commercial and industrial sectors [6,7].
A system is considered balanced when the voltages and currents in the phases are of equal magnitude and are 1200 displaced from each other. In practice, a perfectly balanced system in both voltage and current does not exist and the calculations are approximate when the sequence components of the demanded power are ignored.
According to the standard IEC 61000-4-30 (International Electrotechnical Commission), the voltage unbalance index is made taking into account the negative and positive sequence components, which are derived from the phase components through transformation by Fortescue [8-10]. Therefore, to determine the sequence components of the voltages of a threephase system, it is necessary to know the three phase components of the voltages, as well as the phase angle between them. This implies that, in a measurement campaign, where the imbalance must be controlled, equipment should be installed capable of recording these six parameters. In order to simplify these measurements, the IEC 61000-4-30 standard and the IEEE 1159 (Institute of Electrical and Electronics Engineers) standard propose alternative calculation methods. The National Electrical Manufacture Association (NEMA) limits the unbalance to a value ≤ 1% [1].
On the other hand, the IEC 61000-4-30 and the IEEE 1159 consider that due to its duration it is a phenomenon of a stable nature, whose limits are normally between 0.5 and 2% [1].
In the country, various investigations focus on the characterization and analysis of the quality of energy in electrical distribution circuits from the use of representative indices and the use of different statistical techniques with the support of computational software such as MATLAB, Minitab, among others [6,7]. When consuming the design of primary circuits that supply single-phase and two-phase loads, a reasonably balanced distribution of these between the phases must be made, admitting a maximum unbalance of 2% with the maximum allowable regulation [6].
Although the aforementioned standards place the unbalance in normal state below 2%, and higher values consider it an unusual condition that should be avoided, many companies do not know how the system serves their energy and, furthermore, they do not consider it very worrying, so balanced demands are not always required within acceptable limits. On the other hand, the development of computing and with it, artificial intelligence, has led to its application in the analysis, characterization and control of different parameters in electrical networks [8,10-12].
Precisely, artificial neural networks prove to be a powerful tool for modeling and representing abnormalities in terms of imbalance, presence of harmonics, asymmetry, among others [11,13-15].
The purpose of this research is to statistically characterize the voltage unbalance of the electrical power supply system of the Moa 2 distribution circuit in terms of the IEEE criteria and implement a neural network, whose function is to determine the unbalance, with the idea of that it can emit alarm signals and trigger the system in the event of a phase failure or extreme imbalance. In order to fulfill this purpose, measurements of phase voltages and line currents obtained from nuclei equipment are used. The standard deviation and arithmetic mean are taken into consideration to characterize the results of the voltage unbalance, as well as the representative graphs of its behavior.
For the implementation of the neural network, the MATLAB R2018b software is used, through the tool code, which allows its development with a graphical interface. The best variant is chosen from a group of tests based on the mean square error and the correlation coefficient obtained by them. Its validation is carried out with a hypothesis test of mean differences with known variance between the real value and the expected value of imbalance obtained from the neural network based on the IEEE method. For the statistical processing of the results, the Minitab 16 tool is assisted.
The purpose of this section is to expose the methods, as well as calculation tools used for the development of the research.
Measurements were taken from Nulec device discharges over a one-year period at approximately 35-second intervals; It is worth mentioning that measurements with a zero value were neglected in the study, due to the moments when the circuit was deenergized. The voltages of each phase, line currents and power are taken.
Voltage unbalance
The IEEE 1159 standard defines the unbalance in a three-phase system as the maximum deviation of the voltage of one of the phases from the average voltage, divided by the average voltage of the three phases, as presented in equation (1), according to the consulted literature [1, 8]. It should be noted that this value is obtained in percentage terms.
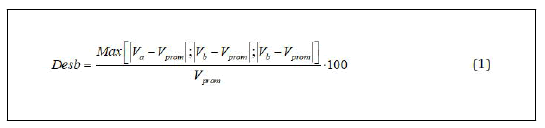
Where Va, Vb, Vc y Vprom are the phase voltages a, b and c and average tension, respectively.
Statistical analysis
For the statistical analysis, the histogram and the probability distribution graph corresponding to the imbalance in the system are taken into account, as well as indicators such as the mean and standard deviation. To select the neural network that best fits the case study, a group of tests are carried out, from which the mean square errors, standard deviations and the correlation coefficient between the variables involved and the output of the network were taken.
The training is given with the Levenberg-Marquardt algorithm of back propagation or backpropagation, used by several bibliographies [16,17].
The validation of the artificial neural network is carried out by hypothesis testing on the mean with known variance. This test, according to the literature, considers the test presented in equation (2).
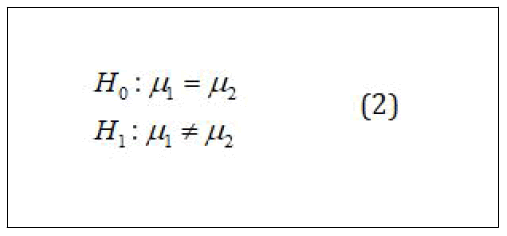
Where H0 y H1 are the null and alternative hypotheses, respectively. Likewise, μ1 y μ2 are the means corresponding to populations 1 and 2 respectively.
Assuming that a random sample of size n1 is taken from population 1 independently distributed with variance σ12, and another random sample of size n2 from the second population with variance σ22, the test procedure is based on the distribution of the difference between the sample X ̅ 1 y X ̅ 2 of population means 1 and 2 respectively, using the test statistic Z0 presented in equation (3).
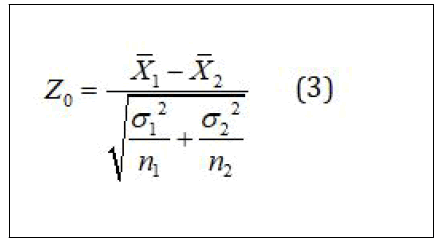
The null hypothesis is rejected if the modulus of |Z0|> Za/2, in case Z0≤ Za/2 should not be rejected H0.
For statistical processing, the Minitab 16 tool is used, which is considered by several authors as an effective tool [18-20].
Results of unbalance of tension
Voltage unbalance results Figure 1 shows the results of the behavior of the voltage unbalance in terms of the IEEE in the Moa 2 distribution circuit from the measurements carried out during the year 2020 with records of the system parameters every 35 seconds approximately. The records do not take into account the moments in which there were failures in the network, in which the circuit was not energized. The total number of samples tested equals 29114.

Figure 1: Behavior of voltage unbalance according to IEEE.
As can be seen, there are values that exceed what is established in the IEEE standard (2%); this is mainly due to the considerable number of single-phase loads, due to the fact that their demand varies their behavior depending on the time of day.
Figure 2 shows the unbalance histogram, which indicates that the values are not normally distributed. The mean and standard deviation are also presented with values of approximately 1.451 and 1.137

Figure 2: Histogram of unbalance.
This abnormality of the values may be due to the existence of some determining factor in the behavior, such as the state of the load.
However, the graph in Figure 3 indicates that the imbalance does not strictly vary with increasing load.

Figure 3: Unbalance behavior as a function of power.
To know the probability that the analyzed variable, in this case, takes a value less than or equal to a given one, the probability distribution graph is constructed. Figure 4 shows the probability of permanence of the different levels of imbalance in the system.

Figure 4:Probability function for the values obtained from the unbalance.
Thus, 83.17% of the measurements show an imbalance less than or equal to 2%, while values higher than this correspond to 16.83% of the cases
Results of the artificial neural network
In network training, approximately 85% of the measurements were taken into consideration; while the rest is considered for its validation.
To select the network that best suits the case study, the correlation coefficient obtained by the different neural network configurations and the mean square error (MSE) are used; the latter gives much more weight to large errors (outliers) than smaller ones. In other words, the MSE can be viewed as the variance of the forecast error.
Figure 5 represents the best results obtained in terms of the mean square error for different tests.

Figure 5: Representation of the MSE for different tests.
As can be seen, the most attractive effect is the NNA16 test, with an MSE of 7.66·10-6. The correlation coefficients obtained by NNA16 also offer the best results, as can be seen in Table 1.
| Essay | Correlation coefficient |
|---|---|
| NNA8 | 0.95346 |
| NNA9 | 0.95823 |
| NNA10 | 0.96779 |
| NNA13 | 0.96346 |
| NNA14 | 0.96322 |
| NNA15 | 0.9683 |
| NNA16 | 0.97145 |
| NNA17 | 0.96333 |
| NNA18 | 0.9697 |
Table 1: Results of the correlation coefficients obtained by the different tests.
Figure 6 presents the correlation coefficients between the input and output variables derived from the NNA16 test, for the values used in the training, validation, test and for all the values.

Figure 6: Correlation coefficients resulting from the NNA16 test.
It can be seen that the relationship between the input and output variables is acceptably large, with a general value of approximately 0.971.
The artificial neural network obtained is illustrated in Figure 7.

Figure 7: Structure of the neural network of the NNA16 assay.
In this way, a neural network is formed with a sigmoidal logarithmic transfer function (logsing) in its 2 hidden layers, with 15 and 10 neurons in hidden layers one and two, respectively, as well as a neuron in the output layer with a function of linear transfer (pureline). The training is carried out with the Levenberg-Marquardt algorithm of back propagation or backpropagation.
The network is designed by six inputs corresponding to the phase voltage vectors and line currents, and one output, which constitutes the unbalance based on the method used by the IEEE. The behavior of the mean square error is reflected in Figure 8. The errors obtained in the test are described, during training and validation, in which the best result was obtained in epoch 4 with a value of 8.44·10-6, approximately.

Figure 8: Mean square error behavior during training.
Note that the errors remained relatively stable both for training, testing and validation, obtaining values below the order of 10-5.
Neural network validation
Of the total of samples taken, approximately 15% (4367) are used to validate the learning process of the chosen network based on the best results obtained, statistically evaluating the error between the response of the neural network and the experiment to corroborate the quality of the prediction.
Figure 9 presents the distribution of the error obtained during the validation of the selected artificial neural network.

Figure 9: Distribution of the error obtained in the validation process of the neural network.
There are some outliers; however, the largest distribution is close to zero. For this distribution, a mean error of 5.5 · 10-3 is obtained, while the deviation is 2.77·10-3.
The graph in Figure 10 presents the histograms for the real or expected values of unbalance and the values obtained, so that they can be compared graphically.

Figure 10: Histograms of the expected value and that obtained by the neural network.
From Figure 10 it can be deduced that the mean of both results is located in very similar positions, as well as the distribution of the data is similar.
Table 2 allows verifying with values the aforementioned, in which the mean, standard deviation and the difference between means are presented.
| Statistics | Real unbalance | Obtained unbalance |
|---|---|---|
| Sample size | 4367 | 4367 |
| Mean | 0.011089 | 0.011012 |
| Satndard deviation | 0.0087563 | 0.008491 |
| Difference between means | 0.00007717 | |
Table 2: Statistical results of the comparison between the expected value and the value obtained from the voltage unbalance according to the IEEE method.
It is also obtained that, in order to quantify the uncertainty associated with estimating the difference between both cases, it can be stated with 95% reliability that the true difference is between 2.85·10-4 and 4.39·10-4.
It is clear that the values obtained are satisfactory.
According to the results of the hypothesis test carried out, there is insufficient evidence to conclude that the means are different, with a significance level of 0.05.
An analysis of the type II error is also carried out, obtaining an acceptance probability of H0 greater than 0.90, according to the values in Table 3 offered by the program itself for the bilateral test of means with a significance level equal to 0.05.
| Difference between means | Power (%) |
|---|---|
| 0.00040855 | 60 |
| 0.00045859 | 70 |
| 0.00051715 | 80 |
| 0.00059836 | 90 |
Table 3: Statistical power in correspondence with the mean differences.
The voltage unbalance obtained in the Moa 2 circuit is characterized, according to the method used by the IEEE, with 83.17 % with values less than or equal to 2 % of unbalance and 16.83 % of higher cases, with mean and standard deviation 1.451 and 1.137, respectively.
The artificial neural network that best fits the variables involved is a network with 15 and 10 neurons in hidden layer one and two, respectively, both with a sigmoidal logarithmic transfer function and a neuron with a linear transfer function in the output layer.
The hypothesis test for the difference of means with known variance indicates that there is no significant difference between the expected values and those obtained by the neural network, with a significance level of 0.05
Author contribution: All the authors have accepted responsibility for the entire content of this submitted manuscript and approved submission.
Citation: Laurencio Pérez A, Maliuk OP, Maliuk IP (2022) Power System Analysis and Application of Artificial Neural Networks. J Chem Eng Process Technol. 13:069.
Received: 07-Dec-2021 Accepted: 20-Dec-2021 Published: 27-Dec-2021
Copyright: © 2022 Laurencio Pérez A, et al. This is an open-access article distributed under the terms of the Creative Commons Attribution License, which permits unrestricted use, distribution, and reproduction in any medium, provided the original author and source are credited.