Journal of Geology & Geophysics
Open Access
ISSN: 2381-8719
ISSN: 2381-8719
Editorial - (2015) Volume 4, Issue 5
The official foundation date of Samara is 1586. That time small fortress was built at the confluence of the Volga and Samara rivers. It was protecting the eastern borders of the Russian state from nomads. After building the quay, Samara settlement became the economic and diplomatic center of Russia. In 1780, the town became the capital of Simbirsk region. The economy of Samara was growing quickly at the end of the 19th and beginning of the 20th centuries (bread trading and milling business). The population of Samara at the beginning of the 20th century was about 100,000. It was large trade and industrial center of the Volga region of Russia [1-3]. During the World War II, it was chosen to be the USSR capital in case of Moscow fall. Here defense industry was developing fast after the World War II. Soon the city became so called “closed city” of the USSR. The spaceship of Yury Gagarin (first man in space) “Vostok” was built here.
Built-up urban area of Samara city was increased with fast economic development and deepening urbanization. The major built-up area of samara city was 271.64 km2 at the end of 1985 but become 419.26 km2 in 2015, which show an increase by 147.62 km2, an annual average expansion of 14.76 km2 and an annual change rate of 5.43% in the 30 years from 1985 to 2015 (Figure 1).
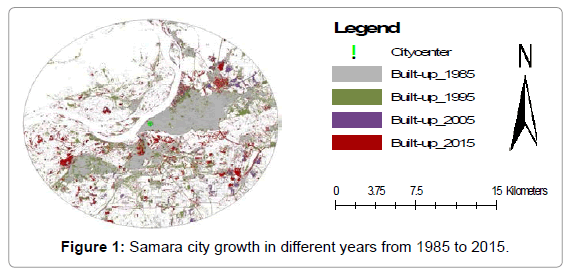
Figure 1: Samara city growth in different years from 1985 to 2015.
In 1985–1995, the built-up urban area of Samara city expands by 103.4 km2, at an annual average rate of 10.34 km2, and mostly expansion was in north and south part of the city and Volga River. In 1985–2005, the built-up urban area of Samara city reduce by -120 km2, at an annual average rate of -12.03 km2 and mainly in the form of radiation. Specially near the city center and outer part of the city. In 2005–2015, the built-up urban area of Samara city expands by 164.57 km2, at an annual average rate of 16.45 km2 and mainly in the form of radiation, especially in the east and south side and first time in west side of the city [4-7]. There is not any city development in the north side of Volga River and city due to government protection. Here government wants to preserve north side of Volga River as natural heritage (Table 1).
| Item | 1985-1995 | 1995-2005 | 2005-2015 | 1985-2015 |
|---|---|---|---|---|
| Exapansion area (Km2) | 103.4 | -120.35 | 164.57 | 147.62 |
| Expansion percentage | 38.06 | -32.08 | 64.61 | 54.34 |
| Expansion Rate (Km2a-1) | 10.34 | -12.03 | 16.65 | 14.76 |
| Annual Change Rate (%) | 3.80 | -3.2 | 6.46 | 5.43 |
Table 1: Built-up area change of Samara, Russia for 1985, 1995, 2005 and 2015.
Figure 2 represent the correlation between built-up area and population. As from 1975 to 1990 census data show, the increase of population from 1150 thousand to 1244 thousand, in the same time built–up area was also increase and till 1995 built-up area was highest (375 km2). It’s the time of Union of Soviet Socialist Republics (USSR) and as that time USSR was brake and later on population was reduce continually till 2010, around 1164 thousand population so built-up area was also reduce from 375.04 km2 (1995) to 254.69 km2 (2005). In last decade from 2005 to 2015 population was increased. Around 1173 thousand populations in 2015 so built-up area were also start to increase with very high speed due to economic development and infrastructure [8-10].
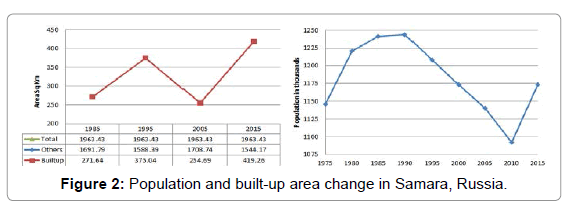
Figure 2: Population and built-up area change in Samara, Russia.
Now Samara is Russian large industrial and cultural center with multinational population and dramatic history. Samara is a large industrial center of the whole Volga river region. The city is among top Ten Russian Cities by industry volume. There are over 150 large and medium industrial plants in the city. About 25% of all bearings and 70% of all cables produced in Russia are made in Samara [11,12]. It is producing various outer space vehicles and machinery, aircraft, power stations, refinery, cranes. Samara food industry is known for its chocolate, vodka “Rodnik” and “Zhiguli” beer. Industry accounts for about 40% of the gross regional product including: automobile manufacture, air and spacecraft manufacture, which account for up to 35% of the total volume of shipped production of processing industries; enterprises with high degree of processing: chemical and metallurgical. The region manufactures 30% of new passenger cars made in Russia, 31% of polymer materials for floor, wall and ceiling coatings, 23% of anhydrous ammonia, 16% of sanitary products made from ceramics, 13% of ceramic floor tile, 7.7% of automobile gasoline and 9% of diesel fuel, 8.5% of plastics in primary forms, 7.3% of beer, 5.0% of confectionery products and 4% of mineral fertilizers. Samara is one of the largest transportation junctures in Russia; it is crossed by the shortest ways from central and Western Europe to Siberia, Middle Asia and Kazakhstan [13,14].