Journal of Infectious Diseases & Preventive Medicine
Open Access
ISSN: 2329-8731
ISSN: 2329-8731
Research - (2020)Volume 8, Issue 2
In recent study was verified the statistical hypothesis of diffusion of Covid-19 related some relevant high way of Italy (especially north regions). The geomorphological characteristic of PIANURA PADANA, whit at north closed be ALPI mountain and in south by APPENINI MOUNTAINS have created since ancient time particular climate condition. If we observe diffusion of Covid 19 in Italy at today date is possible to verify a sort of different velocity in diffusion between north region vs the other. There are relationship between this “closed environment“ and diffusion of some relevant virus? PIANURA PADANA is famous for its kind of climate with lots of fog, but also for air pollution as reported by EPHA and other organization.
PIANURA PADANA; Geomorphological; Climate condition; Covid 19 diffusion; Worsening factors; Air pollution
It seem that Italian diffusion of Covid 19 depend be some travelers that comes from Wuhan and other region of the globe, but it is interesting to notice that the strange diffusion of virus in north Italy not related with the fact that Chinese from this region not arrive in southcities of Italy using other European airport. Starting from this fact we analyze, with an observational approach (visual methods) some figure related PIANURA PADANA geo-morph graphic conditionand relate climate condition and a recent study the verify as hypothesis of work diffusion of virus according great north high way. Italy is also a PENISULA with high development north south. From 35 grades latitude south (Lampedusa isle) to 47 grades latitudes north (ALPI AURINE)(Figure 1).
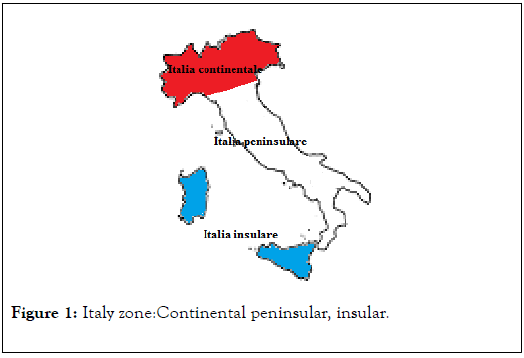
Figure 1: Italy zone:Continental peninsular, insular.
It seems that there are 1 Italy 2 different velocity in diffusion: with north very fast vs south more slow. Can be related to the famous PIANURA PADANA climate condition and air pollution? As industrial area? All this must be related to the lockdown Italian measure in March - April 2020, and the red zone of the first phases of virus diffusion in north of Italy.
With an observational approach observing some figure related to the topics of this work and some relevant literature a global conclusion is produced to submit to researcher new research topics. From literature and on line resource: [1]. A hypothesis of work is related some characteristic of Italian relevantway of travel communication. La diffusione è maggiore vicino ai grandi nodi autostradali (Figure 2).
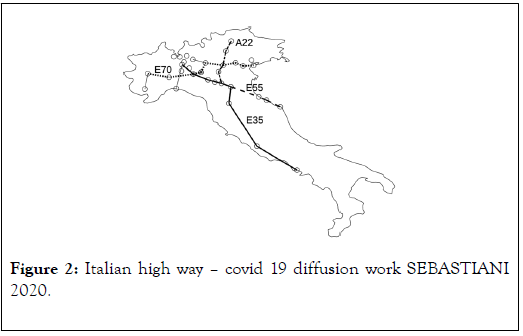
Figure 2: Italian high way – covid 19 diffusion work SEBASTIANI 2020.
And the diffusion of coronavirus seems to follow great travel communication pathway. North Italy is a real industrial area high interconnected more than south region. Connected with other parts of Italy but also with other world regions. It is a fact that today some north Italian regions are most involved in virus diffusion. Other fact is that in this region in north, there are ALPI MOUNTAIN and in south part there are APPENNINI MOUNTAINS that create an particular climate condition: PIANURA PADANA. Other fact is that in this AREA there are great level of air pollution as easily see in many scientific publications. The mortality - lethality rate it is variable in all Italian region but Lombardia presented about 17.9% (in 7 April 2020). While medium data in Italy is 12.5%, but if excluded lombardia this number is 9%. But this data depends on the real number of infected people (this data present some problems to be correctly detected related to the laboratory diagnostic) [2].
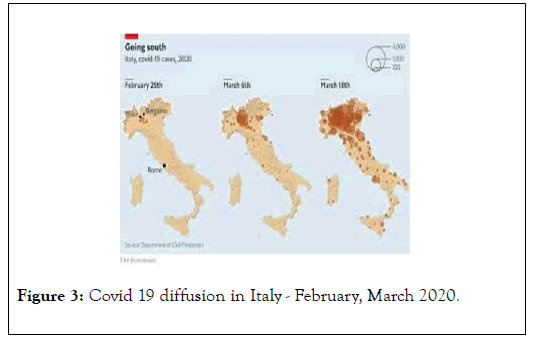
Figure 3: Covid 19 diffusion in Italy - February, March 2020.
As reported in SEBASTIANI work it is interesting to observe that the APPENIMI MOUNTAIN seem to be a kind of natural limit to the diffusion of COVID 19 in high rate (until today). This does not mean that the diffusion not will go in south of Italy: now various cases are present but what relevant is the velocity in this process. In various publication relationship related diffusion of some relevant virus and air pollution are showed and the same the influence of latitude and humidity rate.
In recent POSITION PAPER: “ Relazione circa l ’ effettodell ’ inquinamento da particolatoatmosferico e la diffusione di virus nella popolazione” univ. BARI, BOLOGNA e SIMA: It is an evidence that how the specificity of contagious cases got increased. Particularly some affected areas of Northern Italy could be linked to conditions of atmospheric particulate pollution which exercised a carrier action of boost. As already reported in previous cases of high spread of viral infection is related to high levels of atmospheric particulate contamination, it is suggested to take into account that this contribution by calling for restrictive measures to contain pollution (Figures 4-7) [3].
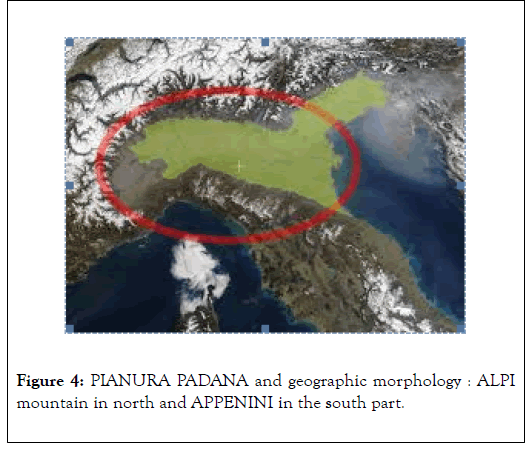
Figure 4: PIANURA PADANA and geographic morphology : ALPI mountain in north and APPENINI in the south part.
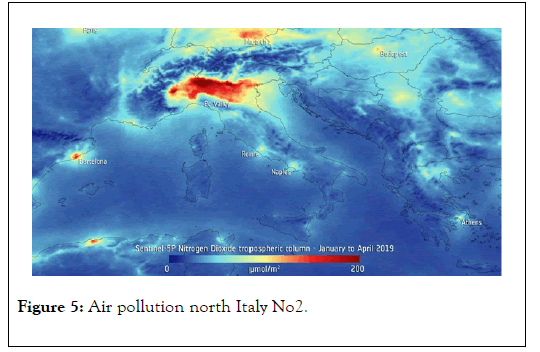
Figure 5: Air pollution north Italy No2.
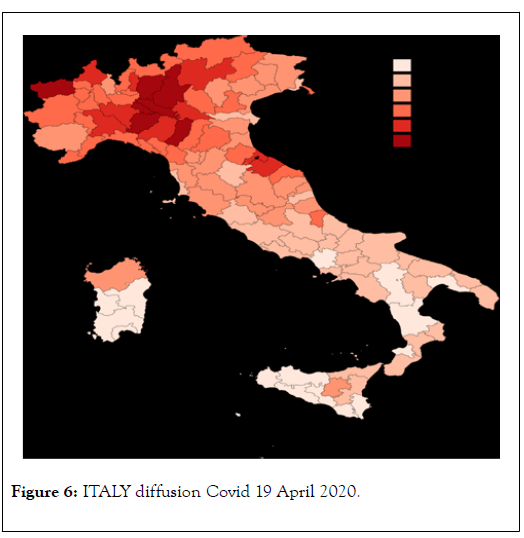
Figure 6: ITALY diffusion Covid 19 April 2020.
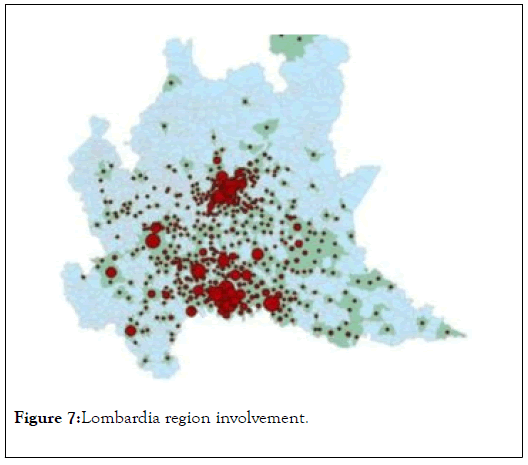
Figure 7: Lombardia region involvement.
(7 March 2020, formhttps://primapavia.it/cronaca/coronavirustutta- la-lombardia-diventa-zonarossa/).
According to CIVIL PROTECTION ITALY 12 April 2020:
"There are currently 31,265 in Lombardy, 13,672 in Emilia- Romagna, 12,505 in Piedmont, 10,729 in Veneto, 6,162 in Tuscany, 3,817 in Lazio, 3,333 in Liguria, 3,114 in the March, 3,057 in Campania, 2,452 in Puglia, 2,082 in Puglia. Autonomous Province of Trento, 2,030 in Sicily, 1,742 in Abruzzo, 1,326 in Friuli Venezia Giulia, 1,515 in the Autonomous Province of Bolzano, 903 in Sardinia, 795 in Calabria, 687 in Umbria, 588 in Valle d'Aosta, 277 in Basilicata and 202 in Molise".
According to the article published in [4]. "Climate Network Air pollution: why the air of the Po Valley became one of the worst in Europe?
The relationship is simple: more dust, more disease. Every year this reality becomes evident, visible to the eye and perceptible from the lungs.
Air pollution: why the air of the Po Valley became one of the worst in Europe?
We don't want to give up the car.
We can't give up heating.
We can't give up agriculture, but we're giving up our health.
The relationship is simple: more dust, more disease. Every year this reality becomes evident, visible to the eye and perceptible from the lungs. According to the European Environment Agency - (EEA) today, air pollution causes 461 thousand deaths - prizes per year only in Europe, 20 times more than the victims of road accidents. For those who live in the Po Valley, one of the most polluted areas of the continent, it seems an inevitable fate.
But is pollution increasing? What are the main causes? How can we defend ourselves? The Epson MeteoCenter answers these questions, engaging in the path towards a quality air.The data is surprising: the main sources of PM10 are extremely diversified, from wood-fired pizzas to bad agricultural practices. The analysis by the President of Italian Climate- Network S.Giacomin.
Is pollution really increasing more and more?
Take Lombardy, for example, well representative of the overall concentrations of the Po Valley and pollution data (in particular of the fine dust, PM10 we will focus on) are widely available on the ARPA site of the Region. Despite the fluctuations in PM concentrations also determined by weather conditions, the data demonstrate a trend towards improvement in the last decades. The air remains too polluted, but pollution is decreasing. The concentrations measured today are also orders of magnitude lower than those recorded in the 70s, 80s and 90s of the last century. An admirable effort for the Po Valley, but in any case not sufficient to fall within the limits of the law (Legislative Decree 155/2010 which transposed the EU directive on air quality) abundantly exceeded all the years.
What are the weather conditions that block the 'Po Valley'?
"The orographic and meteorological factors contribute significantly to the high concentrations of atmospheric pollutants that make Val Padana one of the most polluting areas in Europe, despite the emissions being comparable to those of other developed areas" - confirms the meteorologist of the Epson Center Weather FlavioGalbiati - “this is because the Po Valley basin is surrounded by the Alpine mountain range which influences the wind regime, the intensity of which is generally very weak. Another important factor is the high frequency of meteorological situations characterized by atmospheric stability. These conditions, typical of the winter semester in case of high pressure, originate from the meteorological phenomenon of thermal inversion. In practice, in the atmosphere the temperature does not decrease going up in altitude, as you would expect, but at a height of 800/1000 meters there is a higher temperature than that of the lower layer. This changes the local air circulation: the colder one of the lower layers, being denser and heavier, cannot rise vertically beyond the inversion level. A true 'cap' is therefore created which prevents the exchange of air, trapping pollutants near the ground, where their concentration, day after day, will only increase "[4].
According to Marc Lipsitch et al., “ Controlled influenza transmission studies conducted in mice in the 1960s were the first to suggest that transmissibility varied with temperature, relative humidity, and season[5]. Experimental infections in humans further highlighted seasonal variation in disease severity and in the rate of immune sero-conversion. Most recently, the concept that temperature and relative humidity may alter influenza transmission has been confirmed in a guinea-pig model. These data, together with laboratory experiments testing virus survival under controlled environmental conditions, are carefully revisited in the new study by Shaman and Kohn [6].
Additional evidence on mechanisms of seasonality comes from population-level studies, which typically attempt to correlate fluctuation in meteorological variables with influenza epidemiological data in a specific locale. Reinterpretation of experimental data on survival of airborne influenza virus particles demonstrates that virus- survival increases with low levels of vapor pressure. The authors note that vapor pressure is minimal during winter in indoor and outdoor settings in temperate regions and conclude that vapor pressure is a parsimonious mechanism of influenza seasonality, consistent with increased disease transmission in winter”[5].
Jeffrey Shaman et al: “ Influenza-A incidence peaks during winter in temperate regions [6]. The basis for this pronounced seasonality is not understood, nor is it well documented how Influenza-A transmission principally occurs. Previous- studies indicate that relative humidity (RH) affects both influenza virus transmission (IVT) and influenza virus survival (IVS). Here, we reanalyze these data to explore the effects of absolute humidity on IVT and IVS. We find that absolute humidity (AH) constrains both transmission efficiency and IVS much more significantly than RH. In the studies presented, 50% of IVT variability and 90% of IVS variability are explained by AH, whereas, respectively, only 12% and 36% are explained by RH. In temperate regions, both outdoor and indoor AH possess a strong seasonal- cycle that minimizes in winter. This seasonal cycle is consistent with a wintertime increase in IVS and IVT and may explain the seasonality of influenza. Thus, differences in AH provide a single, coherent, more physically sound explanation for the observed variability of IVS, IVT and influenza seasonality in temperate regions. This hypothesis can be further tested through future, additional laboratory, epidemiological and modeling studies. Absolute- humidity is predicted to increase in a warming world. The findings presented here indicate that such changes would decrease IVS and IVT rates. This potential outcome, as well as any effects on the seasonality of influenza incidence, needs to be explored carefully through additional laboratory and modeling experiments”.
According a Preprint SCAFETTA N: “This paper investigates whether the Severe Acute Respiratory Syndrome Corona Virus 2 (SARSCoV-2) pandemic – also known as Corona Virus Disease 19 (COVID-19) – could have been favored by specific weather- conditions. It was found that the 2020 winter weather in the region of Wuhan (Hubei, Central China) – where the virus first broke out in December and spread widely from January toFebruary2020–was strikingly similar to that of the Northern Italian provinces of Milan, Brescia and Bergamo, where the pandemic has been very severe from February to March. The similarity suggests that this pandemic worsens under weather temperatures between 4°C and 11°C. Based on this result, specific isotherm world-maps were generated to locate, month by month, the world regions that share similar temperature ranges. From January to March, this isotherm zone extended mostly from Central China toward Iran, Turkey, West- Mediterranean- Europe (Italy, Spain and France) up to the United State of America, coinciding with the geographic regions most affected by the pandemic from January to March. It is predicted that next spring, as the weather gets warm, the pandemic will likely worsening in northern regions(United Kingdom, Germany, East Europe, Russia and North America)while the situation will likely improve in the southern regions(Italy and Spain). However, in autumn, the pandemic could come back and affect the same regions again. The Tropical-Zone and the entire Southern Hemisphere, but in restricted southern regions, could avoid a strong pandemic because of the sufficiently warm weather during the entire year. Google-Earth-Pro interactive-maps are provided as supplements” [7].
Finally it is interesting to observe that in 8 of March following some news about a RED ZONE in lombardia by institution produced lots of people in the night to go in south region using train.
But it is not possible to verify if in this people there was or not positive one to Covid 19. This fact can be a factor to be taken in consideration in the diffusion of virus in south (Figure 8).
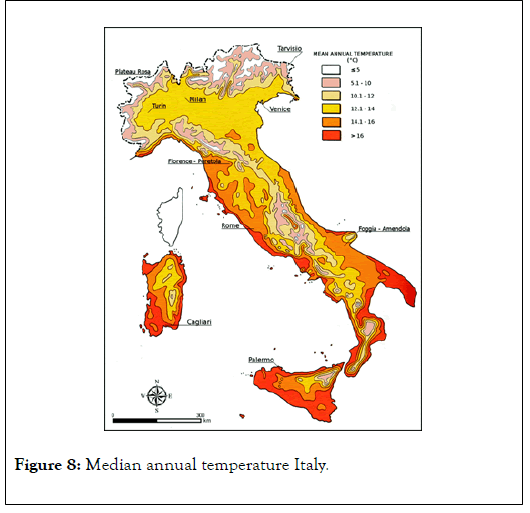
Figure 8: Median annual temperature Italy.
Related climate is possible to verify by observing Figure 8; it seems there are 2 different ZONE in north vs south.
As the hypothesis of work is an opinion for the authors to verify if the climate condition of PIANURA PADANA and related air pollution level contribute or not in the great diffusion in north of Italy of this severe disease. A kind of geomorphological environment with specific climate condition and separated by mountains at north and south.
The strange velocity in diffusion in north vs south of Italy need new research: observing lethality rate of lombardia 17.9 % vs 9 % of the rest of Italy it seem that could be 2 different area in Italy related this virus diffusion. Latitude, Climate, Air pollution and what other factor acts? Only the lockdown strategies produced this? and the role played by high way diffusion (trucks and other road transport of goods) in cross APPENINI MOUTNAINS is a fact to be taken in consideration? The relationship between air pollution and respiratory disease, acute and chronic are a scientific proof of relationship. The authors submit to the researcher the need to verify this hypothesis of work.
Citation: Luisetto M, Almukthar N, Mashori GR, Rafa AY, Latyshev OY(2020) PianuraPadana Geomorphology, Climate Condition and Diffusion of COVID -19 Hypotheses of Work. J Infect Dis Prev Med. 8: 195. Doi:10.35248/2329-8731.20.08.195.
Received: 15-Apr-2020 Accepted: 07-May-2020 Published: 14-May-2020 , DOI: 10.35248/2329-8731.20.08.195
Copyright: © 2020 Luisetto M, et al. This is an open-access article distributed under the terms of the Creative Commons Attribution License, which permits unrestricted use, distribution, and reproduction in any medium, provided the original author and source are credited.