Journal of Ergonomics
Open Access
ISSN: 2165-7556
ISSN: 2165-7556
Research - (2023)Volume 13, Issue 6
Aviation industries strive to deliver timely, safe, and airworthy aircraft (ACFT) to meet customer needs. ACFT maintenance involves adhering to planned requirements based on policies and standards. This case study examines the routine heavy maintenance processes of a major airliner during its privatization efforts, focusing on low operating costs, operational efficiency, and safe travel for both local and international passengers. Minimizing ACFT maintenance ground time has become crucial for Maintenance Repair and Operations (MRO) facilities to remain competitive in the global market. Therefore, it is essential to reassess existing processes, identify bottlenecks, and seek areas for improvement. A discrete simulation model was developed to study the maintenance processes of General Electric Engines during a heavy maintenance check on the Boeing 747. The model simulated the simultaneous maintenance procedures of all four engines, with each engine following the same set of processes and procedures. The simulation results revealed significant potential opportunities to reduce engine maintenance time by approximately 37%. This reduction in time holds the potential for significant cost savings, particularly considering that the company’s standard hourly ground cost is approximately $2,777.78.
Engines processes total time; Manpower utilization; Discrete event simulation
In the early stages of aviation, aircraft owners and engineers recognized the importance of developing maintenance schedules to prevent costly component failures and ensure safe flights while minimizing ground time. As aviation grew and gained official recognition as a regulated transportation system by the Federal Aviation Administration (FAA), factors such as safety, reliability, and on-time performance became critical in attracting passengers. Consequently, compliance with maintenance regulations became mandatory to maintain the airworthiness of aircraft parts and components. Scheduled maintenance phases encompass routine and non-routine activities that determine the maximum flight hours an aircraft can accumulate while adhering to minor engineering restrictions and/or extensions, if necessary, before the aircraft is scheduled for the next phase [1].
A report supported by George Mason University and The Boeing Company highlights the challenges faced by the airline industry in maximizing profits through increased passenger and cargo traffic flow, cost reduction, and maintaining a competitive position as a safe airline. Ongoing technological advancements, direct and indirect maintenance costs, as well as regulatory and quality compliance, are among the key factors that can influence an airline’s profitability. Although airlines encounter various operational costs, direct aircraft maintenance costs (such as manpower wages, aircraft parts, and materials) typically account for approximately 11% of the total operations cost. Moreover, there are indirect costs, commonly referred to as opportunity costs, incurred when an aircraft undergoes maintenance and cannot generate revenue by carrying passengers or cargo [2]. This indirect cost or lost revenue occurs whenever an aircraft is grounded for scheduled or unscheduled maintenance. Consequently, evaluating the duration of aircraft maintenance becomes crucial in terms of understanding the processes involved in each maintenance task. This evaluation provides an opportunity for improvement by reducing maintenance time, thereby generating revenue and minimizing indirect costs.
To gain insight into the available capacity of Delta Airlines’ engine maintenance facility compared to its current realized capacity, the Economic Development Institute at the Georgia Institute of Technology developed a simulation model. This simulation model mimicked the processes involved in engine removal during maintenance tasks, offering a comprehensive understanding of the facility’s capabilities. The simulation model demonstrated that the loading of engines into the repair cycle significantly impacts the facility’s capacity. Incorrect loading leads to a decrease in the number of engines produced, resulting in increased turnaround time with unpredictable variability. By accurately depicting the interactions between various processes and required resources during repairs, the simulation model facilitates insights into the timing and proper allocation of manpower based on the engines currently being repaired [3].
Additionally, a simulation model was developed in the military aviation field specifically for a fleet of Bae Hawk Mk51 aircraft. This model described the key aspects of maintenance, failures, and repair processes, identifying critical paths during regular maintenance operations to shorten turnaround times [4]. Building upon these advancements, the present study aims to simulate aircraft engine maintenance processes within a major Maintenance MRO facility (referred to as S). The objective is to measure the total maintenance time during a “C” check using recent actual data. The data is modeled based on an analysis of operational flow and manpower utilization to identify opportunities for minimizing maintenance time and reducing both direct and indirect maintenance costs. Furthermore, the study estimates the cost of lost revenue (ground time cost) in the current state scenario, incorporating it into the overall overhead cost. Additionally, the study examines areas for improvement aimed at reducing ground costs and saving on lost revenue (Table 1).
| Engine maintenance process | Manufacturer | S-MRO | AB-MRO |
|---|---|---|---|
| Access panels removal | 6.9 | 12 | 16 |
| Pre-hangar operations | 2.9 | 8 | 4 |
| Pre-hangar inspection | 1.2 | 4 | 2 |
| Idg oil change and routine maintenance | 9.4 | 12 | 12 |
| Engine oil change | 1.2 | 2 | 2 |
| Filters change and ignition system check | 7.1 | 16 | 14 |
| Engine baroscopic | 3.4 | 4 | 8 |
| Inspection | 1.2 | 2 | 2 |
| Engine baroscopic rectification | 2.3 | 4 | 3 |
| Fan blades and shafts lubrication | 4.7 | 16 | 10 |
| Vigv rig and routine check | 6.3 | 8 | 12 |
| Non-routine maintenance | 18.8 | 30 | 35 |
| Dehangar operational check | 12.4 | 32 | 18 |
| Final inspection | 2.5 | 6 | 4 |
| Pylon corrosion inhibitor application | 2.5 | 4 | 3 |
| P access panels installation | 7.1 | 24 | 12 |
| Average total time | 89.9 | 184 | 157 |
Table 1: Average time (hour) of engine “C” check maintenance processes.
Engine maintenance overview
The aircraft in question is equipped with four identical General Electric (GE) CF6-80 turbine engines, with two engines mounted under each wing. The maintenance “C” check is performed by two shifts: A morning shift and an afternoon shift. The morning shift, also known as crew 1, is responsible for maintaining engines 1 and 2, while the afternoon shift, or crew 2, is responsible for maintaining engines 3 and 4. Each crew receives a daily package of routine tasks to be completed. Additionally, non-routine findings are identified during quality inspections. Before the initial quality inspections take place, a series of pre-hangar operations are carried out as part of the routine open-up task. These operations include engine run-up, thrust reverse operation, pneumatic components/ seals leak check, aerodynamics smoothness check, panels removal, Integrated Drive Generator (IDG) check, oil change, and filters change (such as fuel, oil cooler, and IDG filters) (Figure 1) [5].
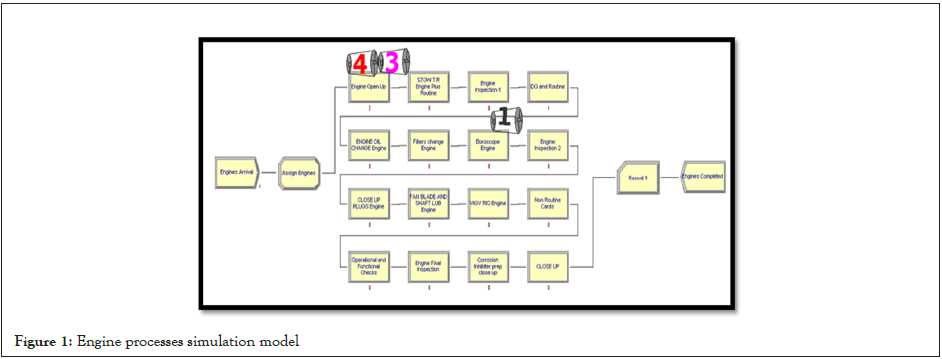
Figure 1: Engine processes simulation model
Data collection
To gather information regarding routine and non-routine maintenance processes, policies, and procedures, interviews were conducted with managers, planners, and technicians at the S Maintenance Repair and Operations (S-MRO). Various data points were collected, including scheduling history, manpower availability, overtime, available hours per week, and wages. Furthermore, the average time required for each maintenance process was calculated based on the analysis of 16 previous “C” checks conducted on the same type of aircraft at the S-MRO. Additionally, the average time for each maintenance process was obtained from Another Major Maintenance Repair and Operations (AB-MRO). To establish a standard benchmark, the standard hour for each maintenance process was obtained from the engine manufacturer representative, General Electric (GE), at the S-MRO. Lastly, reliability data concerning on-time scheduling performance, including out-of-service and back-in-service time, were collected from the flight operations scheduling division. The collected data is summarized in Table 2. Flight Operations’ daily average schedule utilization was gathered over a period of five months and the calculated average was determined to be 16.7 hours per day. This figure served as the basis for determining the standard net revenue generated by Flight Operations when an aircraft is in service, carrying passengers and/or cargo (Table 2).
|
Per Flight-leg | Per Flight-hour | Per Day-hour |
|---|---|---|---|
| Operating revenue | $213,333.33 | $12,774.45 | $8,888.89 |
| Operating cost | $146,666.67 | $8,782.43 | $6,111.11 |
| Net revenue | $66,666.66 | $3,992.02 | $2,777.78 |
Table 2: Flight operations average standard net revenue ($).
Simulation model design and model brief
The Aircraft 747-400 is equipped with four identical GE CF-60 turbine engines, which are scheduled for maintenance upon arrival at the S-MRO facility. Using the Arena®16.20 software package, a discrete event simulation was created to model the various engine maintenance tasks. In the simulation model, the engines were represented as entities entering the maintenance system and being allocated for initial processing, inspections, routine maintenance, and non-routine maintenance tasks by specific manpower resources. The simulation model incorporated the duration of each task, predicted delays, scheduled manpower, labor costs, and other relevant data. The engine team consisted of two shifts, with each shift comprising eight assigned operators.
However, only four operators from each shift were assigned to work on the engines. The 1st shift, known as “crew 1,” was responsible for engines 1 and 2 and had four operators assigned to it. Similarly, the 2nd shift, “crew 2,” was responsible for engines 2 and 3 and also had four operators assigned to it. The engine maintenance tasks for the “C” check were mostly routine cards and were consistent across all engines. Additionally, non- routine tasks exhibited similarities across different maintenance checks (Figure 2) [6].
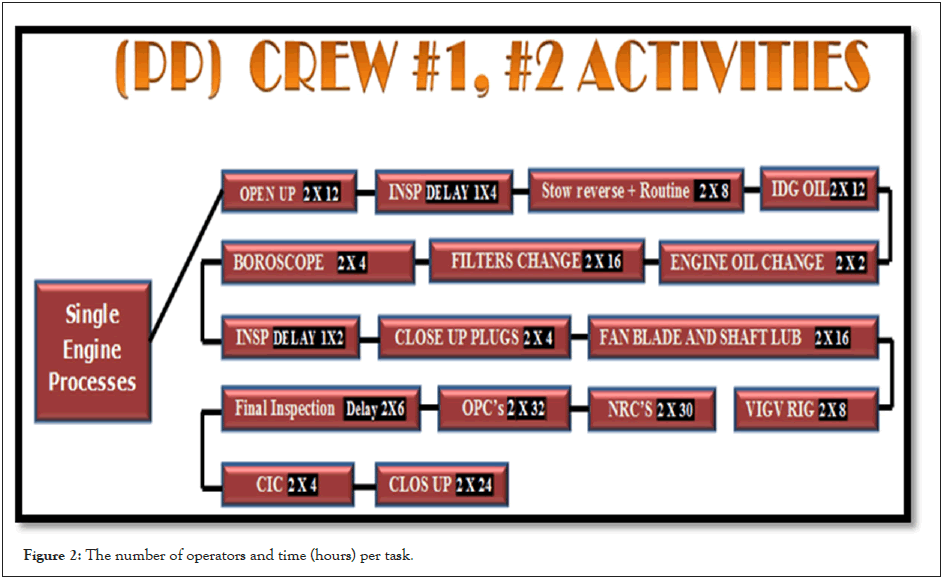
Figure 2: The number of operators and time (hours) per task.
Assumptions
• Maintenance personnel followed their Technical Policies and Procedures (TP&P).
• Required tools and equipment were available.
• Engine replacement parts and all materials were available.
• Engines maintenance will start as soon as the aircraft is pronounced out-of-service and towed to the maintenance hangar.
• There is a 25% chance that an operator may come in late on the morning shift and 5% on the afternoon shift.
System simulation model
During the morning shift, four engines arrive at the system simultaneously, and “crew 1” proceeds to open up panels on Engine 1 (two operators) and Engine 2 (two operators) simultaneously to facilitate quality inspections. Two engines are handled by the resources during the morning shift, while “crew 2” will handle Engine 3 and Engine 4 during the afternoon shift in the same manner. The resources (operators) seize the engines, delay performing maintenance tasks, and then release the engines to proceed and seize them again for the next task. This parallel process of engine maintenance involves assigning each resource from the resources pool selected from the “resource set.”
There are two “resource sets,” each consisting of four resources: the experienced set (Senior 1, Senior 2, Senior 3, and Senior 4) and the novice set (Junior 1, Junior 2, Junior 3, and Junior 4). On the morning shift from 6:00 am to 2:00 pm, Senior 1 and Junior 1 are assigned to Engine 1, and Senior 2 and Junior 2 are assigned to Engine 2. Similarly, on the afternoon shift from 2:00 pm to 10:00 pm, Senior 3 and Junior 3 handle Engine 3, while Senior 4 and Junior 4 handle Engine 4 (Figure 3). The scheduling rule for the resources’ break time was set to preemptive, meaning that if a task is immediately interrupted and changes an operator’s capacity, the break time is initiated. The engine(s) being worked on will then resume processing as soon as an operator becomes available. A 25% and 5% failure rate were added as late factors for operator attendance on the morning shift and afternoon shift, respectively (Figure 3) [7,8].
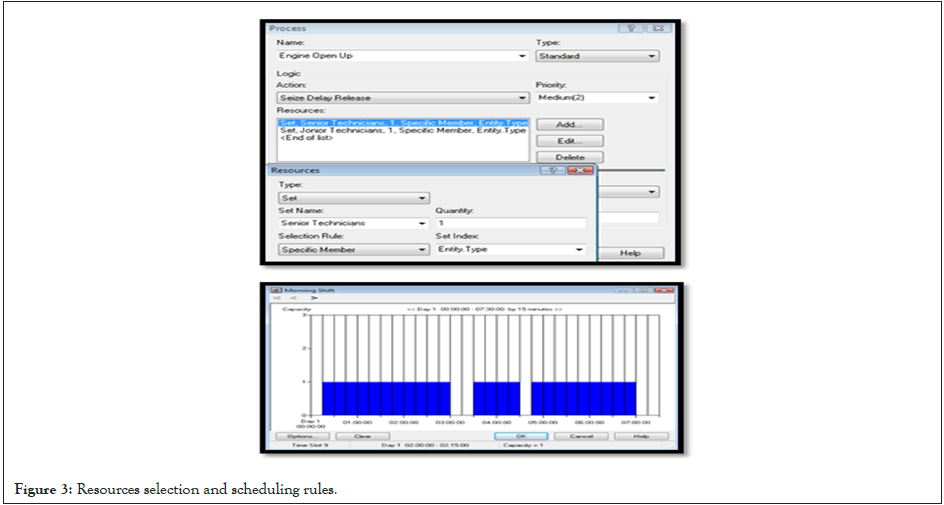
Figure 3: Resources selection and scheduling rules.
Create module
Create a module to represent engine arrivals, where a constant value of 4 engines arrives at time zero. The maximum arrival is set to 1, with no time between arrivals (Figure 4).
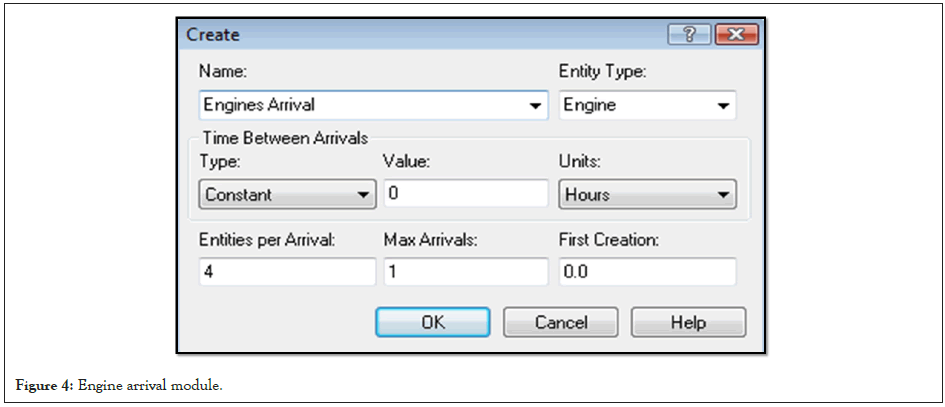
Figure 4: Engine arrival module.
Assign module
a variable value, “Index+1,” has been defined, where the first entity (Engine 1) takes a value of 0, the second entity (Engine 2) takes a value of 1, and so on until the fourth entity (Engine 4) arrives in the simulation system with a value of 3. Each specific entity, such as Engine 1, was assigned unique attributes for its entity type and picture (Figure 5).
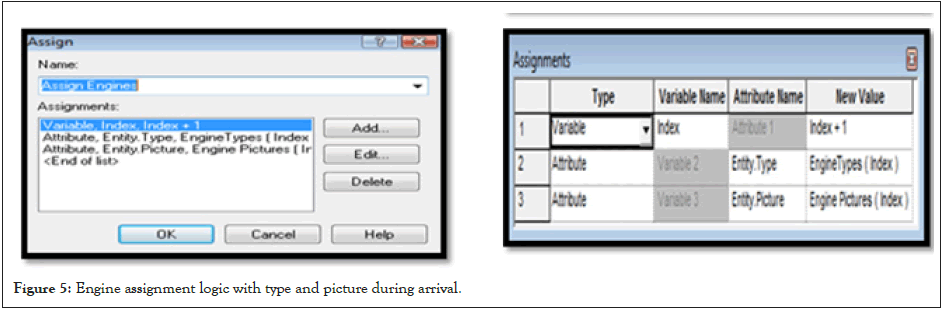
Figure 5: Engine assignment logic with type and picture during arrival.
Replication length
A terminating condition was formulated in the run/set-up window to instruct the model to stop the simulation run when the close-up process identifies that the 4th entity (Engine 4) has been released. The statistical expression used to determine this is: “last process number of entities out=4: Engine Close Up. Number Out=4”. The simulation model also incorporates the cost of labor to assess the impact of maintenance total time on projected revenue. The average wage for a senior operator is around $33.33 per hour, $21.33 per hour for a junior operator, and $36.00 per hour for a quality inspector. The estimated lost revenue per day- hour is approximately $2,777.78. Therefore, a formula has been included in the model to calculate the maintenance total cost once the last engine is released from the simulation (Figure 6) [9].

Figure 6: Simulation model termination logic.
Model verification and validation
The model underwent rigorous testing to identify and rectify any bugs, incorrect entries, undefined cells, errors, and warnings. Each engine’s maintenance was simulated independently to ensure that the results remained consistent when the maintenance processes of all four engines were modeled together in a single simulation. Furthermore, the model was validated by comparing the simulated results with the maintenance data provided by the manufacturer and S-MRO, demonstrating its accuracy and reliability. To account for the variability observed in the actual processing time of the S-MRO collected data over five years, a discrete uniform distribution was applied in the engine simulation model. This distribution allowed for a ± 20% variation in the processing time. The simulated results from 100 replications over a modeling length of 8 years were compared to the actual data, and the difference was found to be statistically insignificant. This indicated that the model remained stable and produced reliable results (Table 3).
| Manufacturer | S-MRO | |||||
|---|---|---|---|---|---|---|
| Processes per Engine | Actual time | Simulated | Diff. | Actual time | Simulated | Diff. | Open up Access Panels (hours) | 6.90 | 6.02 | 0.88 | 12 | 11.11 | 0.89 |
| Stow Reverse plus Routine | 2.90 | 2.76 | 0.14 | 8 | 8.92 | -0.92 |
| Pre inspection | 1.20 | 2.01 | -0.81 | 4 | 4.81 | -0.81 |
| IDG Oil Change plus Routine | 9.40 | 9.6 | -0.2 | 12 | 12.71 | -0.71 |
| Engine oil change | 1.20 | 2.01 | -0.81 | 2 | 2.49 | -0.49 |
| Filters change and ignition check | 7.10 | 7.02 | 0.08 | 16 | 15.71 | 0.29 |
| Engine baroscopic | 3.40 | 4 | -0.6 | 4 | 4.92 | -0.92 |
| Inspection | 1.20 | 1.99 | -0.79 | 2 | 2.15 | -0.15 |
| Plugs close up | 2.30 | 2.5 | -0.2 | 4 | 4.24 | -0.24 |
| Fan blades and shafts lubrication | 4.70 | 5.04 | -0.34 | 16 | 15.11 | 0.89 |
| Vigv rig and routine check | 6.30 | 6.49 | -0.19 | 8 | 8.26 | -0.26 |
| Non-routine cards | 18.80 | 19.06 | -0.26 | 30 | 29.82 | 0.18 |
| Operational check | 12.40 | 11.96 | 0.44 | 32 | 30.91 | 1.09 |
| Final inspection | 2.50 | 1.47 | 1.03 | 6 | 6.73 | -0.73 |
| Pylon corrosion inhibitor | 2.50 | 2.51 | -0.01 | 4 | 4.99 | -0.99 |
| General Close up | 7.10 | 7.49 | -0.39 | 24 | 23.5 | 0.5 |
| Total processes Average hours | 89.90 | 91.93 | -2.03 | 184.00 | 186.38 | -2.38 |
Table 3: The simulation model validated results compared to the actual data.
A 24 hour base time model indicated accurate waiting time during engine maintenance before completion, realistic instantaneous utilization of manpower, and projected cost. The simulation model calculates the cost only when an operator is busy (performing engine maintenance) or idle (scheduled but not performing engine maintenance and in a waiting queue, including break time). The labor cost also includes the time when a resource is inactive (operator capacity is zero and not scheduled or failed) [10]. This resulted from the daily-based pay for an operator; thus, it was converted to an hourly-based pay for easier representation of the total cost and to enable accurate calculation of the labor cost by the model (Table 4).
|
Maintenance time | Maintenance cost | Inspection time | Inspection cost | Total cost |
|---|---|---|---|---|---|
Engine 1 |
169.23 | $9,251.47 | 11.27 | $405.60 | $22,137.60 |
Engine 2 |
170.03 | $9,294.67 | 11.35 | $408.53 | $21,876.53 |
Engine 3 |
169.58 | $9,270.13 | 11.24 | $404.53 | $23,443.73 |
Engine 4 |
170.32 | $9,310.93 | 11.3 | $406.67 | $23,600.27 |
Table 4: Time and cost in a 24-hour base simulation.
The time was used to calculate the labor cost, ensuring the validity of the model and consistent results. Furthermore, the utilization of manpower demonstrated a valid model that accurately represented the dynamics of engine maintenance across various labor states and their associated costs. The time comparison and the various time base simulations conducted to assess the labor cost relative to utilization confirmed the validity of the simulation model, enabling us to draw reasonable conclusions with a rational ecological validity (Table 5).
| Resources | Instantaneous utilization | Busy cost | Idle cost |
|---|---|---|---|
| 8-hour model | |||
| Junior 1 | 0.73 | $3,469.07 | $600.27 |
| Junior 2 | 0.79 | $3,771.20 | $610.13 |
| Junior 3 | 0.83 | $3,978.40 | $286.40 |
| Junior 4 | 0.76 | $3,663.73 | $286.40 |
| Senior 1 | 0.81 | $6,002.93 | $937.87 |
| Senior 2 | 0.74 | $5,496.53 | $953.33 |
| Senior 3 | 0.78 | $5,841.60 | $447.47 |
| Senior 4 | 0.85 | $6,332.80 | $447.20 |
| 16-hour model | |||
| Junior 1 | 0.59 | $6,008.53 | $693.07 |
| Junior 2 | 0.6 | $6,108.00 | $676.00 |
| Junior 3 | 0.57 | $5,867.73 | $297.33 |
| Junior 4 | 0.58 | $5,960.80 | $281.60 |
| Senior 1 | 0.57 | $8,991.47 | $1,082.67 |
| Senior 2 | 0.57 | $8,954.13 | $1,056.27 |
| Senior 3 | 0.7 | $11,015.20 | $464.53 |
| Senior 4 | 0.69 | $10,905.87 | $439.73 |
| 24-hour model (valid) | |||
| Junior 1 | 0.48 | $7,573.87 | $693.07 |
| Junior 2 | 0.55 | $8,382.40 | $676.00 |
| Junior 3 | 0.58 | $8,851.73 | $297.33 |
| Junior 4 | 0.57 | $8,625.33 | $281.60 |
| Senior 1 | 0.58 | $13,776.27 | $1,082.67 |
| Senior 2 | 0.52 | $12,688.53 | $1,056.27 |
| Senior 3 | 0.58 | $13,822.13 | $464.53 |
| Senior 4 | 0.59 | $14,181.87 | $439.73 |
Table 5: Manpower utilization and cost in a 24-hour base simulation.
Sample size estimation
An adequate number of replications were targeted to satisfy a 95% confidence interval, mimicking the S-MRO system of the engine maintenance process. Based on the comparison of actual and simulated results, the optimum number of 100 replications was determined. The total cost of maintenance and inspection operations from Table 5 was used to estimate the initial number of replications required, considering the desired half-width (h) at the 50th percentile of the confidence interval. Initially, 10 replications were selected, and the output results of the total cost (minimum, maximum, and half-width) were analyzed using descriptive statistics, aiming for a minimum half-width relative to the range of result variability (Table 6) [11]. The first formula used to determine the desired half-width (h) with a 95% confidence interval was calculated using the actual half-width from the ten replications (h node) and the sample size (n), which is the number of replications. The formula is as follows: 10 replications*((standard deviation^2)/(h^2)). For example, 10*(($1,177.892)/($266.672))=74.9 or approximately 75 replications, which served as the initial approximation for the adequate sample size. Since the student t-distribution value was used instead of the z-value, a second formula was employed to estimate the number of replications (n) using the value of (h node). The formula is as follows: (n)=10 replications*((h0^2)/ (h^2)). For instance, 10*(($842.612)/($266.672))=99.8 replications. Consequently, 100 replications were performed to achieve the total cost ($266.67) associated with the minimum half-width (initial half-width from one replication) within a 95% confidence interval.
| (n) | Total cost |
|---|---|
| 1 | $23,890.98 |
| 2 | $21,095.53 |
| 3 | $20,663.04 |
| 4 | $20,705.22 |
| 5 | $20,880.85 |
| 6 | $22,194.37 |
| 7 | $22,655.25 |
| 8 | $23,088.31 |
| 9 | $22,067.10 |
| 10 | $20,507.54 |
Table 6: Sample size estimation.
The total process time for the “C” check engine maintenance performed by S-MRO was found to be twice the standard manufacturer time. The similarity between the simulation results and the actual data confirmed the stability of the model. Table 7 demonstrates that the simulation results indicated a significant amount of waiting time when the engines were not seized for two consecutive shifts. Engine 1 and Engine 2 were processed during the 1st shift, while Engine 3 and Engine 4 were processed during the 2nd shift. However, the 3rd shift was allocated for maintaining other components of the aircraft, such as the auxiliary power unit. Each engine required two operators to carry out the necessary tasks. Additionally, the engines had to wait for inspections to be completed before the operators could proceed with their tasks. Moreover, the inspector had to be called back at least once to reinspect an area before it was deemed ready for inspection. Other accumulated time was negligible and primarily resulted from the preempt rule, where operators initiated their break time and certain tasks had to be restarted after the break (Table 7).
| Engine model ten replications descriptive statistics of cost | |
|---|---|
| Sample mean | $21,774.82 |
| Sample standard deviation | $1,177.89 |
| 95% confidence interval half width | $842.61 |
| Minimum summary output value | $20,507.54 |
| Maximum summary output value | $23,890.98 |
Table 7: Simulation results indication of significant amount of waiting time when the engines were not seized.
Maintenance of each engine was performed for an 8-hour shift per day, while the engines remained operator-free for the remaining time. All four engines were maintained in parallel, meaning that the total time taken to maintain one engine represents the total time required to complete maintenance on all four engines. As shown in Table 5 above, the underutilization of operators also contributed to increased waiting time, although it was a minor factor with a negligible impact. The utilization rate ranged from 50% to 60%, whereas optimal utilization is typically expected to reach 80% to 85%, accounting for personal allowance time of approximately 15% to accommodate for delays, fatigue, and personal interruptions. The 20% to 25% underutilization was a result of the ratio between busy time and available time, idle time, and late attendance. The simulation software takes into account the available time an entity has in the system and adjusts resource utilization accordingly, even if they were not scheduled to perform tasks during that available time. Additionally, the lost revenue due to aircraft ground time was calculated as the entire duration from the beginning of out-of-service time until the back- in-service time of the aircraft. However, in a realistic scenario, potential revenue may also be calculated by excluding the value- added time of operations (Tables 8 and 9).
| Maintenance value-added time | Inspection non-value-added time | Waiting time | Total time | |
|---|---|---|---|---|
| Engine 1 | 169.84 | 11.59 | 479.89 | 661.31 |
| Engine 2 | 169.46 | 11.35 | 479.3 | 660.11 |
| Engine 3 | 170.64 | 11.41 | 520.88 | 702.93 |
| Engine 4 | 170 | 11.5 | 520.43 | 701.92 |
Table 8: Maintenance and inspection average time in a 24-hour base simulation.
| Entity | (1)Average time | Maintenance cost | Inspection cost | Total cost | Lost revenue** |
|---|---|---|---|---|---|
| Engine 1 | 661.31 | $36,020.41 | $405.60 | $36,426.01 | - |
| Engine 2 | 660.11 | $36,166.37 | $408.53 | $36,574.91 | - |
| Engine 3 | *702.93 | $39,490.11 | $404.53 | $39,894.64 | $1,991,011.74 |
| Engine 4 | 701.92 | $39,710.41 | $406.67 | $40,117.08 | - |
| Total Cost | - | $219,223.18 | $4,150.13 | $223,373.31 | $1,991,011.74 |
Note: *: Longest time is considered the total maintenance and inspection time (total ground time); **: Standard net revenue per hour a day is $2,777.78 and the labor cost per resource’s set is $54.67 per hour, Arena formula: ($54.67 * (1) (Engine 3.TotalTime))+((1) (Engine 3.TotalTime) * $2,777.78).
Table 9: Labor costs and lost revenue during maintenance and inspection.
Total costs were estimated based on the engine maintenance and inspection time, considering the duration of the longest process. From the simulation results of 100 replications over an 8-year period, it was found that Engine 3 had the longest average total time, which was used to estimate the airline’s lost revenue. The combined total cost of lost revenue and labor cost amounted to $2,214,385.05. In a more realistic system, potential revenue calculations may exclude the cost of value-added time for maintenance and inspection operations. On average, this value- added time accounted for approximately 170 hours, resulting in lost revenue of approximately $1,444,445.60 due to excessive waiting time. The findings indicate opportunities for reducing the total time required for “C” check maintenance at this major MRO facility. While manpower utilization and their associated costs constitute a small portion of the overall expenses, increasing manpower to ensure effective utilization of available time can have a significant impact on cost reduction by minimizing total maintenance ground time (Figure 7).
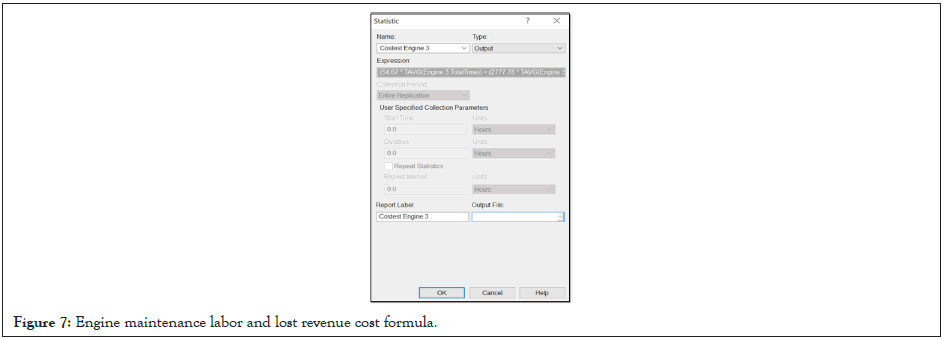
Figure 7: Engine maintenance labor and lost revenue cost formula.
The simulation model was developed to replicate the maintenance procedures conducted on B-747 engines during a “C” check. The model underwent verification and validation processes to ensure its accuracy and was then used to simulate the maintenance processes on the four engines based on the operating policies and procedures of a major MRO facility. The average time required to complete the routine and non-routine tasks for the “C” check on each engine was determined to be 184 hours, with two operators assigned to the task. The analysis revealed opportunities for improvement in manpower utilization, idle time, and inactivity time, which can lead to reduced maintenance duration and subsequently lower the cost of ground time. This, in turn, has the potential to enhance the airline’s profitability. It was observed that S-MRO engine maintenance procedures took an average of 37% more time compared to the manufacturer’s standard time and approximately 25% more time than AB-MRO procedures.
By implementing a round-the-clock maintenance schedule for all four engines, a substantial reduction in inactivity time can be achieved. It is worth noting that the cost of manpower hours during the entire “C” check amounts to approximately $223,373.31, representing only 10% of the total aircraft maintenance cost when considering the lost revenue cost as well. Increasing the manpower allocation can have a significant impact on the potential revenue increase. To capture the interdependencies and interactions between various departments, such as airframe, sheet metal, cabin, and avionics, it may be necessary to simulate other sections of aircraft maintenance. This comprehensive approach would allow for a better understanding of idle time and other waiting periods. However, it should be acknowledged that the current model has limitations, and a complete model incorporating all departments would provide a more comprehensive analysis of idle time and related factors.
Citation: Shargawi AA, Abed SY, Knopp C (2023) Optimizing Engine Maintenance Processes through Arena Simulation Modeling. J Ergonomics. 13:377.
Received: 11-Sep-2023, Manuscript No. JER-23-26710; Editor assigned: 15-Sep-2023, Pre QC No. JER-23-26710(PQ); Reviewed: 29-Sep-2023, QC No. JER-23-26710; Revised: 06-Oct-2023, Manuscript No. JER-23-26710(R); Published: 13-Oct-2023 , DOI: 10.35248/2165-7556.23.13.377
Copyright: © 2023 Shargawi AA, et al. This is an open-access article distributed under the terms of the Creative Commons Attribution License, which permits unrestricted use, distribution, and reproduction in any medium, provided the original author and source are credited.