Journal of Horticulture
Open Access
ISSN: 2376-0354
ISSN: 2376-0354
Research Article - (2015) Volume 2, Issue 3
In order to establish a suitable and effective protocol for two-dimensional gel electrophoresis (2-DE) analysis of the buds of Brassica rapa L. ssp. Pekinensis, whole proteins from fertile buds of the A/B line AB01 were extracted using three different methods (Tris-acetone-phenol method, Trizol precipitation method, TCA-acetone precipitation method). Furthermore, four aspects of the 2-DE system were optimized, including the IEF protocol, SDS-PAGE gel concentration, pH range of IPG strips and protein sample volume. The results show that the TCA-acetone precipitation method is the most effective method for whole protein extraction, and an optimized 2-DE system using the 20,000 Vh IEF protocol, pH 4-7 IPG strips, 12% SDS-PAGE gel concentration and protein sample volumes of 250 μg is suitable for 2-DE analysis of fertile bud protein in Chinese cabbage. These results can be used to facilitate proteomic studies of genic male sterility in Brassica rapa L. ssp. Pekinensis.
<Keywords: Brassica rapa L. ssp. Pekinensis; Genic male sterility; Buds; 2-DE
The concept of the proteome was first proposed by the Australian scientists Wilkins et al. [1] to describe all proteins produced by a genome, cell, tissue or whole organism at a specific time. With the arrival of the post-genome era, the study of proteomics has advanced at an unprecedented rate and has become one of the main types of functional genomics research [2]. The two-dimensional gel electrophoresis (2-DE) technique was first established by O’Farrell [3]. When combined with mass spectrometry, a proteomics approach involving 2-DE analysis is an efficient way to separate and select individual proteins [4]. To date, 2-DE has been widely used for proteomic studies of anthers in male sterile plants, especially in soybean, wheat, rice and other major agricultural crops [5-9].
To further investigate the molecular mechanism of genic male sterility in Chinese cabbage, it is particularly important to study the differences in protein expression. However, no study of bud proteomics in Chinese cabbage has been reported to date. In this study, we compared three commonly used protein extraction methods (Tris-acetone-phenol method, Trizol precipitation method, TCA-acetone precipitation method) to identify a suitable extraction method for 2-DE analysis of Chinese cabbage bud tissues. In addition, we optimized several aspects of the 2-DE system for Chinese cabbage buds including the following: IEF protocol, SDS-PAGE gel concentration, pH range of IPG strips and protein sample volume. The establishment of an effective 2-DE system for Chinese cabbage bud tissues is necessary for future proteomics studies of Chinese cabbage.
Plant materials
The fertile buds of Chinese cabbage AB01 were obtained from the Chinese cabbage experimental base at Shenyang Agricultural University, China. Seeds were vernalized in March 2013. Twenty days later, the vernalized seeds were planted in a greenhouse with average day/night temperatures of 25/16°C under natural sunlight. During the full flower period, buds were selected randomly from Chinese cabbage AB01, weighed, wrapped in aluminum foil, frozen in liquid nitrogen and stored at -80°C until protein extraction.
Protein extraction methods
Tris-acetone-phenol method: The Tris-acetone-phenol method was adapted from a protocol described by Wang et al. [10] with minor modifications. Fertile buds (1 g FW) were ground in a pre-cooled mortar with liquid nitrogen until a fine powder was formed, which was transferred into a 50 mL centrifuge tube and combined with 10 mL acetone (containing 10% TCA) and 80% methanol (containing 0.1 mol·L-1 ammonium acetate). The homogenate was vortexed with 5 mL Tris-buffered phenol (pH 8.0) before being centrifuged at 15,000×g for 10 min at 4°C. The phenolic phase was transferred into another tube and mix with 10 mL methanol (containing 0.1 mol·L-1 ammonium acetate), vortexed and stored at -20°C overnight before being centrifuged at 15,000×g for 10 min at 4°C. The pellet was washed with methanol, followed by 80% acetone. After further centrifugation, the pellet was vacuum dried, and proteins were extracted using lysis buffer as described below (TCA-acetone precipitation method).
Trizol precipitation method: The Trizol precipitation method was based on a method described by Kang et al. [11] with minor modifications. Fertile buds (1 g FW) were ground in a pre-cooled mortar with liquid nitrogen until a fine powder was formed, which was transferred into a 50 mL centrifuge tube and combined with 10 mL Trizol and 2 mL chloroform. The sample was incubated for 3 minutes at room temperature before being centrifuged at 15,000×g for 15 min at 4°C, and the aqueous phase RNA was removed. DNA was precipitated from the aqueous phase with 3 mL ethanol, and the supernatant (0.8 mL supernatant/mL Trizol) was collected and transferred into another tube after centrifugation at 15,000×g for 15 min at 4°C. Finally, the proteins in the supernatant were precipitated with 15 mL isopropanol. The pellet was washed three times with 95% ethanol (containing 0.3 mol·L-1 guanidine hydrochloride). After further centrifugation, the pellet was vacuum dried, and proteins were extracted using lysis buffer as described below (TCA-acetone precipitation method).
TCA-acetone precipitation method: The TCA-acetone precipitation method was performed according to a protocol described by Damerval et al. [12] with minor modifications. Fertile buds (1 g FW) were ground in a pre-cooled mortar with liquid nitrogen until a fine powder was formed, which was transferred into a 50 mL centrifuge tube, followed by extraction with 20 mL ice-cold acetone containing 10% (w/v) TCA and 0.07% (v/v) DTT. The samples were stored at -20°C overnight before centrifugation at 15,000×g for 60 min at 4°C. The pellet was washed three times via suspension in 20 mL ice-cold acetone containing 0.07% (v/v) DTT and precipitation for 1 h at -20°C, followed by centrifugation at 15,000×g for 60 min at 4°C. The pellet was vacuum dried and dissolved in lysis buffer (7 mol·L-1 urea, 2 mol·L-1 thiourea, 4% [w/v] CHAPS, 65 mmol·L-1 DTT, 2% [v/v] IPG buffer) by shocking for 2 h at room temperature. After centrifugation at 15,000×g for 60 min at 4°C to remove debris, the supernatant was collected.
The concentrations of the total proteins extracted as described above were determined using a 2-D Quant-Kit. The samples were immediately stored at -80°C for further analysis.
Two-dimensional gel electrophoresis (2-DE): Isoelectric focusing (IEF) was carried out using a Protein IEF Cell Electrophoresis System (Bio-Rad, CA, USA) according to the manufacturer’s instructions. Each sample was diluted in rehydration buffer (7 mol·L-1 urea, 2 mol·L-1 thiourea, 2% CHAPS, 18 mmol·L-1 DTT, 0.5% IPG Buffer, 0.002% bromo-phenol blue) to a concentration of 100 μg/strip, 250 μg/strip or 400 μg/strip in a total volume of 125 μL. Strips 7 cm (pH 3-10, pH 4-7, pH 3-6, pH 7-10) in size were utilized. The protein samples were loaded onto the IPG strips using a passive rehydration process followed by a three-step isoelectric focusing procedure for 7 cm IPG strips (Table 1).
| IEF procedure I | EF procedure II | IEF procedure III | |||
|---|---|---|---|---|---|
| Steps | Speed | Electric procedure | Times | Times | Times |
| S1 | Linear | 250 V | 0.5 h | 0.5 h | 0.5 h |
| S2 | Rapid | 500 V | 0.5 h | 0.5 h | 0.5 h |
| S3 | Linear | 4000 V | 3 h | 3 h | 3 h |
| S4 | Rapid | 4000 V | 15 000 V·h | 20 000 V·h | 25 000 V·h |
| S5 | Rapid | 500 V | 12 h | 12 h | 12 h |
Table 1: Isoelectric focusing parameters.
After the first dimension of electrophoresis, the individual IPG strips were equilibrated for 15 min in 2 mL equilibration solution (6 mol·L-1 urea, 2% [w/v] SDS, 0.375 mol·L-1 Tris-HCl [pH 8.8], 20% [v/v] glycerol and 2% [w/v] DTT), followed by a further 15 min of equilibration in equilibration buffer containing 2.5% (w/v) iodoacetamide instead of DTT. The separation in the second dimension was performed in a Protein plus Dodeca cell (Bio-Rad, CA, USA). SDS-PAGE gel concentrations of 10%, 11% and 12% were used, respectively. Separation was carried out at 80 v per gel for 10 min and 150 v for 2 h. After electrophoresis, the gels were stained with Coomassie brilliant blue R350. Coomassie-stained gels were scanned at 600 dots per inch (dpi) using an UMAX Power look 2100 XL imaging densitometer (Taiwan of China).
Comparison of three extraction methods by 2-DE
Bud proteins extracted using three different extraction methods were analyzed by 2-DE under identical conditions (7 cm IPG strips with linear pH gradient 3-10, sample volume of 250 μg); the extracts produced distinctive 2-DE patterns (Figure 1). The results of 2-DE analysis reveal that the TCA-acetone precipitation method (Figure 1C) was much better than the other two methods (Figure 1A and 1B). Compared with the other methods, the protein spots from the TCA-acetone precipitation method were rounder and clearer, and they almost covered the entire gel area, with fewer horizontal and vertical stripes. Therefore, the TCA-acetone precipitation method is better than the Trizol precipitation method and the Tris-acetone-phenol method for preparing protein samples from fertile buds for use in 2-DE analysis.
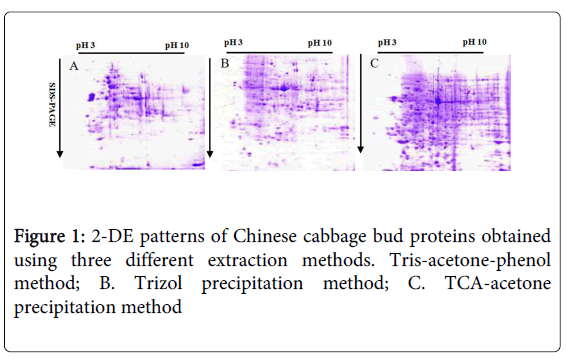
Figure 1: 2-DE patterns of Chinese cabbage bud proteins obtained using three different extraction methods. Tris-acetone-phenol method; B. Trizol precipitation method; C. TCA-acetone precipitation method
Optimization of isoelectric focusing (IEF) procedure
Fertile bud proteins extracted by the TCA-acetone precipitation method were analyzed by 2-DE under identical conditions (7 cm IPG strips with linear pH gradient 3-10, sample volume of 250 µg). A comparison of the effects of various focusing times on 2-DE patterns revealed that the distribution of protein spots was much better after focusing at 20,000 Vh (Figure 2C) than under the other conditions (Figure 2A and 2B), as focusing at 20,000 Vh produced spots that were rounder and more evenly distributed, with many acidic and basic protein spots fully distinguishable.
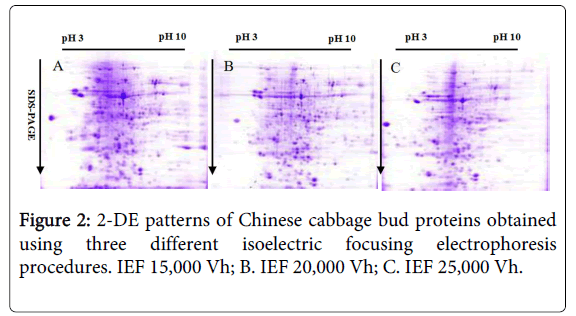
Figure 2: 2-DE patterns of Chinese cabbage bud proteins obtained using three different isoelectric focusing electrophoresis procedures. IEF 15,000 Vh; B. IEF 20,000 Vh; C. IEF 25,000 Vh.
Optimization of SDS-PAGE gel concentration based on 2-DE pattern
Bud proteins extracted by the TCA-acetone precipitation method were analyzed by 2-DE under identical conditions (7 cm IPG strips with linear pH gradient 3-10, sample volume of 250 μg) using gels at concentrations of 10%, 11% and 12%. Although there were no significant differences in the number of protein spots among the three types of gels (Figure 3), the high molecular mass protein spots and the low molecular mass protein spots were much clearer in the 12% SDS-PAGE gels (Figure 3C) than in the other SDS-PAGE gels (Figure 3A and 3B), revealing that the proteins were more easily separated in the 12% SDS-PAGE gels.
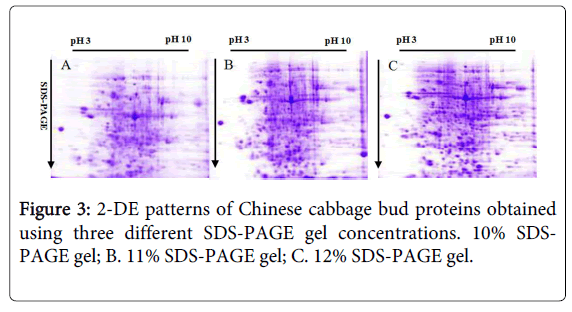
Figure 3: 2-DE patterns of Chinese cabbage bud proteins obtained using three different SDS-PAGE gel concentrations. 10% SDS-PAGE gel; B. 11% SDS-PAGE gel; C. 12% SDS-PAGE gel.
Optimization of pH range of IPG strips
Bud proteins extracted by the TCA-acetone precipitation method were separated using 7 cm linear pH gradient IPG strips with pH ranges of 3-10, 4-7, 7-10 and 3-6 and subjected to SDS-PAGE with 12% SDS-PAGE gels. First, an IPG strip with a wide range of pH values (pH 3-10) was used for 2-DE, resulting in an uneven separation of protein spots, which were mainly concentrated in the middle section of the gel (Figure 4A). Then, IPG strips with narrow pH ranges were selected for further analysis. Much fewer protein spots were observed in the 2-DE gels obtained using a pH 3-6 IPG strip (Figure 4C) and a pH 7-10 IPG strip (Figure 4D), but most of the protein spots were concentrated within a linear range using the pH 4-7 IPG strip (Figure 4B). Therefore, better separation of protein spots in 2-DE gels can be obtained using pH 4-7 IPG strips.
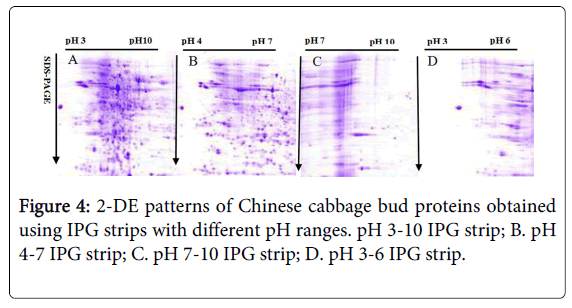
Figure 4: 2-DE patterns of Chinese cabbage bud proteins obtained using IPG strips with different pH ranges. pH 3-10 IPG strip; B. pH 4-7 IPG strip; C. pH 7-10 IPG strip; D. pH 3-6 IPG strip.
Optimization of sample volume
Proteins extracted from fertile buds using the TCA-acetone precipitation method were analyzed by 2-DE (Figure 5) under identical conditions (7 cm, pH 4-7 IPG strips; 12% SDS-PAGE gels). When the sample volume was 100 μg for 7 cm IPG strips (Figure 5A), the low abundance protein spots were quite faint and difficult to see. When the sample volume was increased to 400 μg for 7 cm IPG strips (Figure 5C), the high abundance protein spots covered the surrounding spots, making them difficult to see, especially on the right sides of the gels. While 250 μg samples were load onto 7 cm IPG strips (Figure 5B) were loaded, the best resolution of low and high abundance proteins was obtained, along with clear backgrounds.
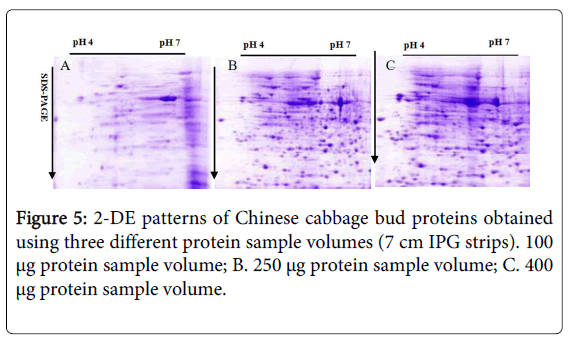
Figure 5: 2-DE patterns of Chinese cabbage bud proteins obtained using three different protein sample volumes (7 cm IPG strips). 100 μg protein sample volume; B. 250 μg protein sample volume; C. 400 μg protein sample volume.
There are many types of substances in plants, such as salts, nucleic acids, insoluble organic compounds, polysaccharides and so on, that can strongly interfere with the separation and staining of proteins in 2-DE [13]. Therefore, different protein extraction methods should be used for different plant materials. The proper preparation of protein samples significantly affects subsequent research, making protein extraction the most significant step in proteomic analysis. To date, numerous plant protein extraction methods have been reported [14-17]. The TCA-acetone precipitation method is the best method for analysis of HL-Type cytoplasmic male sterility in rice anthers and rapeseed [18,19], while the phenol extraction method is ideal for extracting proteins from kenaf leaf tissue and other recalcitrant plant tissues [20,21]. In the current study, a comparison of 2-DE patterns from Chinese cabbage bud tissue (Figure 1) indicated that the TCA-acetone precipitation method (Figure 1C), which produces the highest resolution and quality of proteins, is the best method for extracting proteins from these tissues for use in 2-DE analysis.
The parameters used in isoelectric focusing (IEF) can affects the quality of 2-DE patterns. For example, if the duration of isoelectric focusing is insufficient, some protein spots will cluster together to produce horizontal strips, which prevents the effective separation of proteins in 2-DE gels. In addition, degeneration can lead to the loss of basic protein spots in 2-DE patterns if the isoelectric focusing step is too long [22]. After comparing 2-DE patterns obtained by using three different IEF procedures, we determined that the protein spots produced using a focusing time of 20,000 Vh were rounder and clearer than those produced using other focusing conditions (Figure 2).
The SDS-PAGE gel concentration can have an impact on the migration and distribution of different high molecular mass proteins. At higher gel concentrations, the resistance encountered by a number of high molecular mass proteins is great, which may cause these proteins to appear contiguous on the gels [23]. By contrast, some low molecular mass proteins can easily move through lower-concentration gels, or they may even be lost due to the large aperture of the gels [19]. Therefore, selecting an appropriate concentration of SDS-PAGE gel is a key step in obtaining higher-quality patterns. In the current study, the quality of 2-DE patterns obtained using a gel concentration of 12% was better than that of other gels concentrations, suggesting that 12% gels are the most suitable for 2-DE analysis of Chinese cabbage buds (Figure 3).
IPG strips with different pH ranges should be chosen for different plant tissues. The better use of IPG strips not only ensures that the pIs of proteins will be covered as more as possible, but it also prevents clustering of proteins with similar pIs [24,25]. In general, pH 4-7 IPG strips are used to separate proteins from plant tissues, because such strips can separate more than 80% of protein spots in a gel [8], but such strips are usually not suitable for root tissue [26]. In the current study, we initially selected IPG strips with a wide range of pH values (pH 3-10) for protein separation, and we then compared the 2-DE patterns resulting from the use of IPG strips with narrow pH ranges (pH 3-6; pH 4-7; pH 7-10). The results indicate that pH 4-7 IPG strips were more suitable for 2-DE analysis of Chinese cabbage buds compared with the other IPG strips (Figure 4).
Sample volume also has an impact on the separation of protein spots in gels [27]. The appropriate choice of sample volume depends on the following factors: the staining method; the complexity of the sample; the length and pH range of IPG strips and so on [22]. Protein spots will be visible on SDS-PAGE only if the pI of the protein is within the pH range of the IPG strip. When the amount of protein in the sample is too high, the vertical separation of proteins with the same pI can be hindered, which would lead to vertical streaking in the 2-DE gel. However, if low amounts of protein are utilized, low abundance proteins may not be clearly visualized in the 2-DE gels. In this study, the 2-DE patterns with the highest quality and resolution were obtained when the sample volumes were 250 μg (Figure 5B).
The TCA-acetone precipitation method appears to be the best method for 2-DE protein separation from Chinese cabbage buds among the three extraction methods examined. This method not only removed interfering substances from the protein samples, but it also led to the production of high quality 2-DE patterns with clear backgrounds. A suitable 2-DE system was established using the following optimized conditions: 20,000 Vh focusing time, 12% SDS-PAGE gels, pH 4-7 IPG strips, sample volume of 250 μg protein.
This work was supported by grants from the National Natural Science Foundation of China (No. 31272157), and the Liaoning Province Natural Science Foundation of China (No. 2013020071).