Drug Designing: Open Access
Open Access
ISSN: 2169-0138
ISSN: 2169-0138
Editorial - (2014) Volume 3, Issue 3
For assessment of biosimilarity of biosimilar products, the United States Food and Drug Administration proposed a stepwise approach for providing totality-of-the-evidence of similarity between a proposed biosimilar product and a US-licensed (reference) product. The stepwise approach starts with assessment of critical quality attributes that are relevant to clinical outcomes in structural and functional characterization in manufacturing process of the proposed biosimilar product. FDA suggests that these critical quality relevant attributes be identified first and then classify them into three tiers depending upon their criticality, e.g., most (Tier 1), mild to moderate (Tier 2), and least (Tier 3) relevant to clinical outcomes. To assist the sponsors, FDA also recommends some potential statistical approaches for assessment of analytical similarity for CQAs from different tiers: equivalence test for CQAs from Tier 1, quality range approach for CQAs from Tier 2, and descriptive raw data and graphical comparison for CQAs from Tier 3. However, FDA mainly focuses on the assessment of analytical similarity for CQAs from Tier 1 and Tier 2. In this article, statistical evaluation and interpretation (with an example) on the FDA’s recommended approach for analytical similarity for CQAs from Tier 1 and Tier 2 are provided.
<Keywords: Stepwise approach, Critical quality attribute (CQA), Equivalence test, Quality range approach
On February 9, 2012, the U.S. Food and Drug Administration (FDA) [1-3] released three draft guidances about the demonstration of biosimilarity of biosimilar products. These draft guidances include (i) Scientific Considerations in Demonstrating Biosimilarity to a Reference Product; (ii) Quality Considerations in Demonstrating Biosimilarity to a Reference Product, and (iii) Biosimilars: Questions and Answers Regarding Implementation of the Biologics Price Competition and Innovation (BPCI) Act of 2009. These guidances are intended not only (i) to assist sponsors to demonstrate that a proposed therapeutic protein product is biosimilar to a reference product for the purpose of submitting a marketing application under section 351(k) of the Public Health Service (PHS) Act, but also (ii) to describe the FDA’s current thinking on factors to consider when demonstrating that a proposed protein product is highly similar to a reference product which was licensed under section 351(a) of the PHS Act. In addition, the guidances provide answers to common questions from sponsors interested in developing proposed biosimilar products; biologics license application (BLA) holders, and other interested parties regarding FDA’s interpretation of the Biologics Price Competition and Innovation (BPCI) Act of 2009.
The FDA draft guidance discusses important approaches for assessing biosimilarity, including (1) a stepwise approach to demonstrating biosimilarity and (2) the concept of totality-ofthe- evidence for the regulatory review and approval of biosimilar applications. The draft guidance covers various topics such as (1) complexities of protein products; (2) U.S.-licensed reference products and other comparators; (3) studies required for demonstrating biosimilarity, e.g., structural analysis, functional assays, animal data, and clinical studies, and (4) post-marketing safety monitoring considerations. Many important scientific factors and issues are discussed. They include (1) the use of human pharmacology data; (2) the assessment of clinical immunogenicity; (3) the use of clinical safety and effectiveness data; (4) clinical study design issues, and (5) extrapolation of clinical data across indications.
The stepwise approach starts with similarity in structural and functional characterization in manufacturing process of biosimilar product. Analytical similarity assessment sometimes refers to the assessment of critical quality attribute (CQA) in comparing the structure and function of biosimilar products. Since the differences are often assessed though analytical test results of critical quality attributes relevant to clinical outcomes in manufacturing process, the assessment of CQAs between a proposed biosimilar product and a reference product lots is also referred to as analytical similarity assessment. In practice, there may be a large number of CQAs which may be relevant to clinical outcomes. Thus, it is almost impossible to assess analytical similarity for each one these CQAs. As a result, FDA suggests that the sponsors to identify CQAs that are relevant to clinical outcomes and classify them into three tiers depending the criticality (e.g., most, mild to moderate, and least) relevant to clinical outcomes. At the same time, FDA also recommends some statistical approaches for assessment of analytical similarity for CQAs from different tiers. For example, FDA recommends equivalence test for CQAs from Tier 1, quality range approach for CQAs from Tier 2, and descriptive raw data and graphical presentation for CQAs from Tier 3. However, FDA mainly focuses on the assessment of analytical similarity for CQAs from Tier 1. The main purpose of this article is not only to conduct statistical evaluation on the FDA’s recommended approach for analytical similarity for CQAs from Tier 1 and Tier 2, but also to provide interpretation (with a detailed example) of the test results for analytical similarity assessment are provided.
As indicated in the BPCI Act, a biosimilar product is defined as a product that is highly similar to the reference product notwithstanding minor differences in clinically inactive components and there are no clinically meaningful differences in terms of safety, purity, and potency. Based on BPCI’s definition, biosimilarity requires that there are no clinically meaningful differences in terms of safety, purity and potency. Safety could include pharmacokinetics and pharmacodynamics (PK/ PD), safety and tolerability, and immunogenicity studies. Purity includes all critical quality attributes during manufacturing process, stability, etc. Potency is referred to efficacy study. In the 2012 FDA [1-3] draft guidance on Scientific Considerations in Demonstrating Biosimilarity to a Reference Product, FDA recommends a stepwise approach be considered for providing totality-of-the-evidence to demonstrating biosimilarity of a proposed biosimilar product as compared to a reference product.
The stepwise approach suggests beginning with the assessment of similarity in critical quality attributes at various critical stages of manufacturing process, especially at the stages of structural and functional characterization. The stepwise approach continues with PK/PD studies, animal studies, clinical immunogenicity, and clinical studies for safety/tolerability and efficacy. To provide a better understanding, Figure 1 summarizes a stepwise approach to demonstrating biosimilarity.
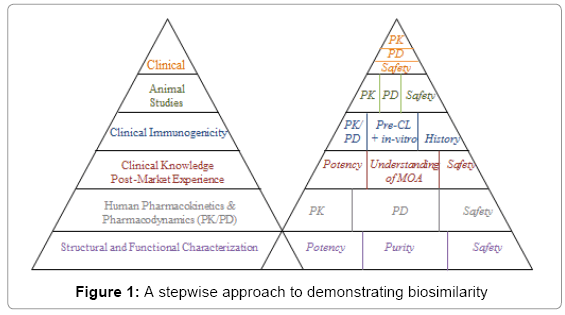
Figure 1: A stepwise approach to demonstrating biosimilarity
As it can be seen from Figure 1, the left hand side of the pyramid summarizes FDA’s recommended stepwise approach from bottom up. That is, we start with the assessment of similarity in critical quality attributes (CQAs) at various stages of manufacturing process of the biosimilar product as compared to those of the reference product. The assessment of CQAs at various stages of manufacturing process is also referred to as the assessment of analytical similarity because the comparisons are made mainly based on analytical test values from several lots (or batches) of the manufacturing process. The right hand side of the pyramid indicates sponsor understands or plan following the FDA’s suggested stepwise approach. As there may be discrepancies, the sponsor is encouraged to consult with FDA medical/statistical reviewers with the proposed plan or strategy for the stepwise approach for regulatory agreement and acceptance. This is to make sure that the information provided is sufficient to fulfill with FDA’s requirement for providing totality-of-the-evidence for demonstration of biosimilarity of the proposed biosimilar product as compared to the reference product.
Note that while a statistical approach to evaluate quality attributes of a proposed biosimilar product may be considered in support of a demonstration that the proposed biosimilar product is highly similar to the reference product, FDA’s determination that a proposed biosimilar product is highly similar to the reference product will be based upon the totality of the evidence relevant to the assessment. For providing totality-of-the-evidence, FDA seems to suggest a scoring system from domain (functional area such as manufacturing process, PK/PD, animal studies, and clinical development) to domain. Each domain may carry different weights, which usually depends upon their relevance to clinical outcomes (safety and efficacy).
As indicated earlier, the stepwise approach starts with the assessment of similarity in critical quality attributes (CQAs) at various stages of the manufacturing process of the proposed biosimilar product. Since these CQAs are often assessed based on analytical test values, thus, it is also referred to as assessment of analytical similarity. As indicated in Chow [4], the manufacturing process of a biosimilar product is a very complicated process which typically involves cell bank, fermentation, purification, formulation, and fill/finish. Thus, there are often a large number of CQAs which may have an impact on clinical outcomes of the final product.
Classification CQAs
For assessment of analytical similarity, FDA encourages the sponsors to assess all relevant critical quality attributes (CQAs) by ranking in terms of its criticality relevant to clinical outcomes. Based on these criticality rankings, FDA suggests classifying all relevant CQAs into three tiers. Tier 1 includes CQAs with the highest risk relevant to clinical outcomes. CQAs in Tier 1 would generally include assay(s) that evaluate clinically relevant mechanism(s) of action of the product for each indication for which approval is sought. Tier 2 includes CQAs lower (say mile to moderate) risk associated with clinical outcomes, while Tier 3 contains CQAs with the lowest risk or least impact on clinical outcomes.
FDA also pointed out that in addition to criticality, other factors such as the levels of the attribute in both the reference product and proposed biosimilar product, the sensitivity of an assay to detect differences between products and an understanding of the limitations in the type of statistical analysis that can be performed due to the nature of a quality attribute should also be considered in assigning quality attributes and assays to a particular tier.
Equivalence test for Tier 1
For Tier 1, FDA recommends an equivalency testing for assessment of analytical similarity be performed. As indicated by the FDA, a potential approach could be a similar approach for bioequivalence testing for generic drug products [5,6]. In other words, for a given critical attribute, we may test for equivalence of the following interval (null) hypothesis:
H0 : μT - μR ≤ -δ or μT - μR ≥ δ,
where δ > 0 is the equivalence limit (or similarity margin), and μT and μR are the mean responses of the test (proposed biosimilar) product and the reference product lots, respectively. Analytical equivalence (similarity) is concluded if the null hypothesis of inequivalence (dissimilarity) is rejected. Similar to the confidence interval approach for bioequivalence testing under the raw data model, analytical similarity would be accepted for the quality attribute if the (1-2α)100% two-sided confidence interval of the mean difference is within (– δ, δ).
Under the null hypothesis (1), FDA indicates that the equivalence limit (similarity margin), δ, would be a function of the variability of the reference product, denoted by σR. It should be noted that each lot contributes one test value for each attribute being assessed. Thus, σR is the population standard deviation of the lot values of the reference product. Ideally, the reference variability, σR, should be estimated based on some sampled lots randomly selected from a pool of reference lots for the statistical equivalence test. In practice, it may be a challenge when there are a limited number of lots available. Thus, FDA suggests the sponsor providing a plan for how the reference variability, σR will be estimated with a justification [4-6].
Along this line, FDA indicates that one potential approach is to assume that the equivalence limit (similarity margin) is proportional to the reference product variability, i.e., δ = c * σR. The constant c can be selected as the value that provides adequate power to show equivalence if there is only a small difference in the true mean between the biosimilar and the reference product, when a moderate number of reference product and biosimilar lots are available for testing. To illustrate FDA’s recommended approach for assessment of analytical similarity for a critical attribute, as an example, suppose we have 10 biosimilar and 10 reference product lots. If we choose δ = 1.5σR (i.e., c = 1.5) for all sample sizes used in equivalence testing, the test would yield a positive result if the 90% confidence interval about the difference in sample means lies within (-1.5 σR, 1.5 σR). This test would have approximately 84% power at the α=5% level of significance when the true underlying mean difference between the proposed biosimilar and reference product lots is equal to σR/8 .
Quality range approach for tier 2
For Tier 2, FDA suggests that analytical similarity be performed based on the concept of quality ranges, i.e., ±xσ , where σ is standard deviation of reference product and x should be appropriately justified. Thus, the quality range of the reference product for a specific quality attribute is defined as  . Analytical similarity would be accepted for the quality attribute if a sufficient percentage of test lot values (e.g. 90%) fall within the quality range.
As it can be seen, for a given critical attribute the quality range is set based on test results of available reference lots. If x=1.645, we would expect 90% of the test results from reference lots lie within the quality range. If x is chosen to be 196, we would expect that about 95% test results of reference lots will fall within the quality range. As a result, the selection of x could impact the quality range and consequently the percentage of test lot values that will fall within the quality range. Thus, FDA indicates that the standard deviation multiplier (x) should be appropriately justified.
The above interpretation sounds reasonable and easy to justify if we assume that (1)  and (2)
  . In practice, these assumptions may not be true. If we let μT = μR +ε and
  , then the percentage of test lot values that will fall within the quality range depending upon the magnitudes of ε and Δ.
Raw data and graphical comparison for Tier 3
For CQAs in Tier 3 with lowest risk ranking, FDA recommends an approach that uses raw data/graphical comparisons.
The examination of similarity for CQAs in Tier 3 by no means is less stringent, which is acceptable because they have least impact on clinical outcomes in the sense that a notable dis-similarity will not affect clinical outcomes.
An Example
As discussed above, statistical test for assessment of analytical similarity for CQAs from Tier 1 is the most rigorous. Following the concept of FDA’s recommended testing procedures for CQAs from Tier 1, for illustration purpose, consider the following example.
Suppose there are k lots of a reference product (RP) and n lots of a test product (TP) available for analytical similarity assessment, where k>n. For a given CQA, FDA’s recommended procedure can be summarized in the following steps:
Step 1: Matching number of RP lots to TP lots
Since k > n, i.e., there are more reference lots than test lots. The first step is then to match the number of RP lots to TP lots for a head-tohead comparison. To match RP lots to TP lots, FDA suggests randomly selecting n lots out of the k RP lots. If the n lots are not randomly selected from the k RP lots, justification needs to be provided to prevent from selection bias.
Step 2: Remaining independent RP lots for estimating σR
After the matching, the remaining k - n lots are then used to estimate σR in order to set up equivalency acceptance criterion (EAC). It should be noted that if k – n ≤ 2, it is suggested all RP lots be used to estimate σR.
Step 3: Calculate equivalency acceptance criterion (EAC): EAC=1.5 × 
Based on the estimate of σR denoted by , FDA recommends EAC be set as 1.5 × , where c = 1.5 is considered a regulatory standard.
Step 4: Based on c (regulatory standard), , and Δ = μT - μR, an appropriate sample size can be chosen for analytical similarity assessment
As an example, suppose that there are 21 RP lots and 7 TP lots. We first randomly select 7 out of the 21 RP lots to match the 7 TP lots. Suppose that based on the remaining 14 lots, an estimate of σR is given by = 1.04 . Also, suppose that the true difference between the biosimilar product and the reference product is proportional to σR say Δ = σR/8 . Then, the following table with various sample sizes (the number of TP lots available and the corresponding test size and statistical power for detecting the difference of σR/8 is helpful for assessment of analytical assessment.
| Number of RP lots | Number of TP lots | Selection of c | Test size (Confidence Interval) | Statistical Power at (1/8)*RP SD |
|---|---|---|---|---|
| 6 | 6 | 1.5 | 9% (82% CI) | 74% |
| 7 | 7 | 1.5 | 8% (84% CI) | 79% |
| 8 | 8 | 1.5 | 7% (86% CI) | 83% |
| 9 | 9 | 1.5 | 6% (88% CI) | 86% |
| 10 | 10 | 1.5 | 5% (90% CI) | 87% |
Table 1: Assessment of Analytical Similarity for CQAs from Tier 1
According to the above table, there is 79% power for 84% CI of  to fall within ± EAC assuming that the number of lots = 7 and true difference between TP and RP is σR/8 .
It should be noted that this approach has inflated alpha from the 5% to 16%. Note that for a fixed regulatory standard c, the sponsor may appropriately select sample size (the number of lots) for achieving a desired power (for detecting a σR/8 difference) and significance level for analytical similarity assessment. As it can be seen from the above, if one wish to reduce the test size (i.e., α level) from 8% to 5%, 10 TP lots need to be tested. Testing 10 TP lots will give an 87% power for detecting a σR/8 difference.
The above procedures for assessment of analytical similarity reflect FDA’s current thinking on the topic for evaluation of certain quality attributes of a proposed biosimilar product as compared to a reference product. The procedure is straightforward and easy to implement. However, it is not clear its statistical performance and impact on providing totality-of-the-evidence to demonstrating of biosimilarity. Thus, FDA does encourage the sponsor to propose alternative statistical approaches to evaluate quality attributes and support a demonstration that the proposed biosimilar product is highly similar to a US-licensed reference product.
Although the FDA’s recommended procedures (equivalence test, quality range approach, and raw data/graphical comparison) are straightforward and easy to apply, there are still issues that may affect the assessment of analytical similarity. For example, for equivalence test for CQAs from Tier 1, the testing procedure depends upon the selection of regulatory standard c = 1.5, the difference anticipated Δ = μT - μR, and the compromise between the test size (type I error) and statistical power (type II error) for detecting Δ. In addition, it is not clear about what percentage of the CQAs need to pass the equivalence test for acceptance. Is it regulatory agency’s decision or the sponsor’s risk moving forward to the next step (according to the stepwise approach)?
Note that for the equivalence test for Tier 1, quality range approach for Tier 2, and raw data and graphical comparison for Tier 3, FDA also recommends that the same number of replicates be performed within each proposed biosimilar lot as within each reference product lot, and that the same lots be used for equivalence testing, quality range testing, and visual assessment of graphical displays.